Most diverse counties in Texas
Larry D. Moore // Wikimedia Commons
Most diverse counties in Texas
The United States has a longstanding reputation as being a melting pot (or salad bowl), with its diversity manifesting itself across many different demographics. However, some places across the country are notably more heterogeneous than others.
Stacker compiled a list of the most diverse counties in Texas using data from using data from the U.S. Census Bureau. Counties are ranked by the highest Simpson’s diversity index score. Simpson’s diversity index measures community diversity on a scale of 0 (least diverse) to 1 (most diverse), more on the calculation can be read here.
Think you know which counties in your home state might be the most diverse? Keep reading to see if your predictions are correct.
You may also like: Biggest sources of immigrants to Texas
![]()
Larry D. Moore // Wikimedia Commons
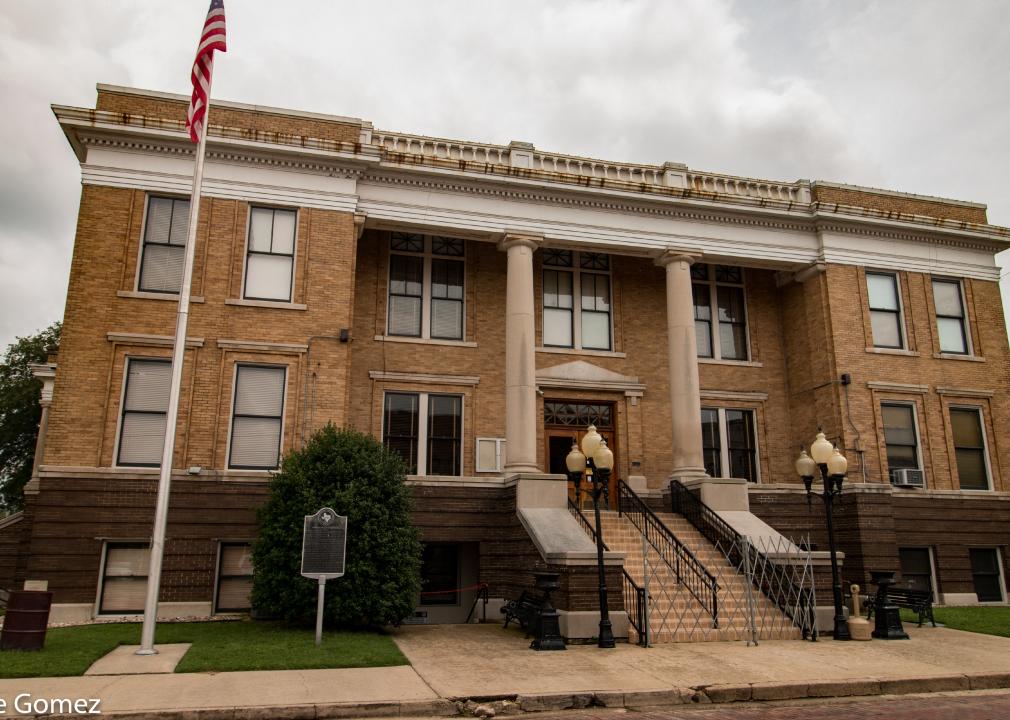
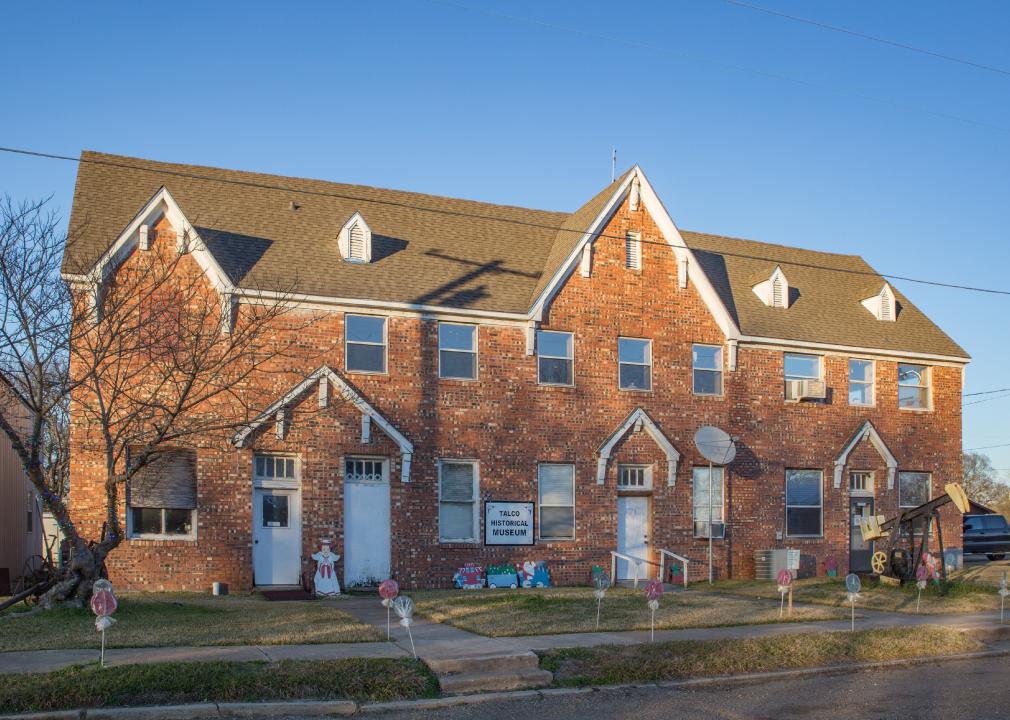
#50. Newton County
– Index: 0.387
– Total population: 13,914
– White: 75.6% (10,517)
– Black or African American: 20.3% (2,823)
– American Indian and Alaska Native: 0.3% (46)
– Asian: 0.6% (77)
– Native Hawaiian and other Pacific Islander: 0.0% (0)
– 2 or more races: 3.0% (412)
– Some other Race: 0.3% (39)
Canva
#49. Collingsworth County
– Index: 0.391
– Total population: 2,969
– White: 76.9% (2,283)
– Black or African American: 9.2% (273)
– American Indian and Alaska Native: 2.1% (62)
– Asian: 0.0% (0)
– Native Hawaiian and other Pacific Islander: 0.0% (0)
– 2 or more races: 3.1% (93)
– Some other Race: 8.7% (258)
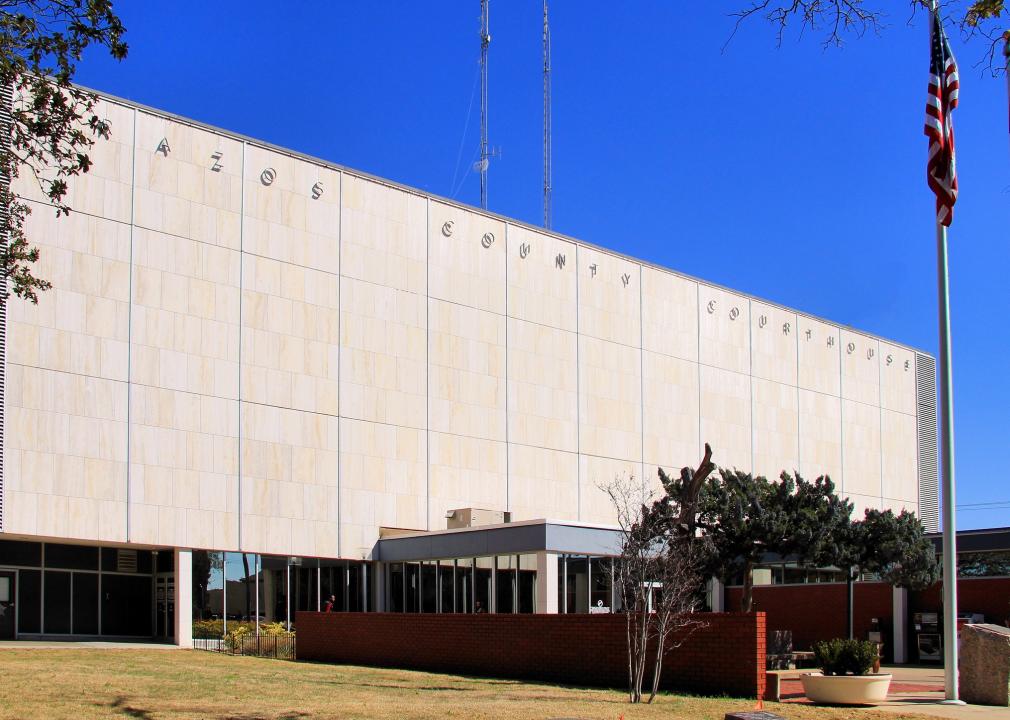
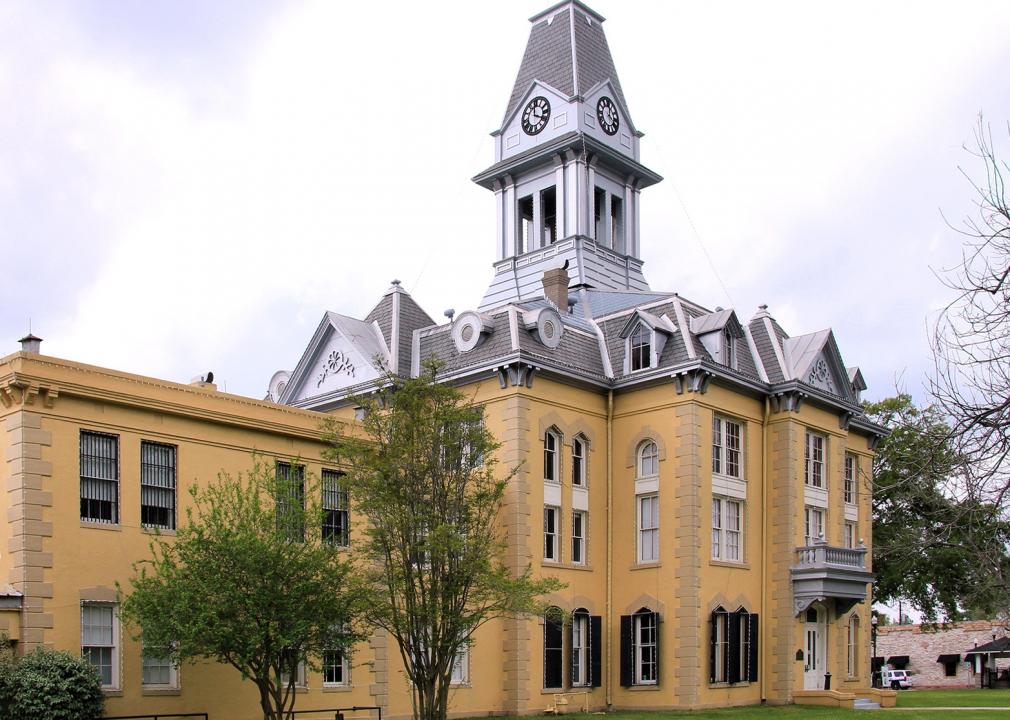
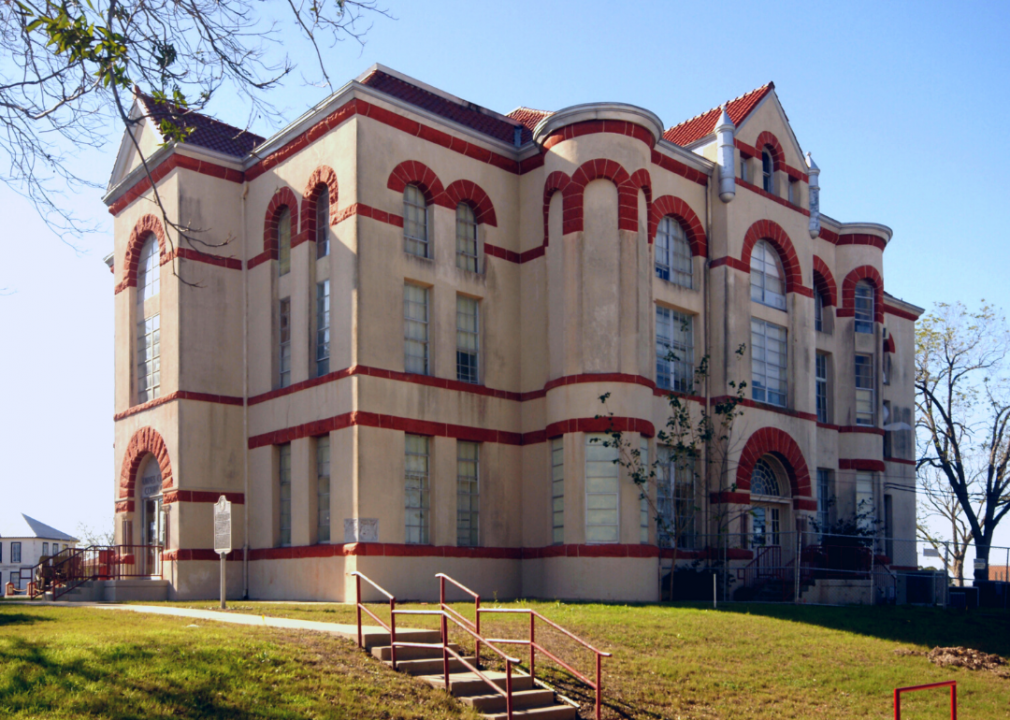
Larry D. Moore // Wikimedia Commons
#48. Brazos County
– Index: 0.394
– Total population: 222,981
– White: 76.8% (171,189)
– Black or African American: 10.7% (23,807)
– American Indian and Alaska Native: 0.4% (798)
– Asian: 6.1% (13,711)
– Native Hawaiian and other Pacific Islander: 0.1% (123)
– 2 or more races: 3.0% (6,633)
– Some other Race: 3.0% (6,720)
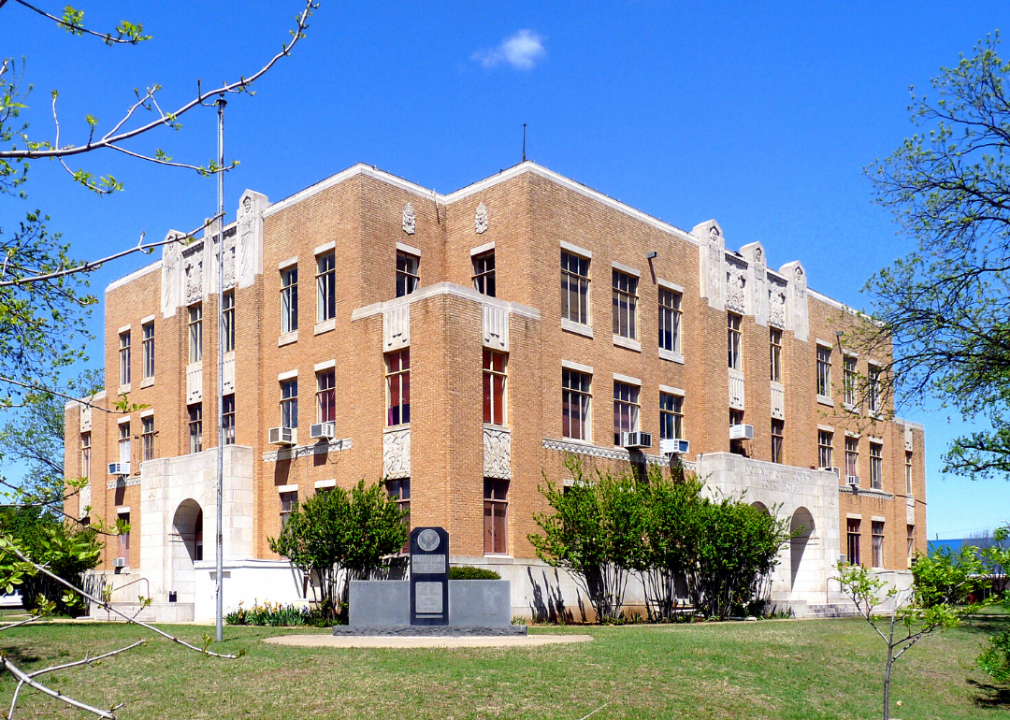
Larry D. Moore // Wikimedia Commons
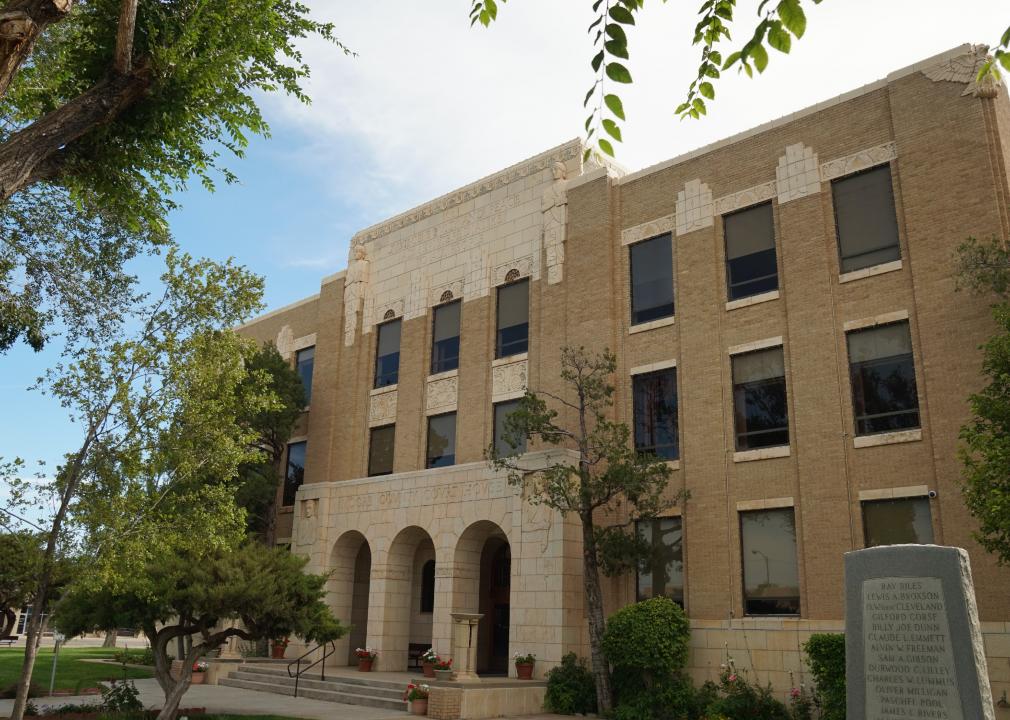
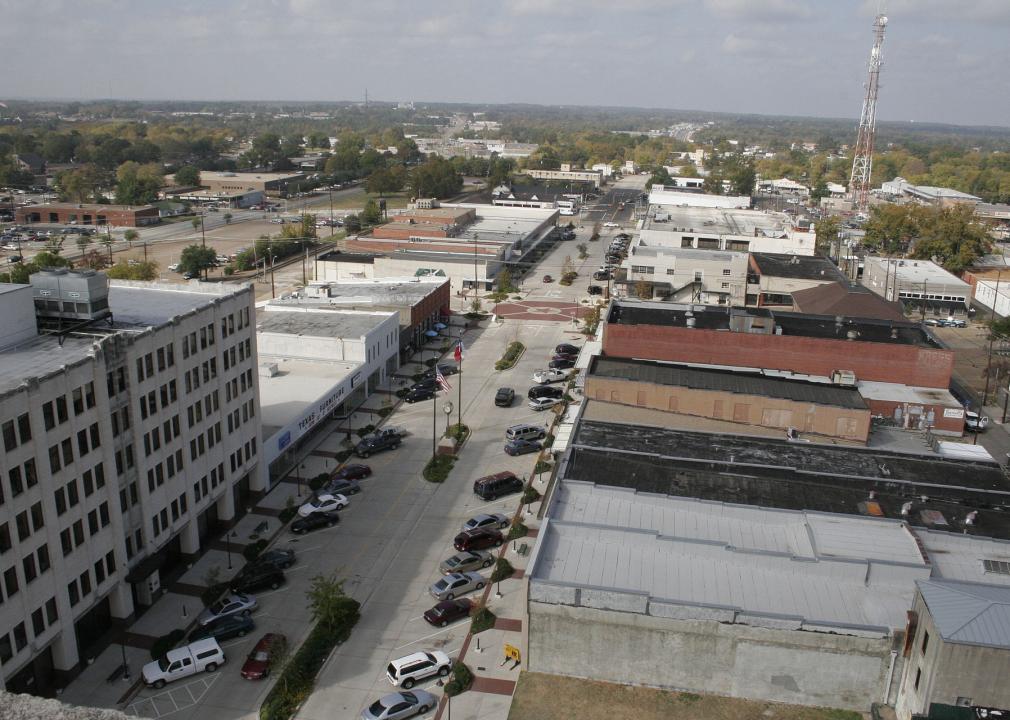
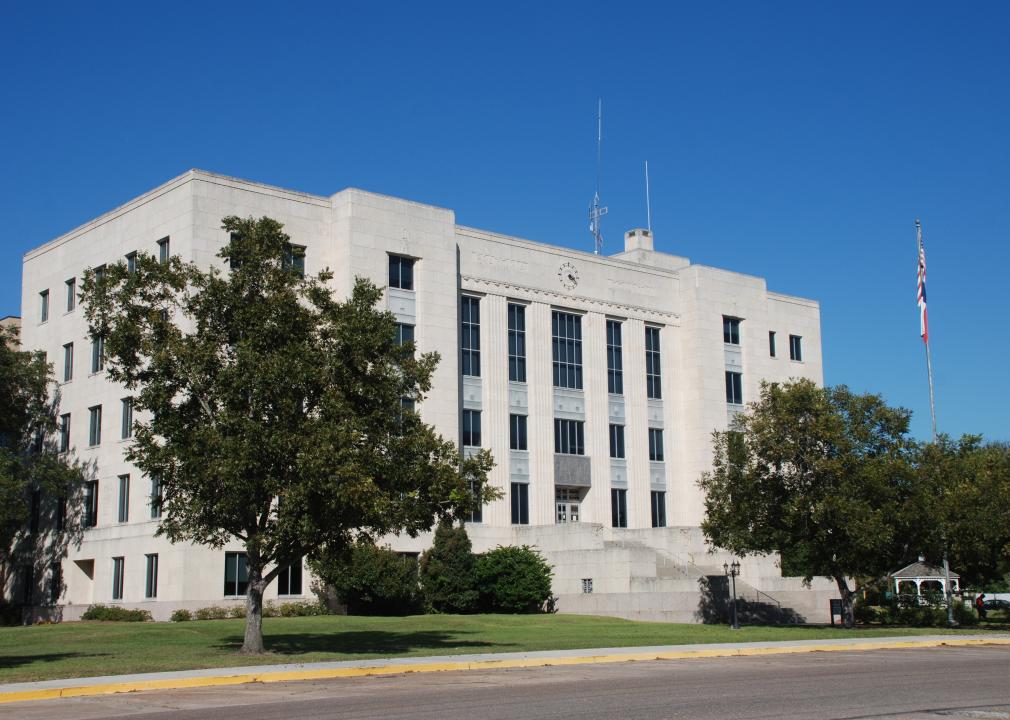
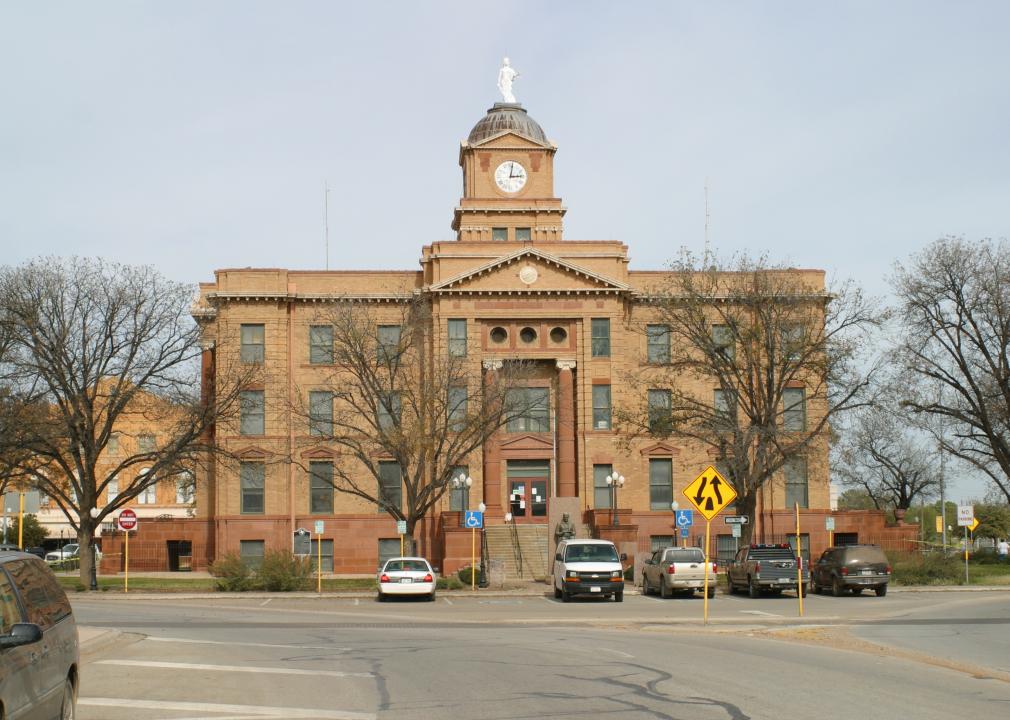
#47. Taylor County
– Index: 0.394
– Total population: 136,870
– White: 76.7% (104,989)
– Black or African American: 8.0% (10,946)
– American Indian and Alaska Native: 0.8% (1,033)
– Asian: 2.2% (3,002)
– Native Hawaiian and other Pacific Islander: 0.0% (44)
– 2 or more races: 2.5% (3,382)
– Some other Race: 9.8% (13,474)
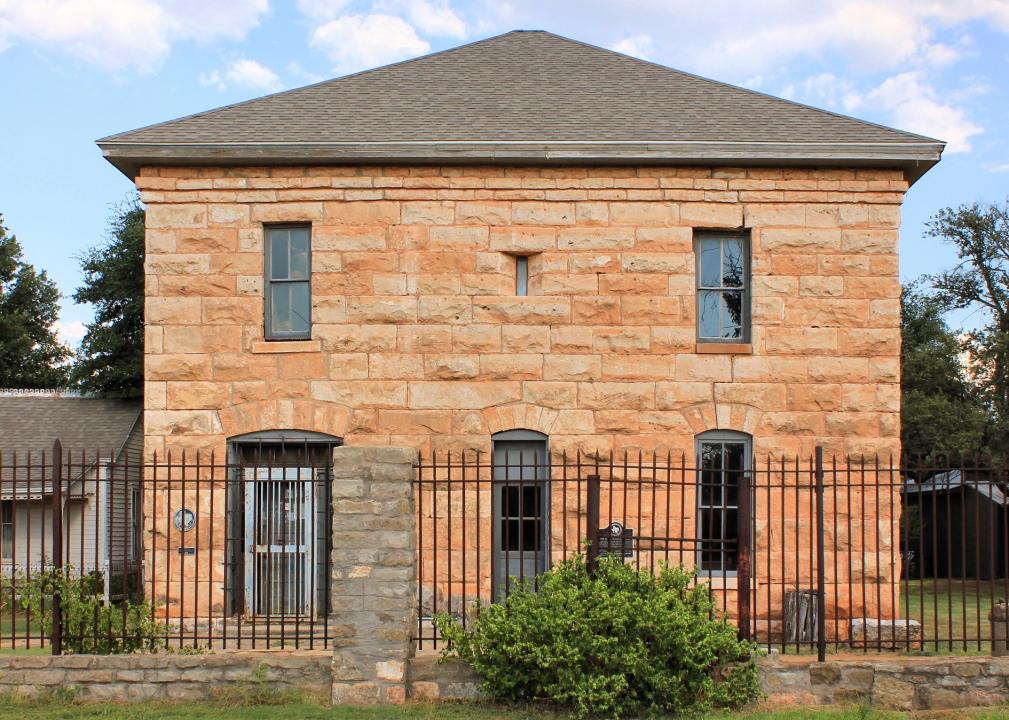
Robert Blaine Camp // Wikimedia Commons
#46. Moore County
– Index: 0.395
– Total population: 21,399
– White: 76.7% (16,420)
– Black or African American: 3.8% (803)
– American Indian and Alaska Native: 0.5% (110)
– Asian: 6.8% (1,463)
– Native Hawaiian and other Pacific Islander: 0.0% (0)
– 2 or more races: 2.5% (537)
– Some other Race: 9.7% (2,066)
You may also like: Highest-rated things to do in Texas, according to Tripadvisor
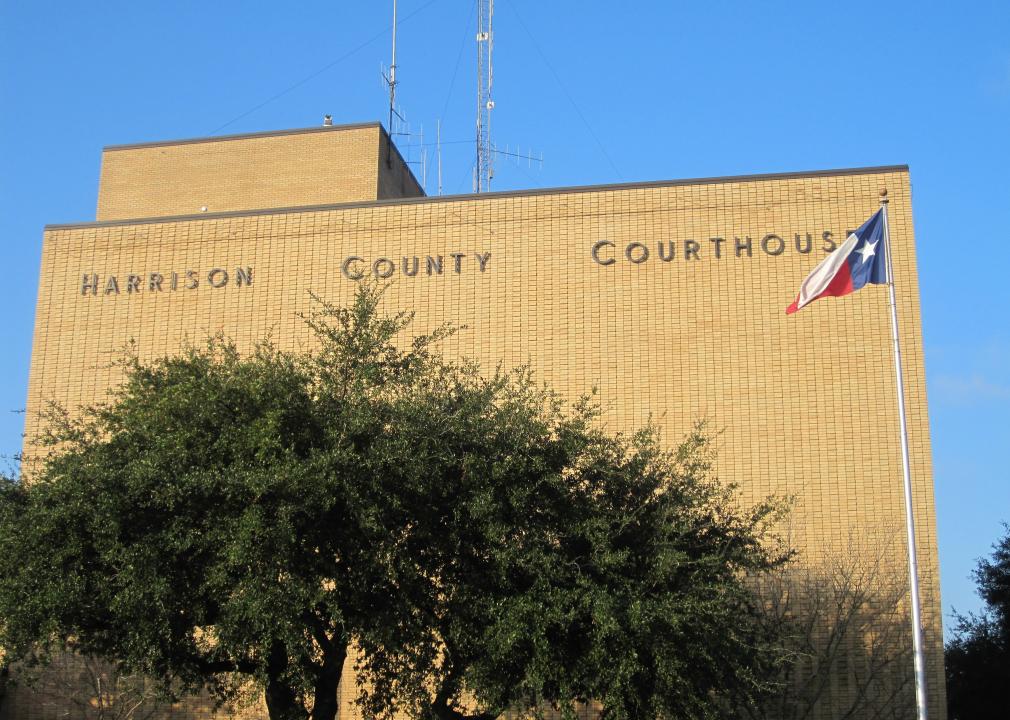
Billy Hathorn // Wikimedia Commons
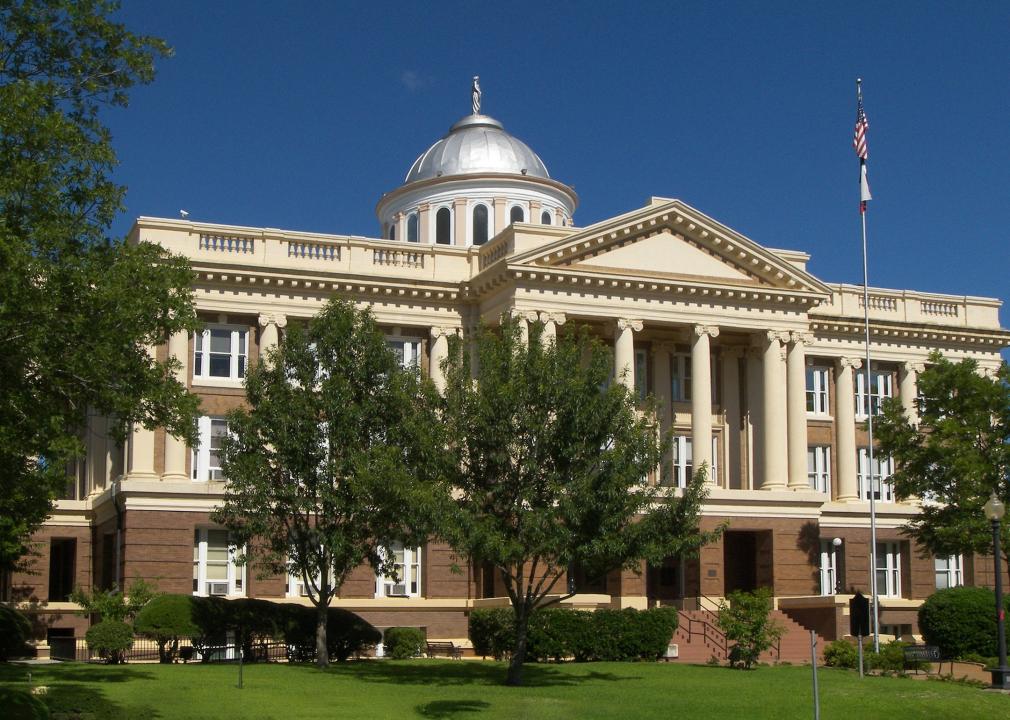
#45. Harrison County
– Index: 0.399
– Total population: 66,580
– White: 74.7% (49,704)
– Black or African American: 20.7% (13,760)
– American Indian and Alaska Native: 0.3% (205)
– Asian: 0.8% (528)
– Native Hawaiian and other Pacific Islander: 0.0% (14)
– 2 or more races: 2.0% (1,349)
– Some other Race: 1.5% (1,020)
Canva
#44. Karnes County
– Index: 0.401
– Total population: 15,545
– White: 76.1% (11,825)
– Black or African American: 6.8% (1,053)
– American Indian and Alaska Native: 0.2% (34)
– Asian: 1.0% (161)
– Native Hawaiian and other Pacific Islander: 0.0% (0)
– 2 or more races: 3.9% (606)
– Some other Race: 12.0% (1,866)
Eaglegrafix // Wikimedia Commons
#43. Gregg County
– Index: 0.402
– Total population: 123,443
– White: 74.6% (92,086)
– Black or African American: 20.0% (24,707)
– American Indian and Alaska Native: 0.2% (271)
– Asian: 1.3% (1,586)
– Native Hawaiian and other Pacific Islander: 0.1% (130)
– 2 or more races: 2.7% (3,367)
– Some other Race: 1.0% (1,296)
Renelibrary // Wikimedia Commons
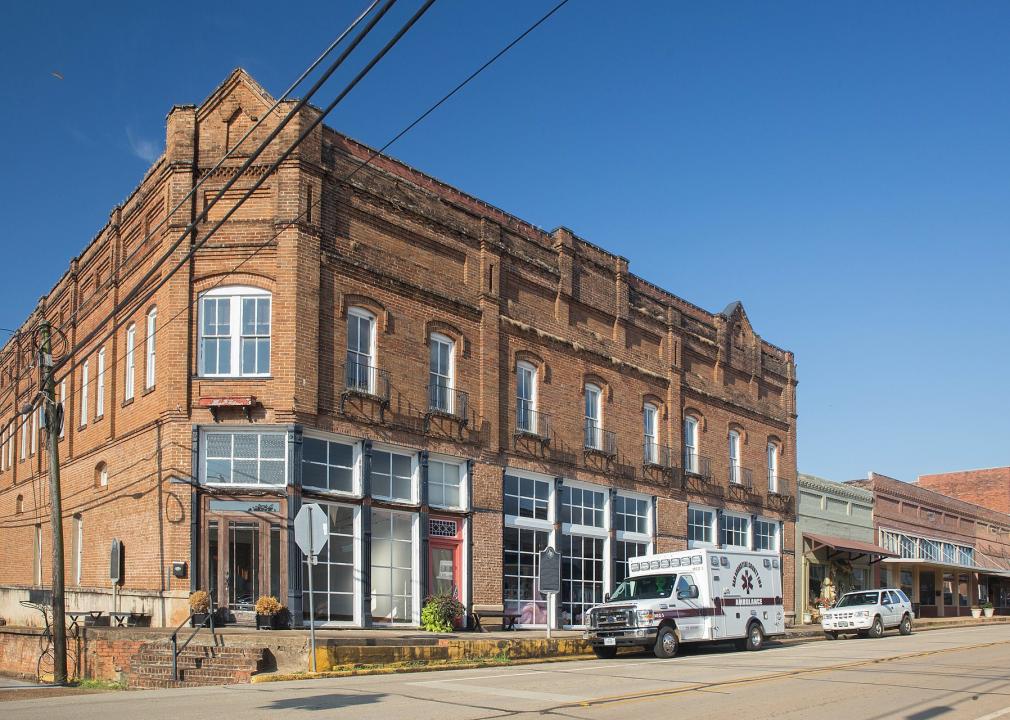
#42. San Augustine County
– Index: 0.410
– Total population: 8,286
– White: 73.8% (6,111)
– Black or African American: 21.3% (1,768)
– American Indian and Alaska Native: 1.6% (132)
– Asian: 0.2% (14)
– Native Hawaiian and other Pacific Islander: 0.0% (0)
– 2 or more races: 2.3% (190)
– Some other Race: 0.9% (71)
Larry D. Moore // Wikimedia Commons
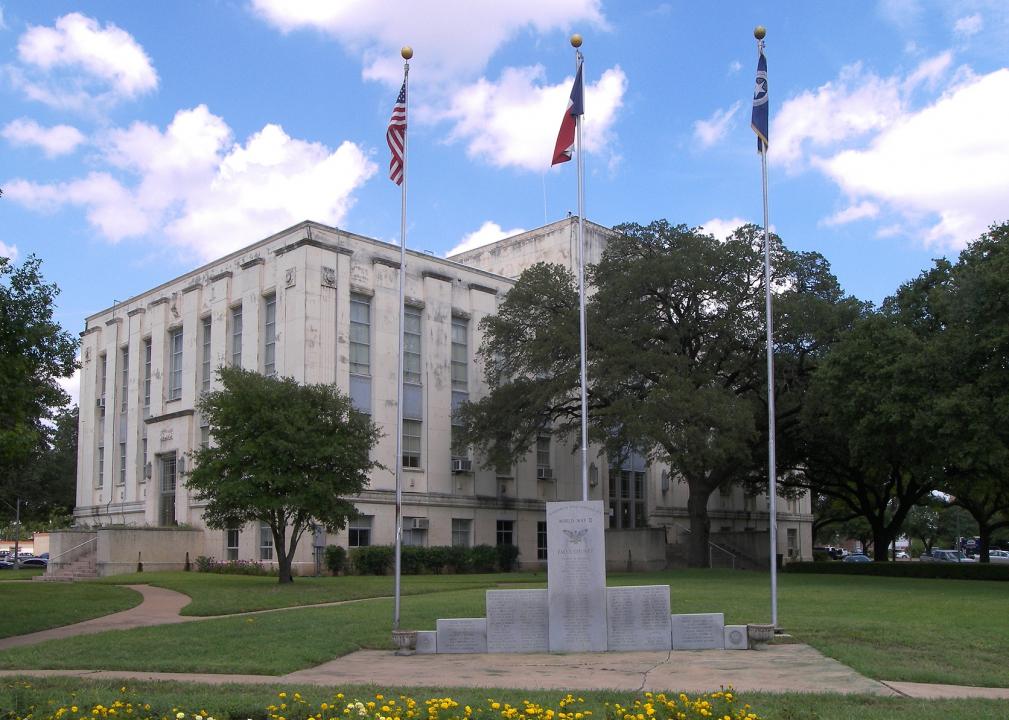
#41. Walker County
– Index: 0.413
– Total population: 72,321
– White: 73.0% (52,800)
– Black or African American: 23.2% (16,780)
– American Indian and Alaska Native: 0.4% (315)
– Asian: 1.3% (920)
– Native Hawaiian and other Pacific Islander: 0.0% (14)
– 2 or more races: 1.4% (1,030)
– Some other Race: 0.6% (462)
You may also like: Counties with the oldest homes in Texas
Library of Congress
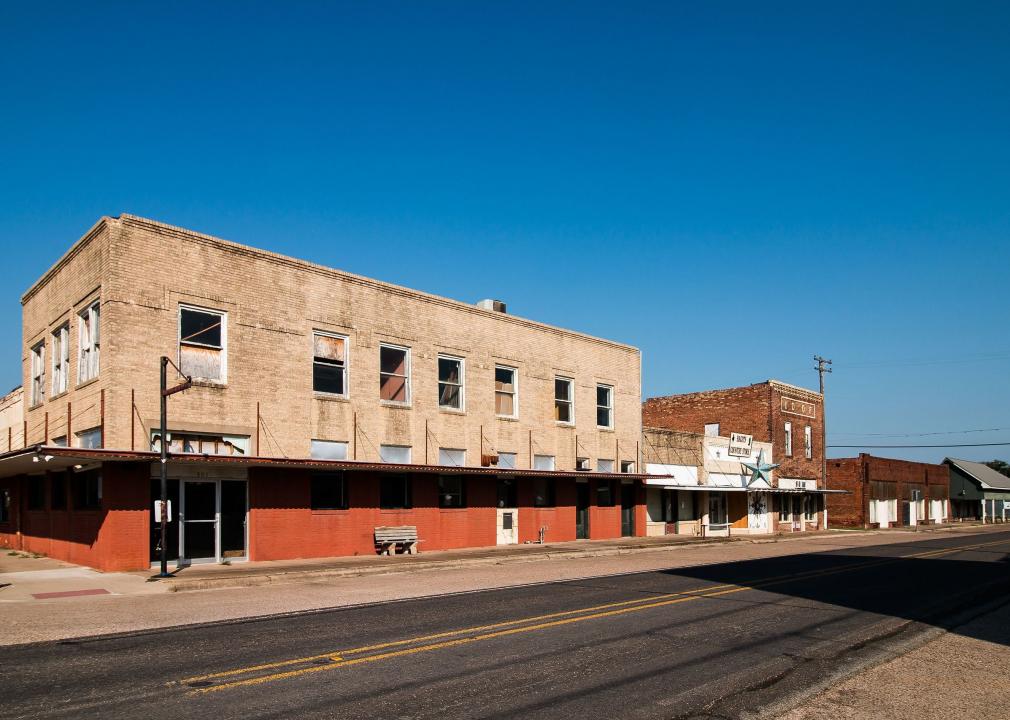
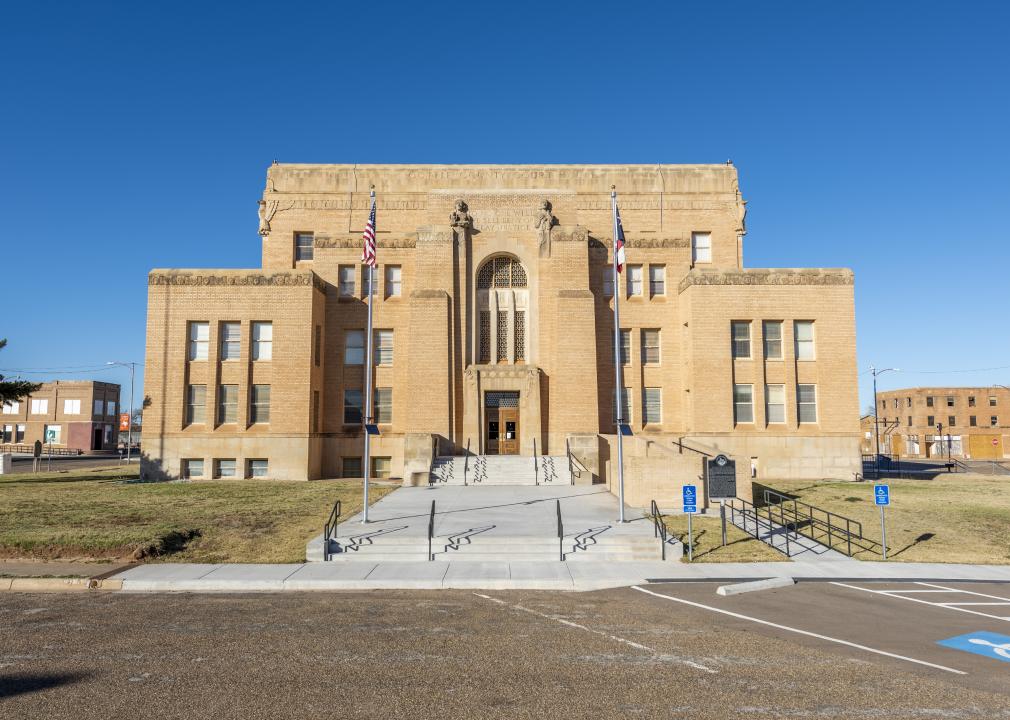
#40. Dawson County
– Index: 0.413
– Total population: 12,813
– White: 75.2% (9,638)
– Black or African American: 8.1% (1,036)
– American Indian and Alaska Native: 1.1% (143)
– Asian: 0.2% (24)
– Native Hawaiian and other Pacific Islander: 0.0% (0)
– 2 or more races: 4.1% (522)
– Some other Race: 11.3% (1,450)
Renelibrary // Wikimedia Commons
#39. Marion County
– Index: 0.417
– Total population: 10,017
– White: 72.8% (7,292)
– Black or African American: 22.9% (2,294)
– American Indian and Alaska Native: 0.1% (11)
– Asian: 0.3% (32)
– Native Hawaiian and other Pacific Islander: 0.4% (41)
– 2 or more races: 1.4% (138)
– Some other Race: 2.1% (209)
Larry D. Moore // Wikimedia Commons
#38. Anderson County
– Index: 0.421
– Total population: 57,810
– White: 73.0% (42,217)
– Black or African American: 21.0% (12,124)
– American Indian and Alaska Native: 0.5% (317)
– Asian: 0.6% (321)
– Native Hawaiian and other Pacific Islander: 0.0% (9)
– 2 or more races: 1.5% (896)
– Some other Race: 3.3% (1,926)
Larry D. Moore // Wikimedia Commons
#37. Falls County
– Index: 0.421
– Total population: 17,272
– White: 72.0% (12,433)
– Black or African American: 24.5% (4,233)
– American Indian and Alaska Native: 0.5% (86)
– Asian: 0.5% (82)
– Native Hawaiian and other Pacific Islander: 0.0% (0)
– 2 or more races: 1.0% (181)
– Some other Race: 1.5% (257)
Renelibrary // Wikimedia Commons
#36. Navarro County
– Index: 0.428
– Total population: 48,995
– White: 74.3% (36,379)
– Black or African American: 12.2% (5,985)
– American Indian and Alaska Native: 1.9% (924)
– Asian: 0.7% (333)
– Native Hawaiian and other Pacific Islander: 1.6% (761)
– 2 or more races: 2.9% (1,403)
– Some other Race: 6.6% (3,210)
You may also like: Counties with the worst commutes in Texas
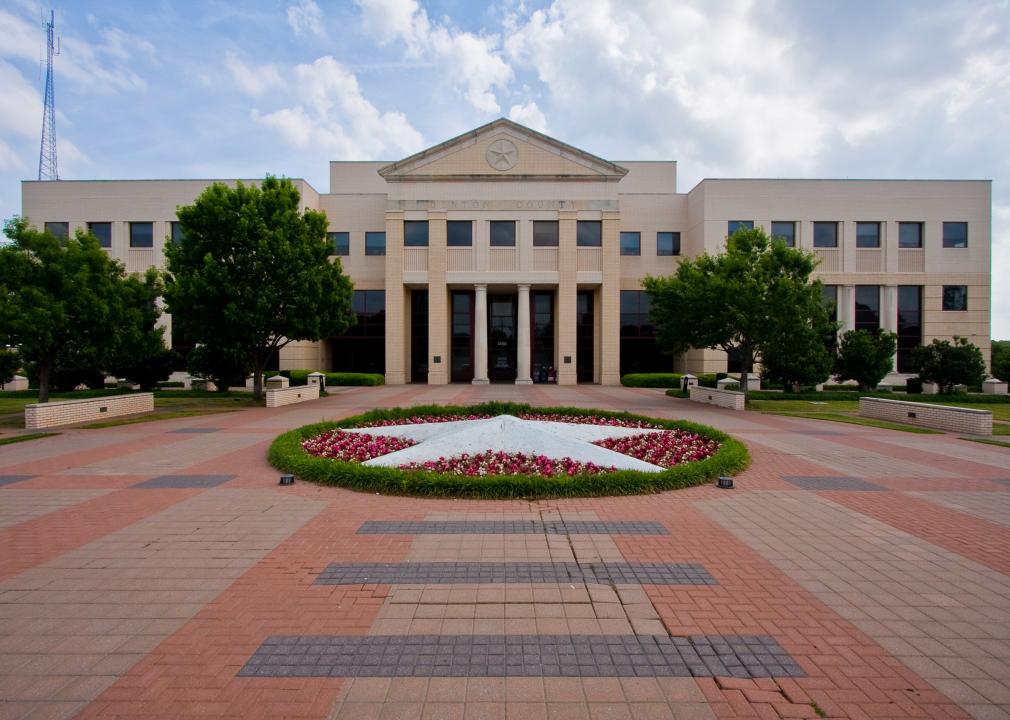
Mick Watson from Atascocita, Texas // Wikimedia Commons
#35. Denton County
– Index: 0.428
– Total population: 833,822
– White: 74.3% (619,566)
– Black or African American: 9.8% (81,758)
– American Indian and Alaska Native: 0.5% (3,993)
– Asian: 8.7% (72,510)
– Native Hawaiian and other Pacific Islander: 0.1% (707)
– 2 or more races: 3.6% (30,187)
– Some other Race: 3.0% (25,101)
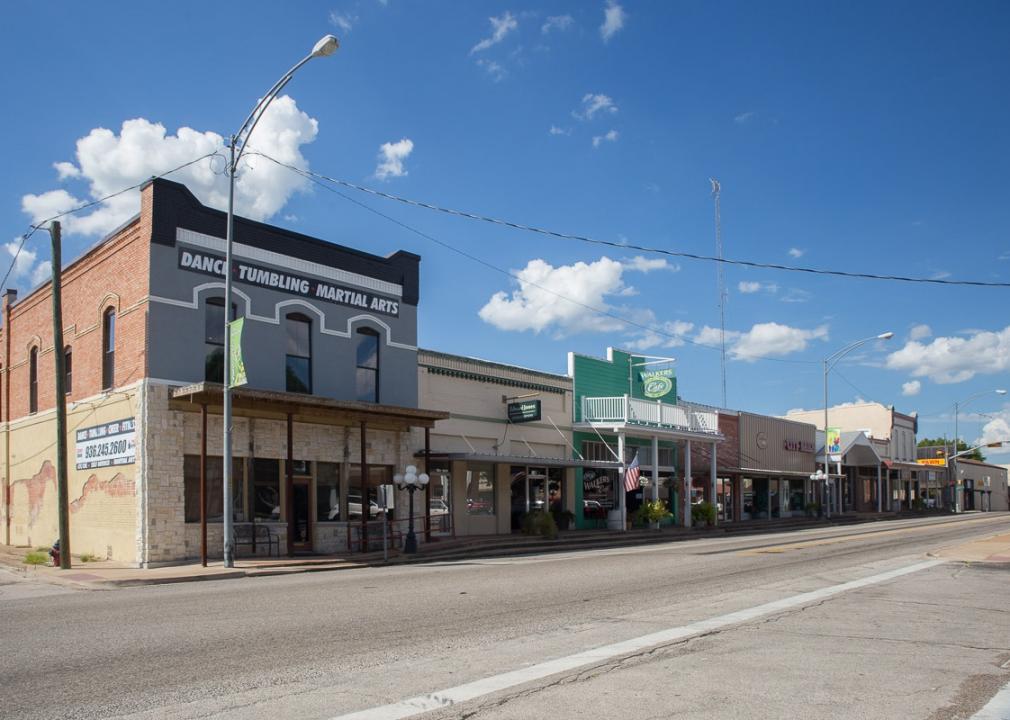
Larry D. Moore // Wikimedia Commons
#34. Colorado County
– Index: 0.435
– Total population: 21,224
– White: 73.1% (15,520)
– Black or African American: 12.9% (2,740)
– American Indian and Alaska Native: 0.3% (64)
– Asian: 0.0% (5)
– Native Hawaiian and other Pacific Islander: 0.0% (0)
– 2 or more races: 1.9% (407)
– Some other Race: 11.7% (2,488)
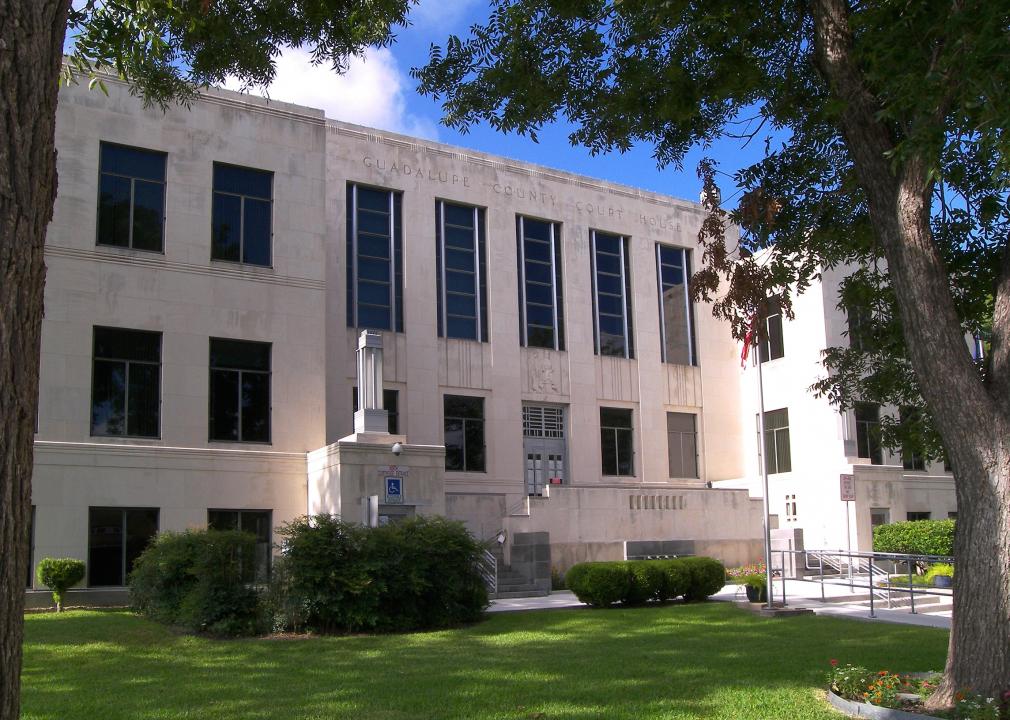
Larry D. Moore // Wikimedia Commons
#33. Guadalupe County
– Index: 0.436
– Total population: 158,966
– White: 73.5% (116,778)
– Black or African American: 8.2% (13,085)
– American Indian and Alaska Native: 0.3% (524)
– Asian: 1.7% (2,720)
– Native Hawaiian and other Pacific Islander: 0.2% (377)
– 2 or more races: 3.2% (5,038)
– Some other Race: 12.9% (20,444)
Renelibrary // Wikimedia Commons
#32. Madison County
– Index: 0.437
– Total population: 14,197
– White: 73.0% (10,357)
– Black or African American: 16.4% (2,332)
– American Indian and Alaska Native: 0.2% (26)
– Asian: 3.4% (477)
– Native Hawaiian and other Pacific Islander: 0.1% (10)
– 2 or more races: 2.6% (364)
– Some other Race: 4.4% (631)
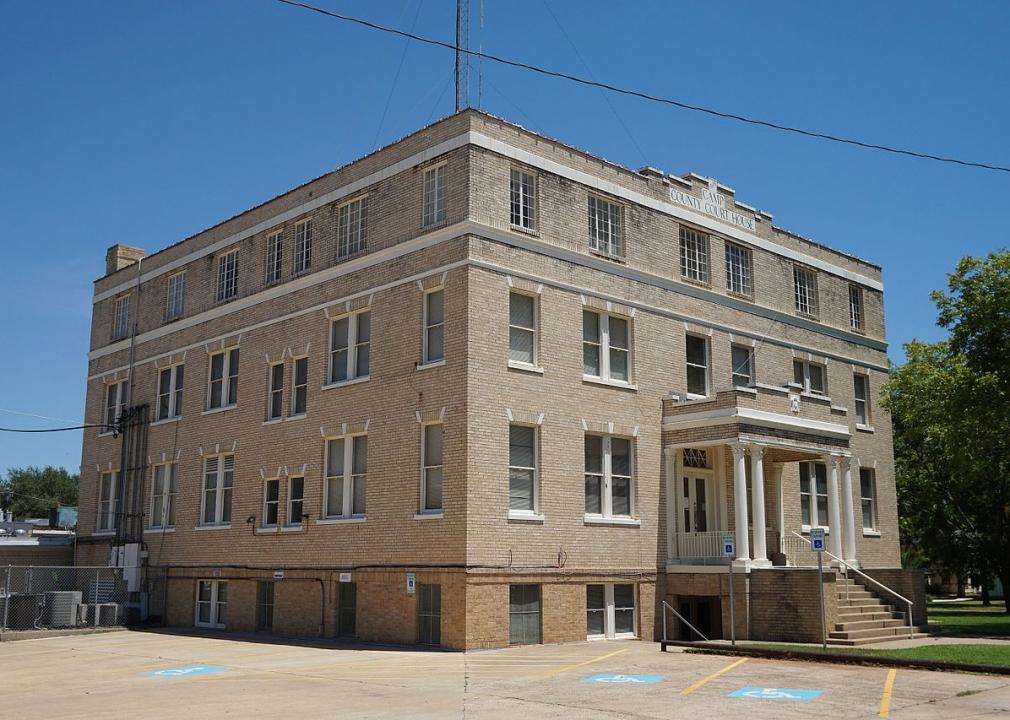
Renelibrary // Wikimedia Commons
#31. Camp County
– Index: 0.440
– Total population: 12,878
– White: 72.5% (9,341)
– Black or African American: 16.6% (2,136)
– American Indian and Alaska Native: 0.5% (58)
– Asian: 0.4% (56)
– Native Hawaiian and other Pacific Islander: 0.0% (0)
– 2 or more races: 2.9% (368)
– Some other Race: 7.1% (919)
You may also like: Recipes from Texas
Aualliso // Wikimedia Commons
#30. Coryell County
– Index: 0.443
– Total population: 75,280
– White: 72.8% (54,825)
– Black or African American: 13.6% (10,234)
– American Indian and Alaska Native: 0.8% (567)
– Asian: 2.1% (1,546)
– Native Hawaiian and other Pacific Islander: 0.8% (592)
– 2 or more races: 8.9% (6,693)
– Some other Race: 1.1% (823)
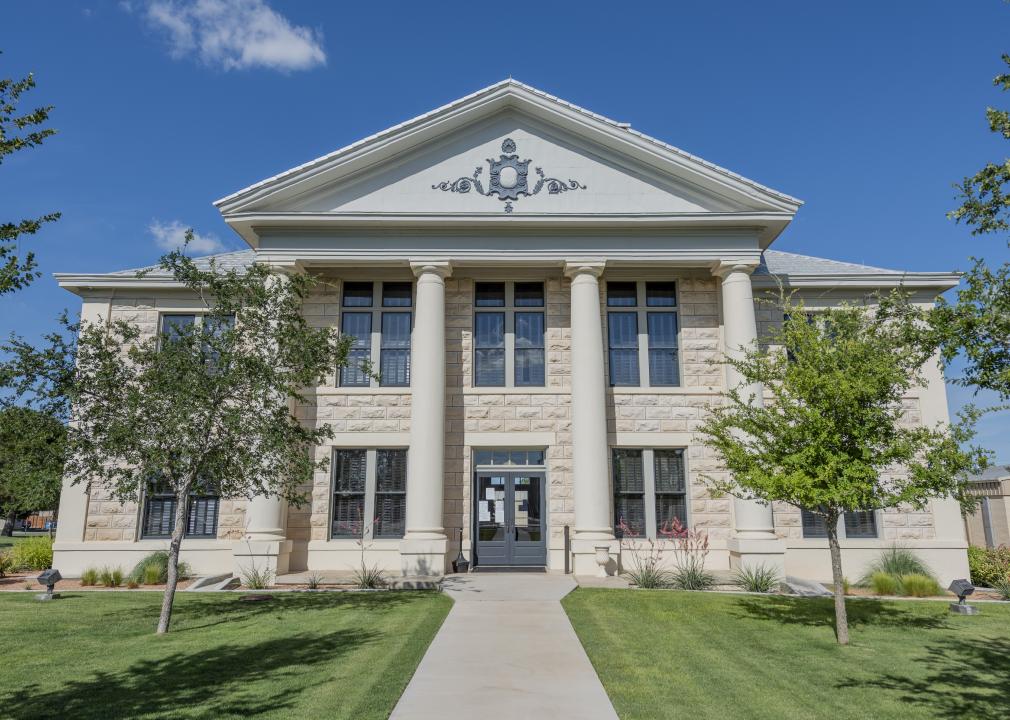
Aualliso // Wikimedia Commons
#29. Glasscock County
– Index: 0.446
– Total population: 1,510
– White: 66.4% (1,003)
– Black or African American: 0.0% (0)
– American Indian and Alaska Native: 0.0% (0)
– Asian: 0.0% (0)
– Native Hawaiian and other Pacific Islander: 0.0% (0)
– 2 or more races: 0.0% (0)
– Some other Race: 33.6% (507)
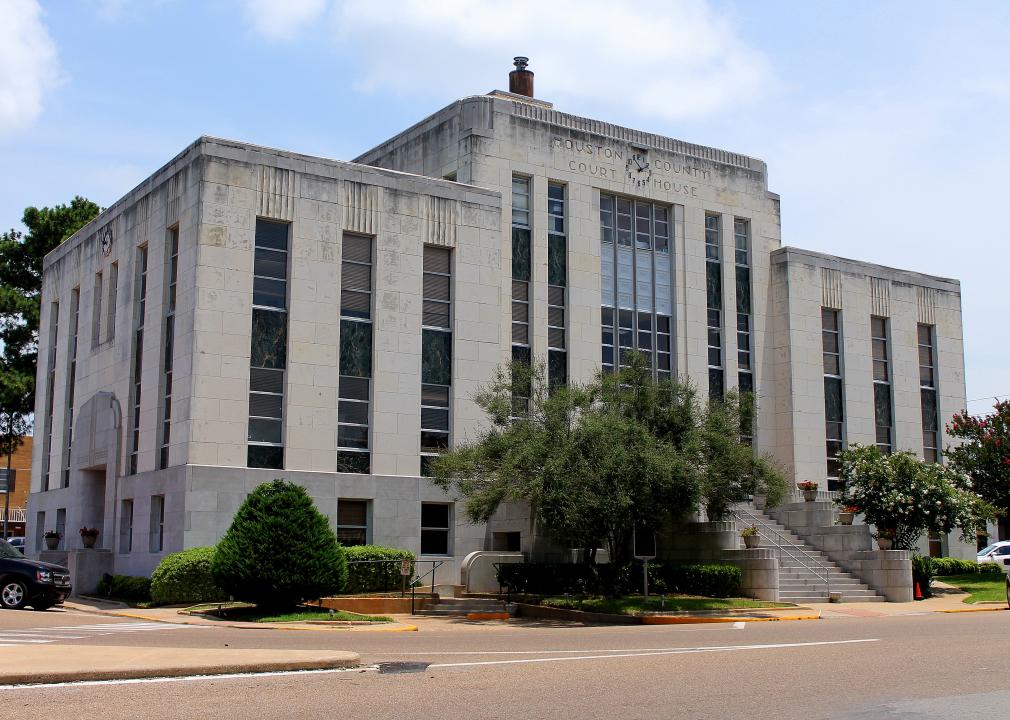
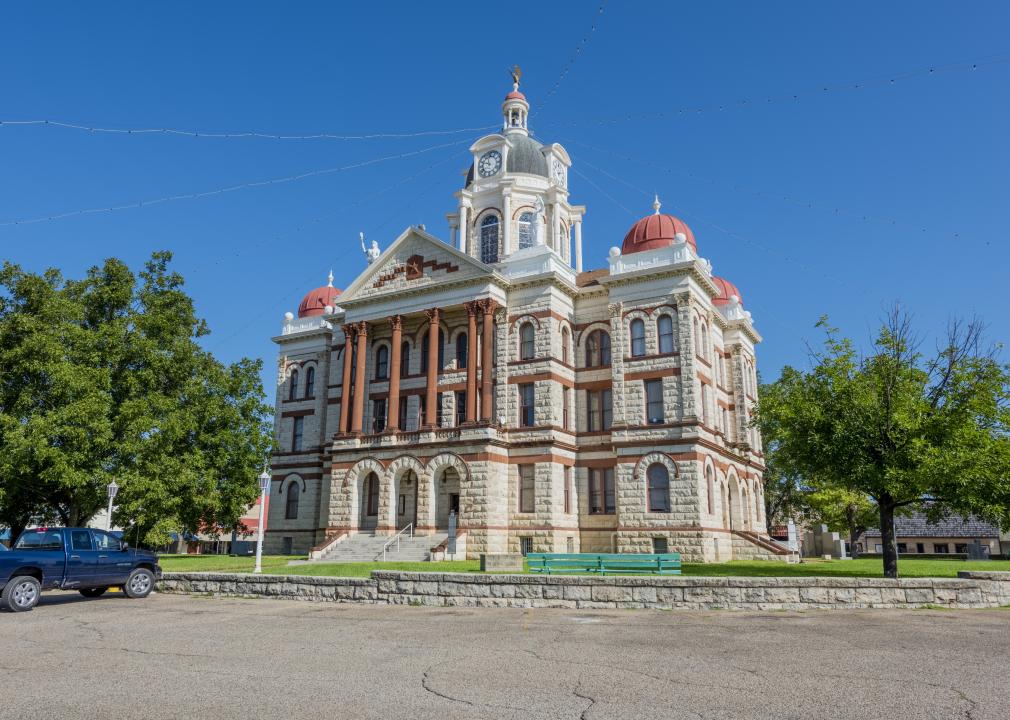
Renelibrary // Wikimedia Commons
#28. Houston County
– Index: 0.447
– Total population: 22,954
– White: 69.7% (16,003)
– Black or African American: 25.7% (5,888)
– American Indian and Alaska Native: 0.4% (82)
– Asian: 0.4% (88)
– Native Hawaiian and other Pacific Islander: 0.0% (0)
– 2 or more races: 1.8% (420)
– Some other Race: 2.1% (473)
Adavyd // Wikimedia Commons
#27. Brazoria County
– Index: 0.450
– Total population: 360,677
– White: 72.4% (261,164)
– Black or African American: 14.0% (50,437)
– American Indian and Alaska Native: 0.7% (2,401)
– Asian: 6.7% (24,110)
– Native Hawaiian and other Pacific Islander: 0.0% (47)
– 2 or more races: 2.2% (7,996)
– Some other Race: 4.0% (14,522)
天王星 // Wikimedia Commons
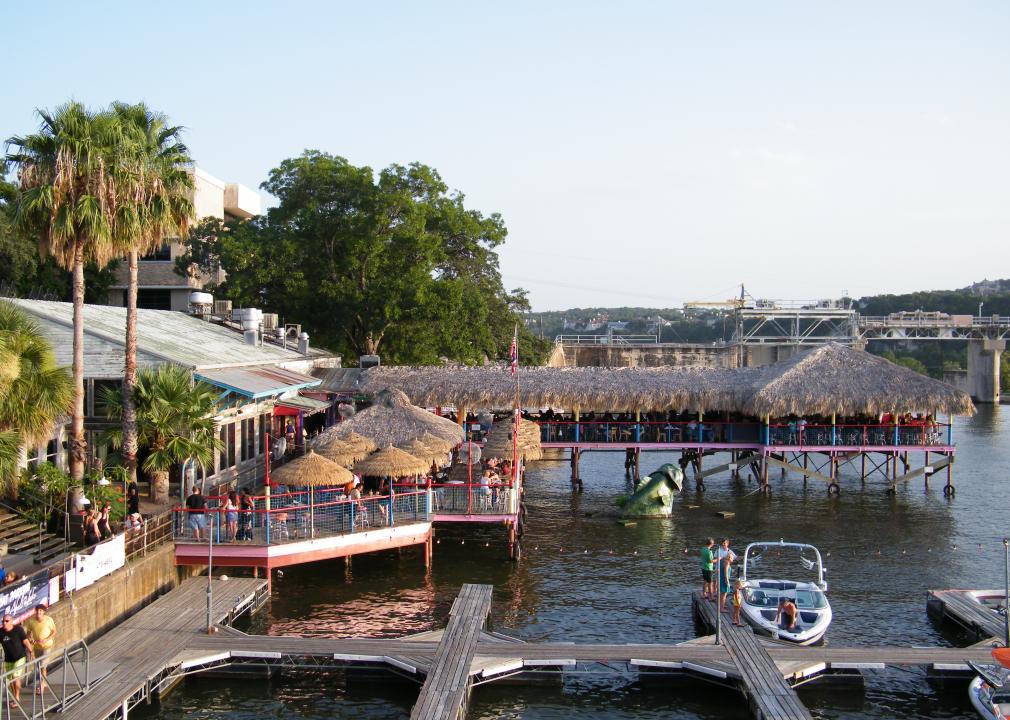
#26. Travis County
– Index: 0.455
– Total population: 1.2 million
– White: 72.5% (889,046)
– Black or African American: 8.3% (101,955)
– American Indian and Alaska Native: 0.6% (7,716)
– Asian: 6.7% (82,257)
– Native Hawaiian and other Pacific Islander: 0.1% (650)
– 2 or more races: 3.6% (44,120)
– Some other Race: 8.2% (101,061)
You may also like: Highest-rated specialty museums in Texas, according to Tripadvisor
Mark Oxner // Wikimedia Commons
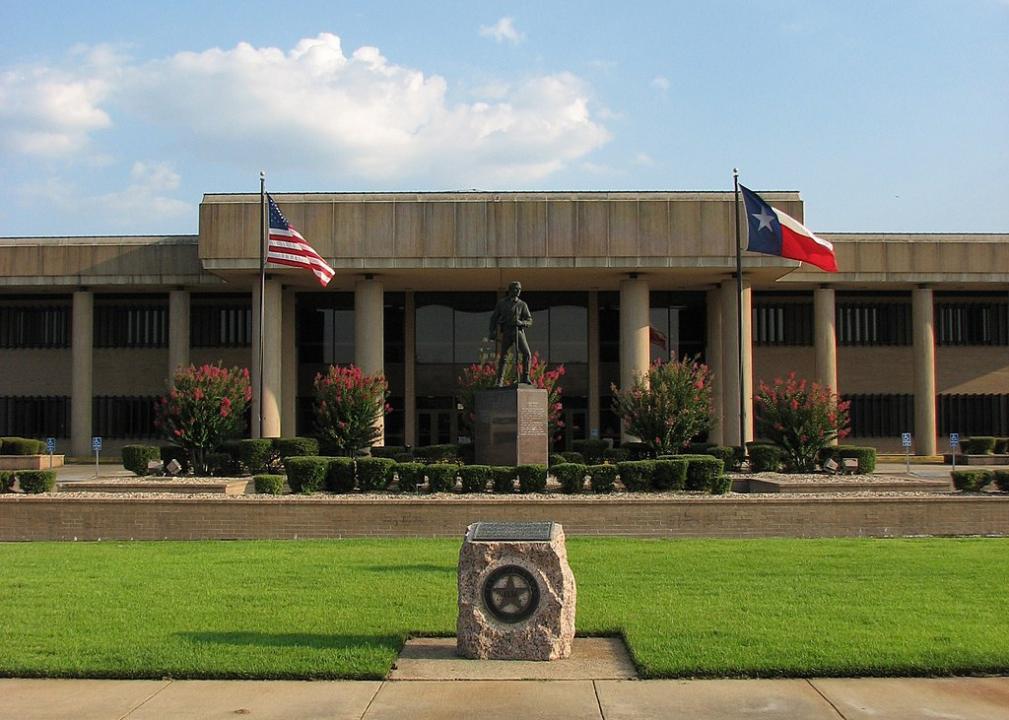
#25. Bowie County
– Index: 0.460
– Total population: 93,373
– White: 69.2% (64,586)
– Black or African American: 24.5% (22,879)
– American Indian and Alaska Native: 0.9% (879)
– Asian: 1.1% (983)
– Native Hawaiian and other Pacific Islander: 0.0% (44)
– 2 or more races: 2.8% (2,619)
– Some other Race: 1.5% (1,383)
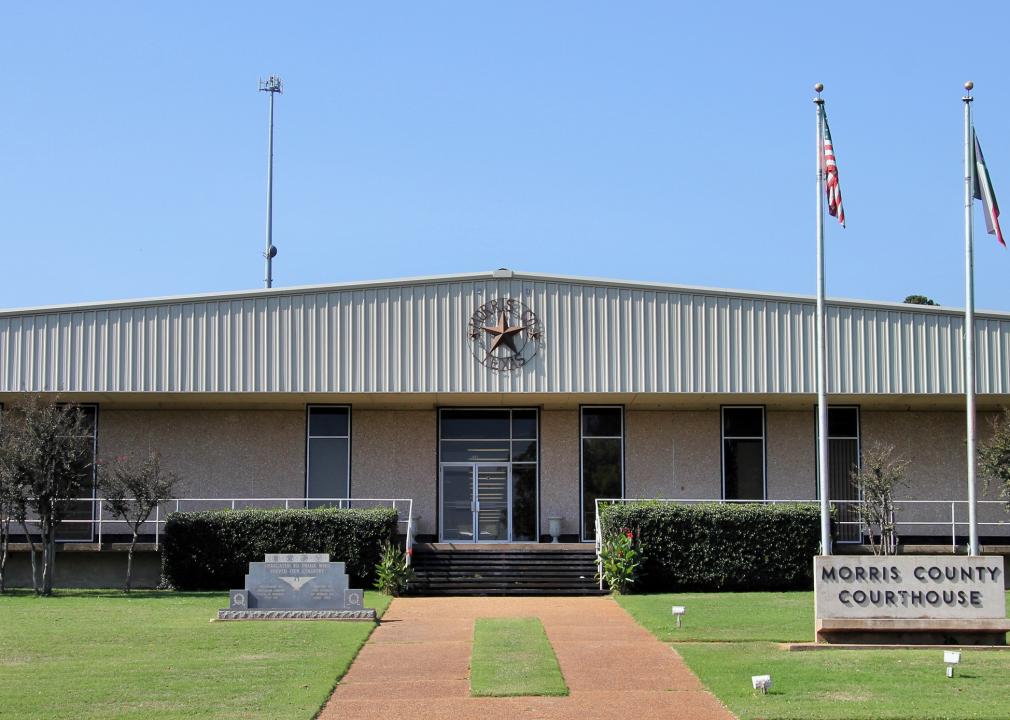
Larry D. Moore // Wikimedia Commons
#24. Morris County
– Index: 0.464
– Total population: 12,373
– White: 69.3% (8,570)
– Black or African American: 23.3% (2,882)
– American Indian and Alaska Native: 0.3% (38)
– Asian: 0.2% (20)
– Native Hawaiian and other Pacific Islander: 0.1% (8)
– 2 or more races: 2.7% (338)
– Some other Race: 4.2% (517)
Renelibrary // Wikimedia Commons
#23. Titus County
– Index: 0.469
– Total population: 32,640
– White: 70.4% (22,968)
– Black or African American: 9.0% (2,926)
– American Indian and Alaska Native: 0.9% (289)
– Asian: 1.1% (357)
– Native Hawaiian and other Pacific Islander: 0.0% (12)
– 2 or more races: 2.3% (747)
– Some other Race: 16.4% (5,341)
Larry D. Moore // Wikimedia Commons
#22. Hudspeth County
– Index: 0.472
– Total population: 4,415
– White: 67.4% (2,974)
– Black or African American: 2.0% (89)
– American Indian and Alaska Native: 0.0% (2)
– Asian: 0.8% (34)
– Native Hawaiian and other Pacific Islander: 0.0% (0)
– 2 or more races: 2.7% (119)
– Some other Race: 27.1% (1,197)
Aualliso // Wikimedia Commons
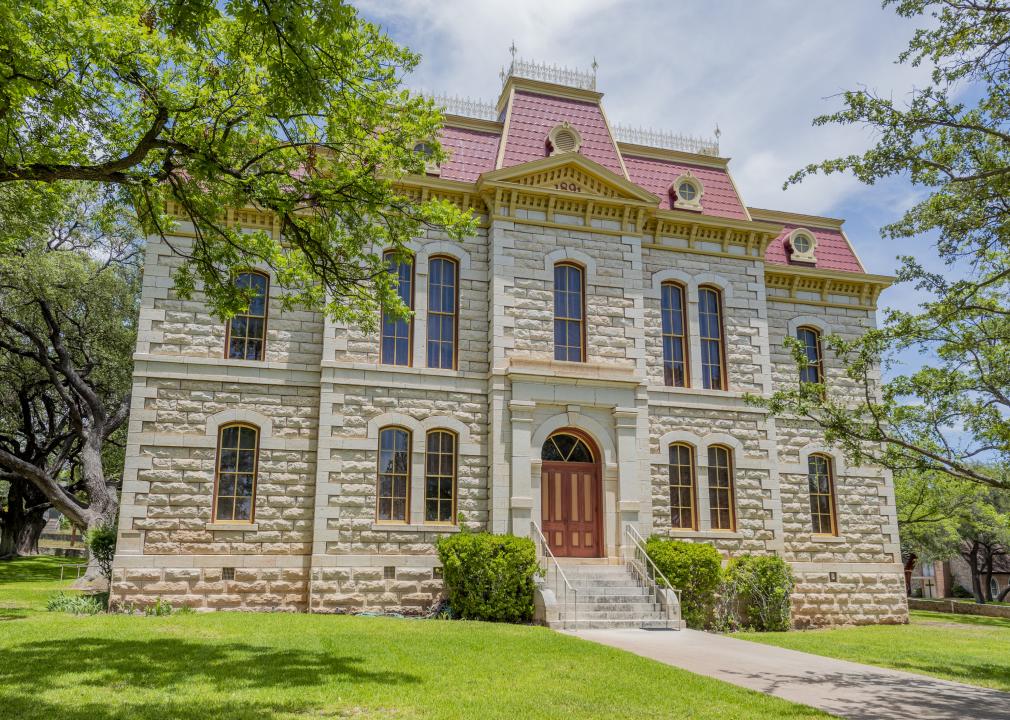
#21. Sutton County
– Index: 0.473
– Total population: 3,824
– White: 62.6% (2,395)
– Black or African American: 0.1% (3)
– American Indian and Alaska Native: 0.4% (14)
– Asian: 0.0% (0)
– Native Hawaiian and other Pacific Islander: 0.2% (6)
– 2 or more races: 0.0% (0)
– Some other Race: 36.8% (1,406)
You may also like: States sending the most people to Texas
Aualliso // Wikimedia Commons
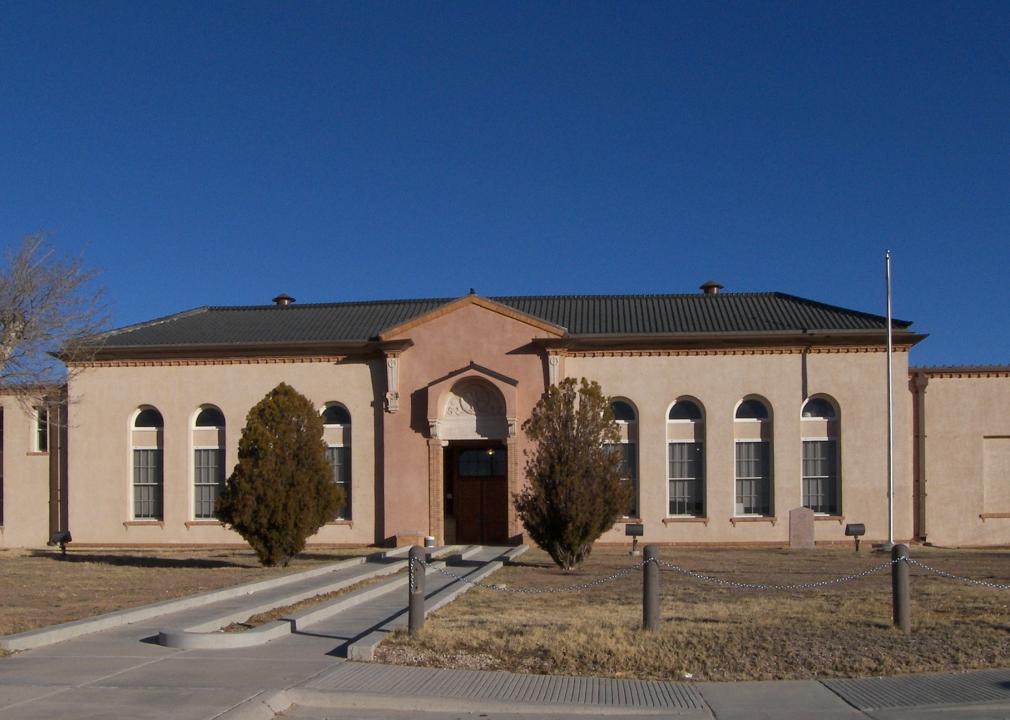
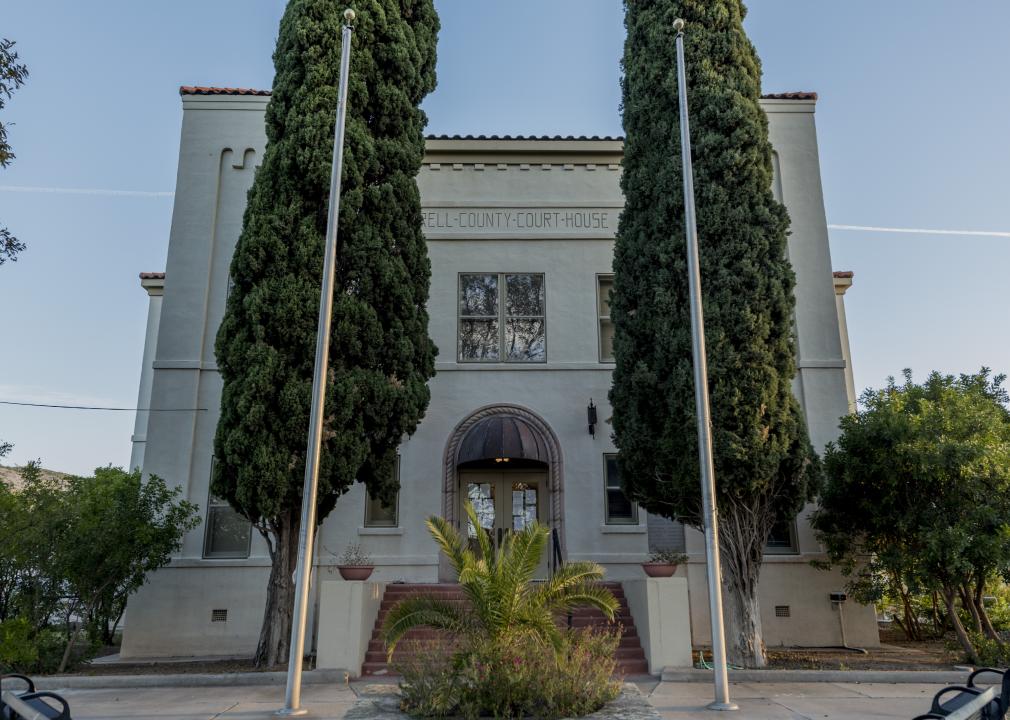
#20. Terrell County
– Index: 0.473
– Total population: 896
– White: 66.1% (592)
– Black or African American: 1.1% (10)
– American Indian and Alaska Native: 0.3% (3)
– Asian: 0.0% (0)
– Native Hawaiian and other Pacific Islander: 0.0% (0)
– 2 or more races: 2.5% (22)
– Some other Race: 30.0% (269)
Leaflet // Wikimedia Commons
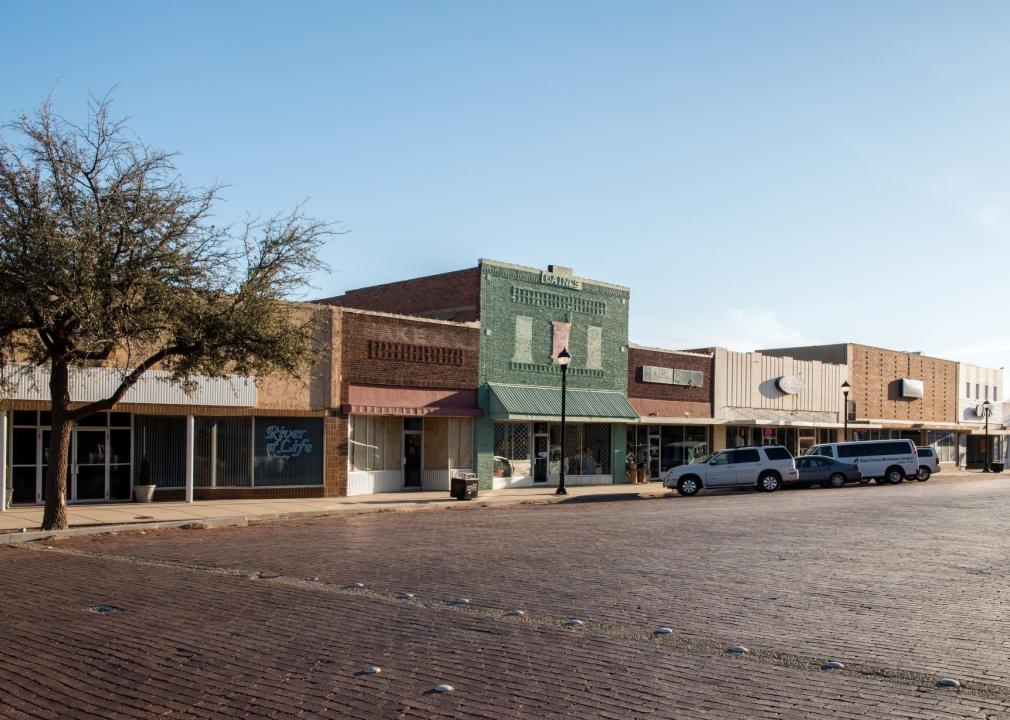
#19. Jones County
– Index: 0.476
– Total population: 19,943
– White: 70.2% (13,992)
– Black or African American: 14.5% (2,889)
– American Indian and Alaska Native: 0.6% (124)
– Asian: 0.4% (77)
– Native Hawaiian and other Pacific Islander: 0.0% (0)
– 2 or more races: 5.7% (1,142)
– Some other Race: 8.6% (1,719)
Aualliso // Wikimedia Commons
#18. Cottle County
– Index: 0.478
– Total population: 1,642
– White: 70.0% (1,149)
– Black or African American: 14.5% (238)
– American Indian and Alaska Native: 0.9% (15)
– Asian: 0.0% (0)
– Native Hawaiian and other Pacific Islander: 0.0% (0)
– 2 or more races: 4.9% (81)
– Some other Race: 9.7% (159)
Aualliso // Wikimedia Commons
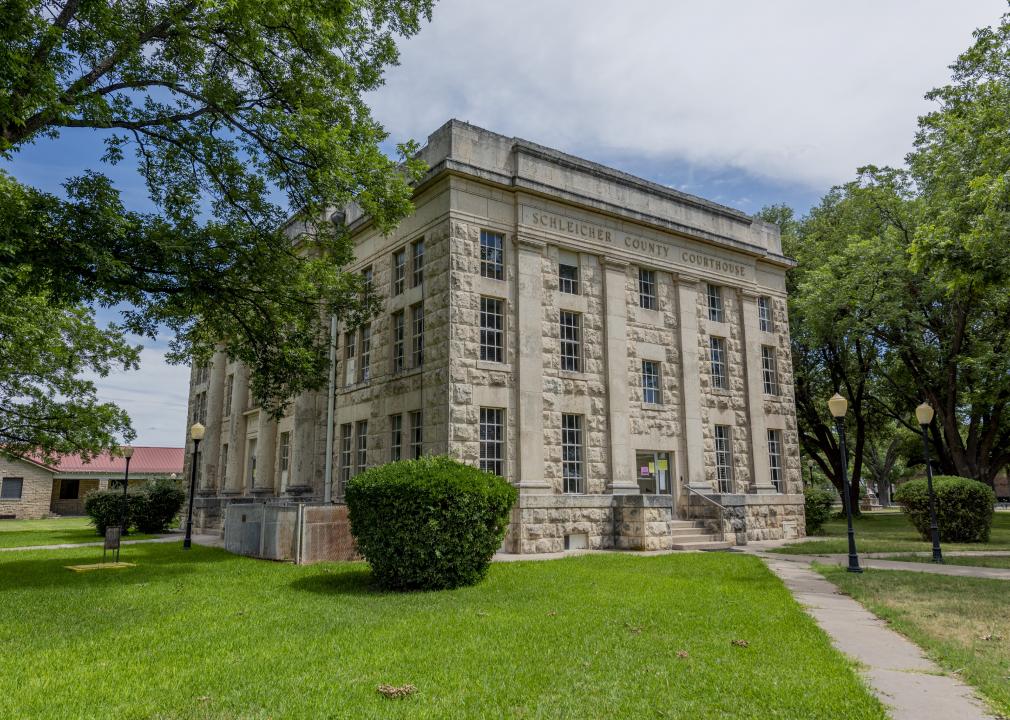
#17. Schleicher County
– Index: 0.479
– Total population: 2,983
– White: 62.1% (1,853)
– Black or African American: 0.5% (16)
– American Indian and Alaska Native: 0.0% (0)
– Asian: 0.0% (0)
– Native Hawaiian and other Pacific Islander: 0.4% (11)
– 2 or more races: 0.2% (5)
– Some other Race: 36.8% (1,098)
Larry D. Moore // Wikimedia Commons
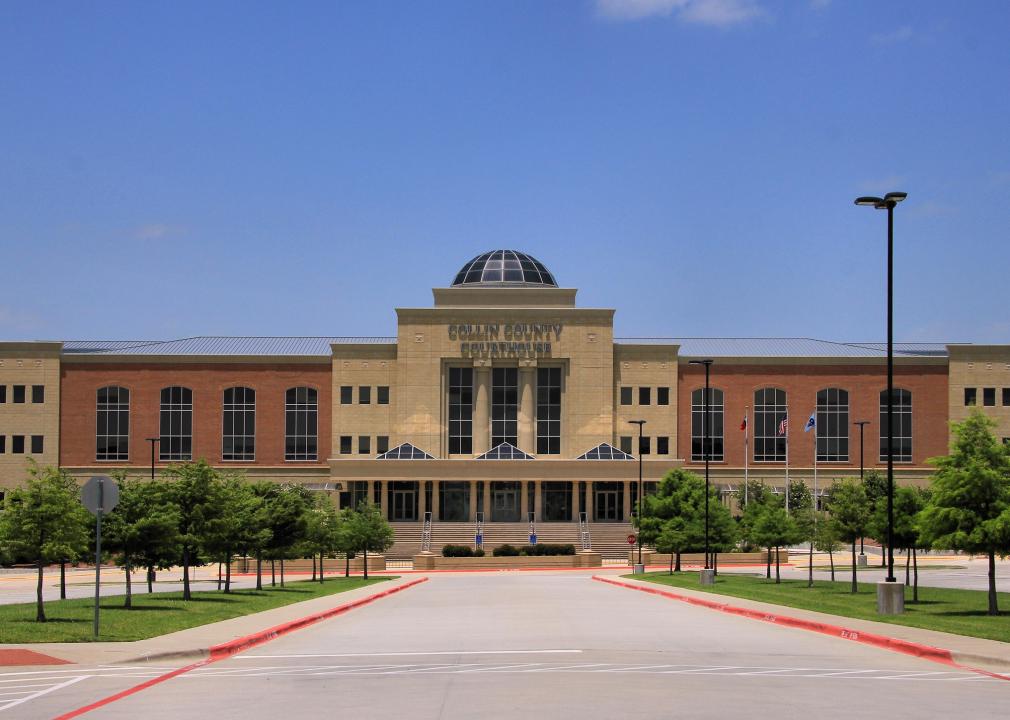
#16. Collin County
– Index: 0.488
– Total population: 973,977
– White: 69.2% (673,508)
– Black or African American: 9.7% (94,720)
– American Indian and Alaska Native: 0.5% (4,560)
– Asian: 15.1% (147,553)
– Native Hawaiian and other Pacific Islander: 0.1% (762)
– 2 or more races: 3.1% (30,107)
– Some other Race: 2.3% (22,767)
You may also like: Fastest-growing counties in Texas
Larry D. Moore // Wikimedia Commons
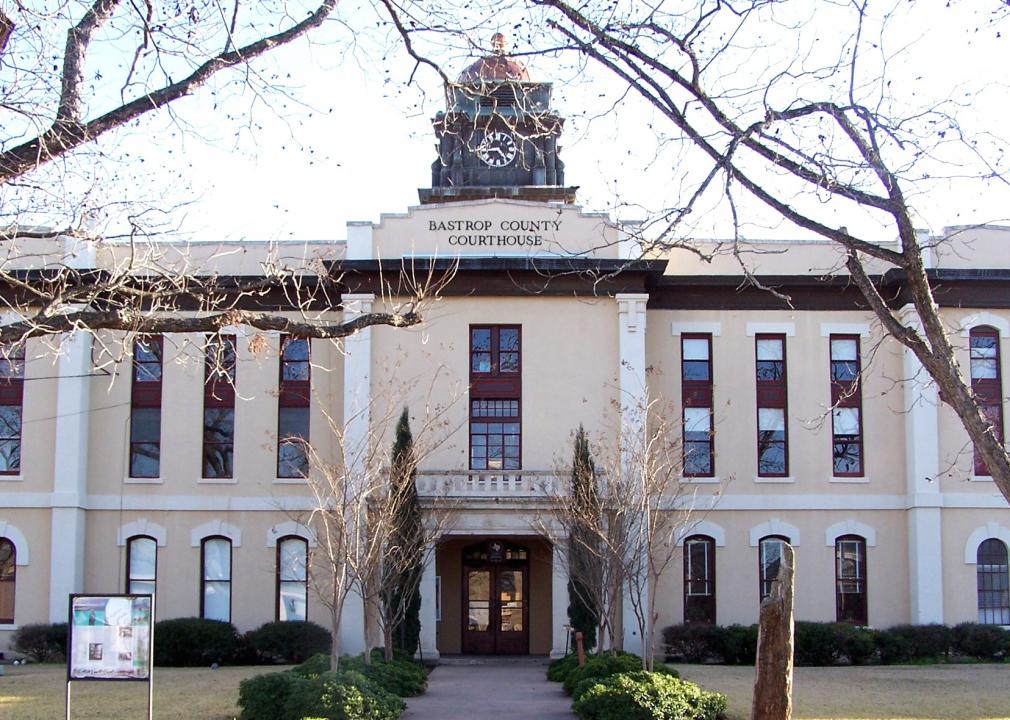
#15. Bastrop County
– Index: 0.489
– Total population: 84,522
– White: 68.0% (57,462)
– Black or African American: 7.5% (6,298)
– American Indian and Alaska Native: 0.5% (398)
– Asian: 0.9% (739)
– Native Hawaiian and other Pacific Islander: 0.0% (0)
– 2 or more races: 2.6% (2,232)
– Some other Race: 20.6% (17,393)
Larry D. Moore // Wikimedia Commons
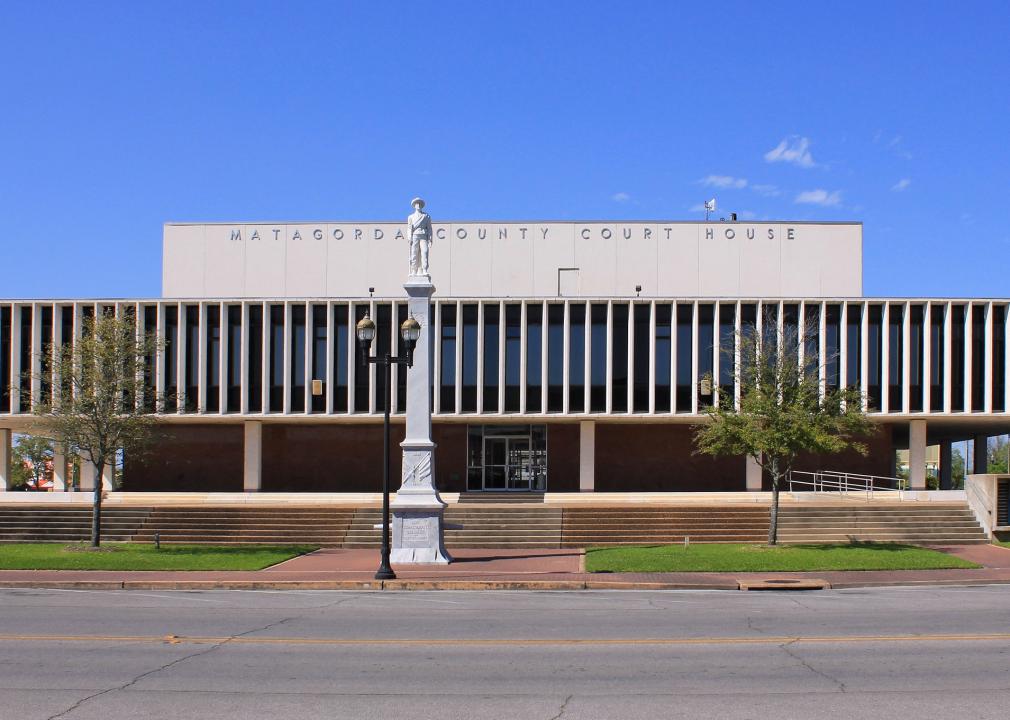
#14. Matagorda County
– Index: 0.493
– Total population: 36,774
– White: 68.4% (25,145)
– Black or African American: 10.4% (3,813)
– American Indian and Alaska Native: 0.4% (141)
– Asian: 1.9% (710)
– Native Hawaiian and other Pacific Islander: 0.3% (120)
– 2 or more races: 1.8% (664)
– Some other Race: 16.8% (6,181)
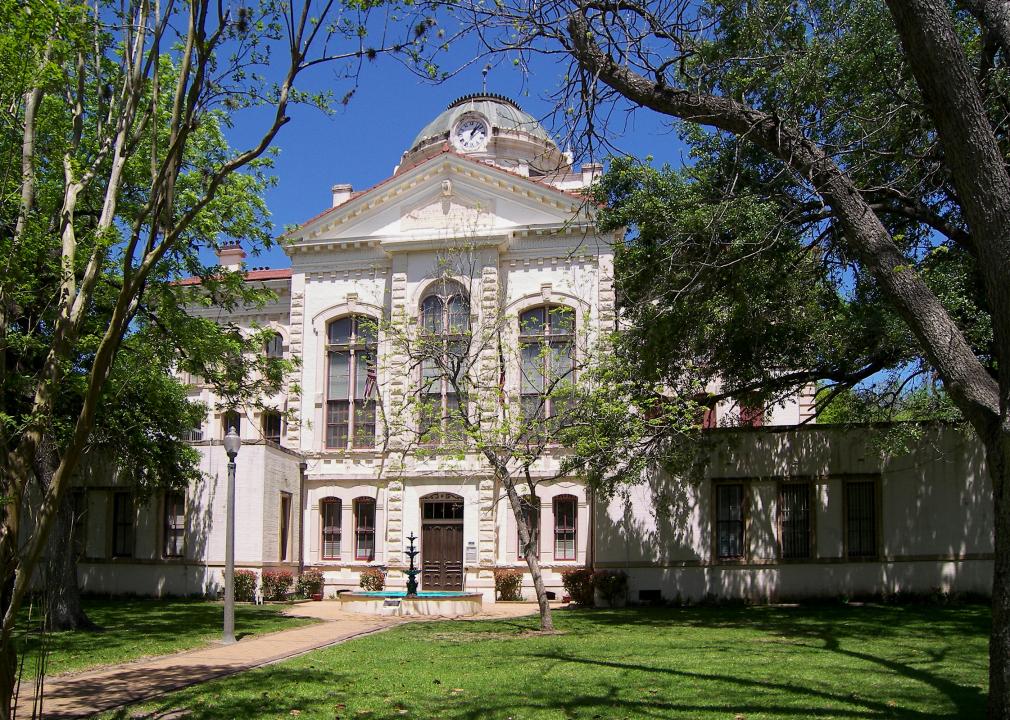
ProfReader // Wikimedia Commons
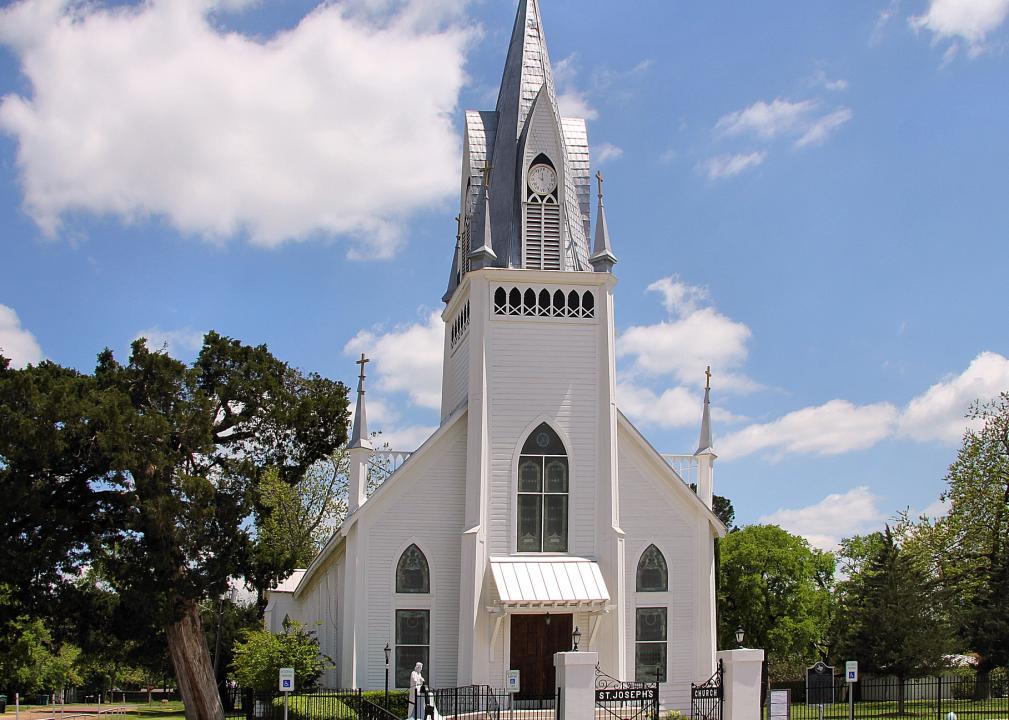
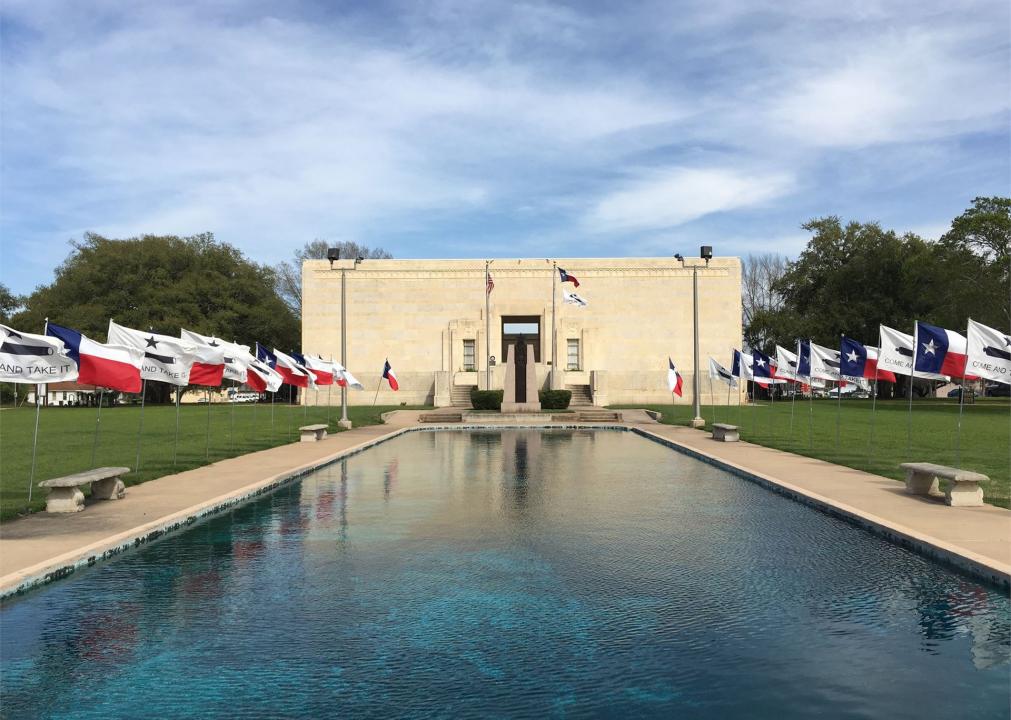
#13. Gonzales County
– Index: 0.493
– Total population: 20,731
– White: 66.5% (13,784)
– Black or African American: 6.7% (1,382)
– American Indian and Alaska Native: 0.3% (64)
– Asian: 0.4% (76)
– Native Hawaiian and other Pacific Islander: 0.0% (5)
– 2 or more races: 1.6% (327)
– Some other Race: 24.6% (5,093)
Aualliso // Wikimedia Commons
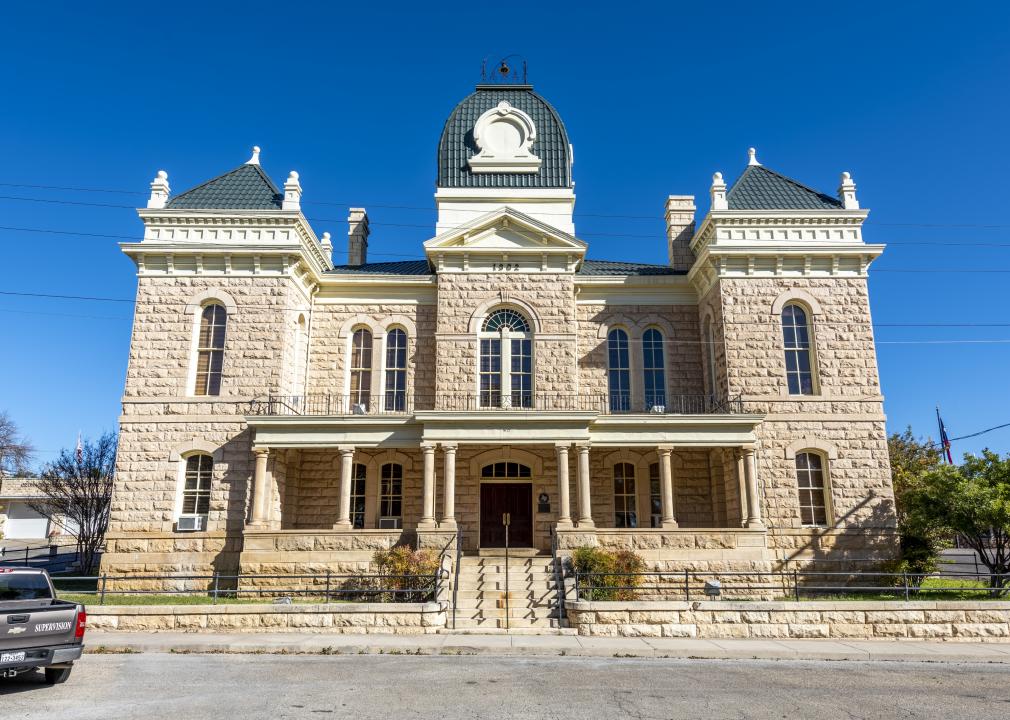
#12. Crockett County
– Index: 0.509
– Total population: 3,484
– White: 42.9% (1,494)
– Black or African American: 0.7% (24)
– American Indian and Alaska Native: 0.0% (0)
– Asian: 0.0% (0)
– Native Hawaiian and other Pacific Islander: 0.0% (0)
– 2 or more races: 1.0% (35)
– Some other Race: 55.4% (1,931)
Mark Fisher // Wikimedia Commons
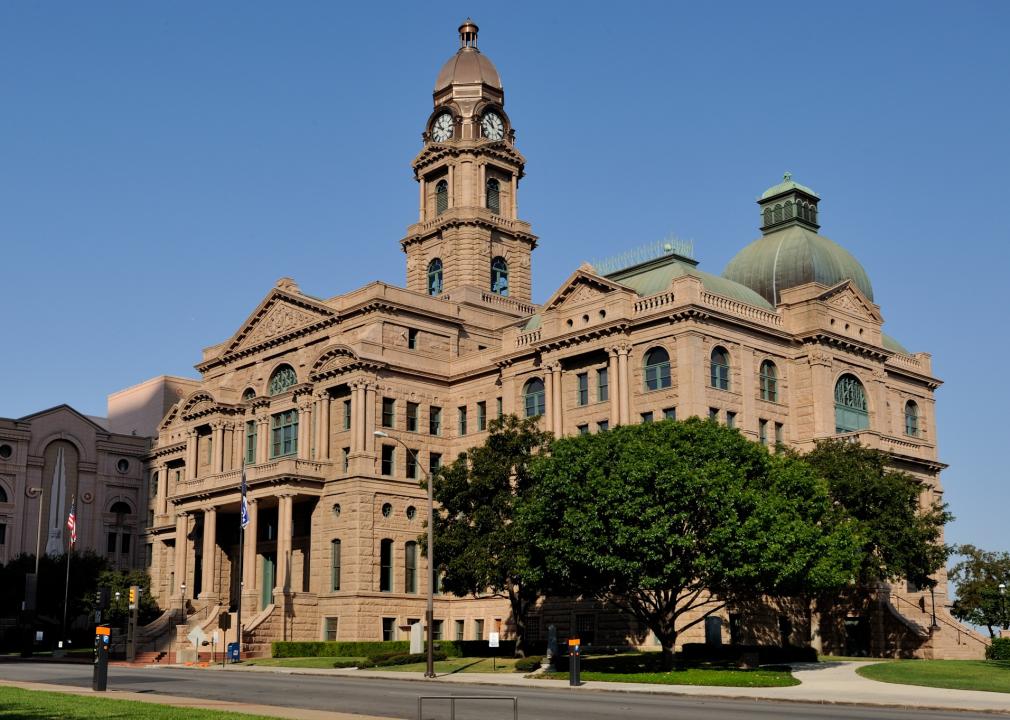
#11. Tarrant County
– Index: 0.514
– Total population: 2.0 million
– White: 67.0% (1,374,182)
– Black or African American: 16.5% (338,378)
– American Indian and Alaska Native: 0.5% (10,343)
– Asian: 5.4% (111,274)
– Native Hawaiian and other Pacific Islander: 0.2% (3,946)
– 2 or more races: 3.2% (65,470)
– Some other Race: 7.1% (146,177)
You may also like: Counties with the most super commuters in Texas
Renelibrary // Wikimedia Commons
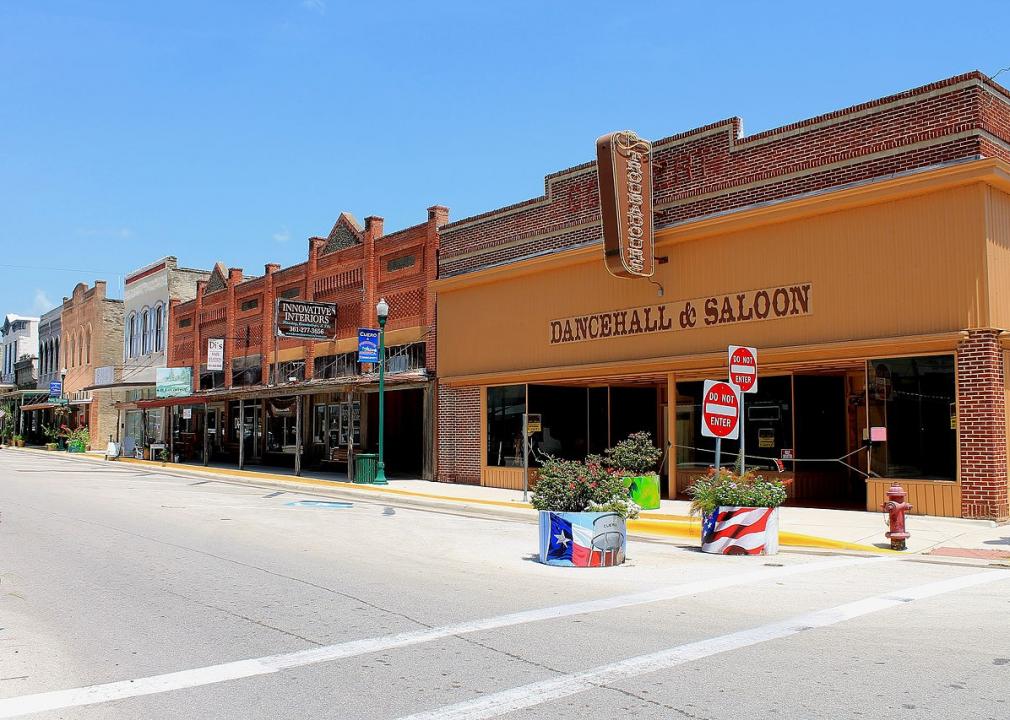
#10. DeWitt County
– Index: 0.517
– Total population: 20,340
– White: 64.7% (13,159)
– Black or African American: 9.3% (1,900)
– American Indian and Alaska Native: 1.2% (242)
– Asian: 0.0% (4)
– Native Hawaiian and other Pacific Islander: 0.0% (0)
– 2 or more races: 1.2% (247)
– Some other Race: 23.5% (4,788)
Aualliso // Wikimedia Commons
#9. Reagan County
– Index: 0.525
– Total population: 3,766
– White: 45.6% (1,719)
– Black or African American: 0.8% (32)
– American Indian and Alaska Native: 0.0% (0)
– Asian: 0.2% (6)
– Native Hawaiian and other Pacific Islander: 0.0% (0)
– 2 or more races: 1.7% (65)
– Some other Race: 51.6% (1,944)
Aualliso // Wikimedia Commons
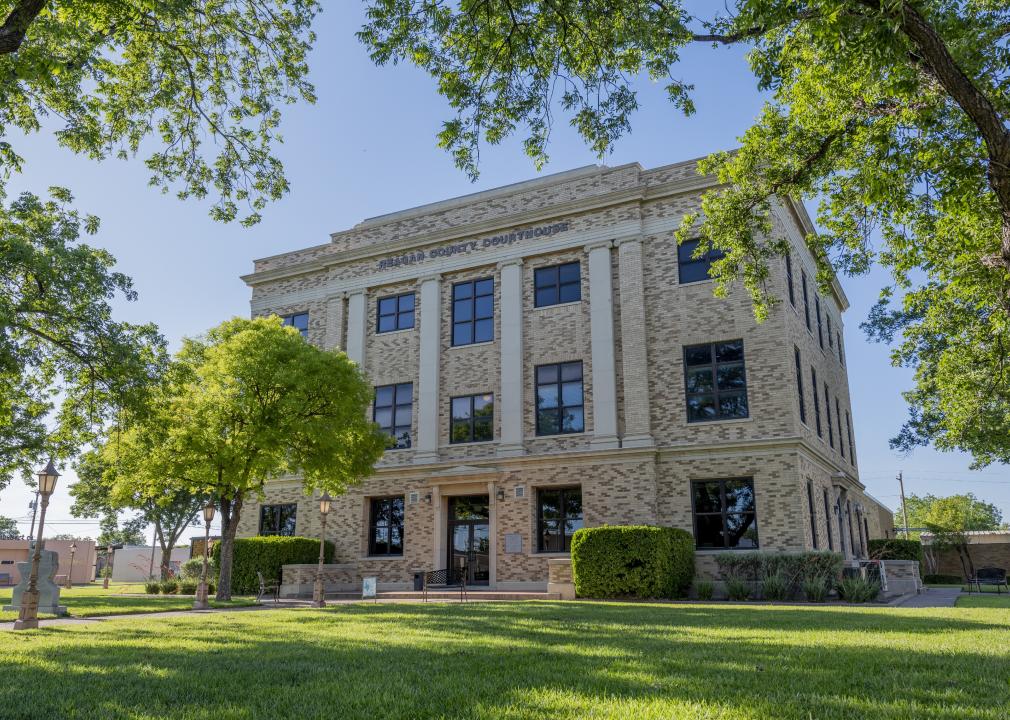
#8. Bell County
– Index: 0.535
– Total population: 348,574
– White: 63.4% (220,872)
– Black or African American: 24.2% (84,435)
– American Indian and Alaska Native: 0.6% (1,969)
– Asian: 2.9% (10,282)
– Native Hawaiian and other Pacific Islander: 0.7% (2,392)
– 2 or more races: 5.4% (18,908)
– Some other Race: 2.8% (9,716)
Aualliso // Wikimedia Commons
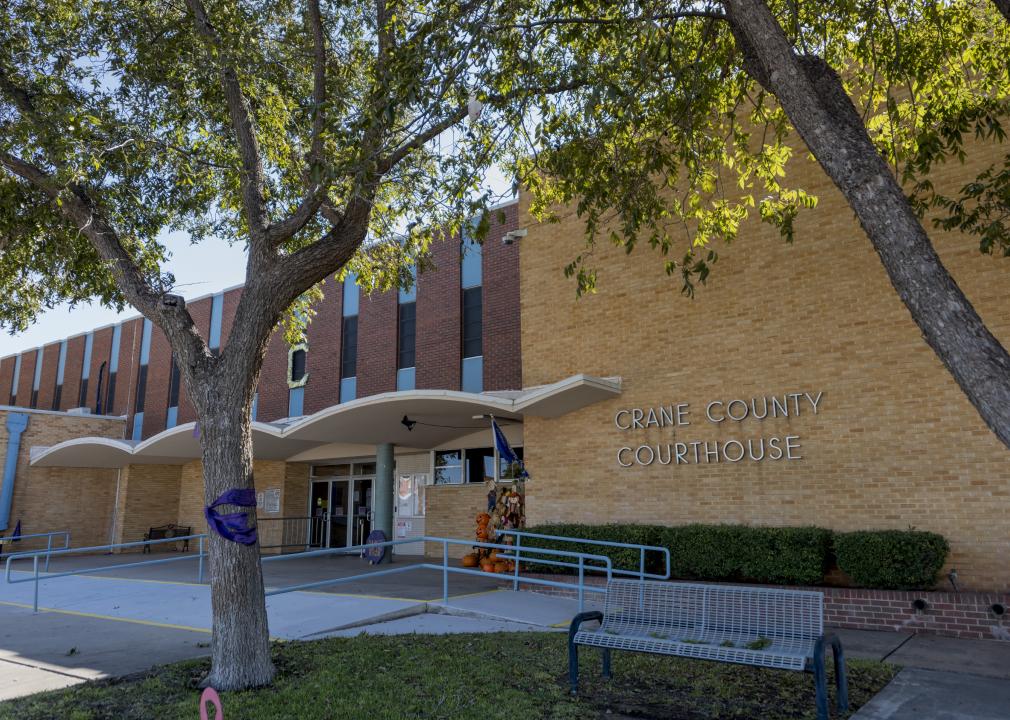
#7. Crane County
– Index: 0.542
– Total population: 4,802
– White: 53.0% (2,543)
– Black or African American: 2.7% (129)
– American Indian and Alaska Native: 0.3% (15)
– Asian: 2.0% (95)
– Native Hawaiian and other Pacific Islander: 0.0% (0)
– 2 or more races: 0.0% (0)
– Some other Race: 42.1% (2,020)
Public Domain
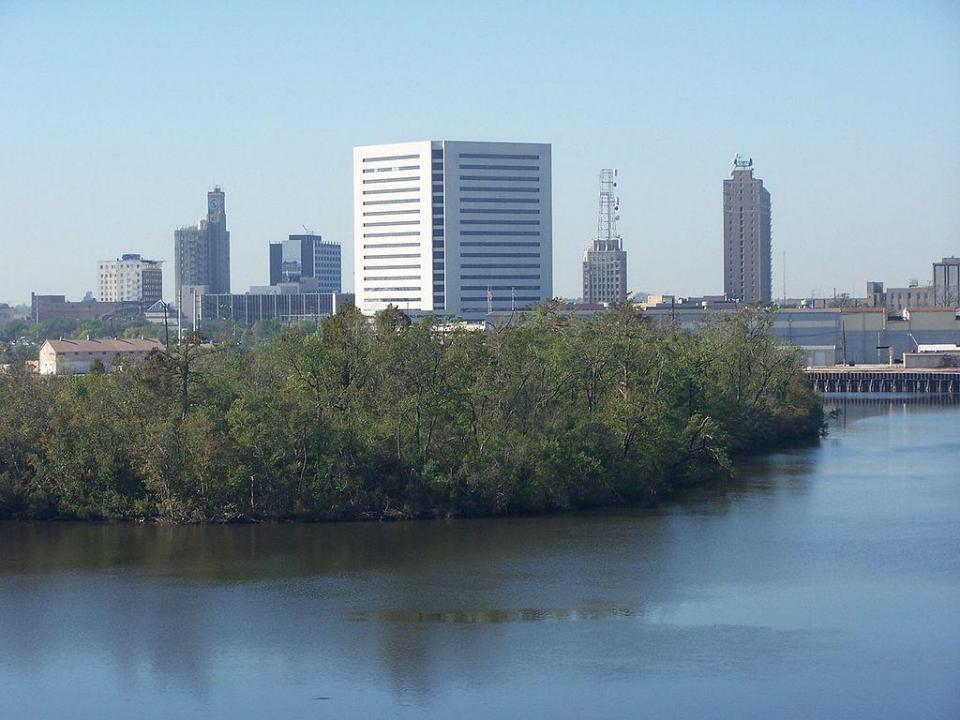
#6. Jefferson County
– Index: 0.544
– Total population: 254,340
– White: 58.3% (148,331)
– Black or African American: 33.7% (85,682)
– American Indian and Alaska Native: 0.4% (961)
– Asian: 3.8% (9,565)
– Native Hawaiian and other Pacific Islander: 0.1% (130)
– 2 or more races: 1.7% (4,308)
– Some other Race: 2.1% (5,363)
You may also like: Where people in Texas are moving to most

Hequals2henry // Wikimedia Commons
#5. Harris County
– Index: 0.560
– Total population: 4.6 million
– White: 62.5% (2,905,947)
– Black or African American: 19.0% (884,292)
– American Indian and Alaska Native: 0.4% (19,269)
– Asian: 7.0% (324,288)
– Native Hawaiian and other Pacific Islander: 0.1% (3,104)
– 2 or more races: 2.4% (112,953)
– Some other Race: 8.5% (396,777)
Alan Botting // Wikimedia Commons
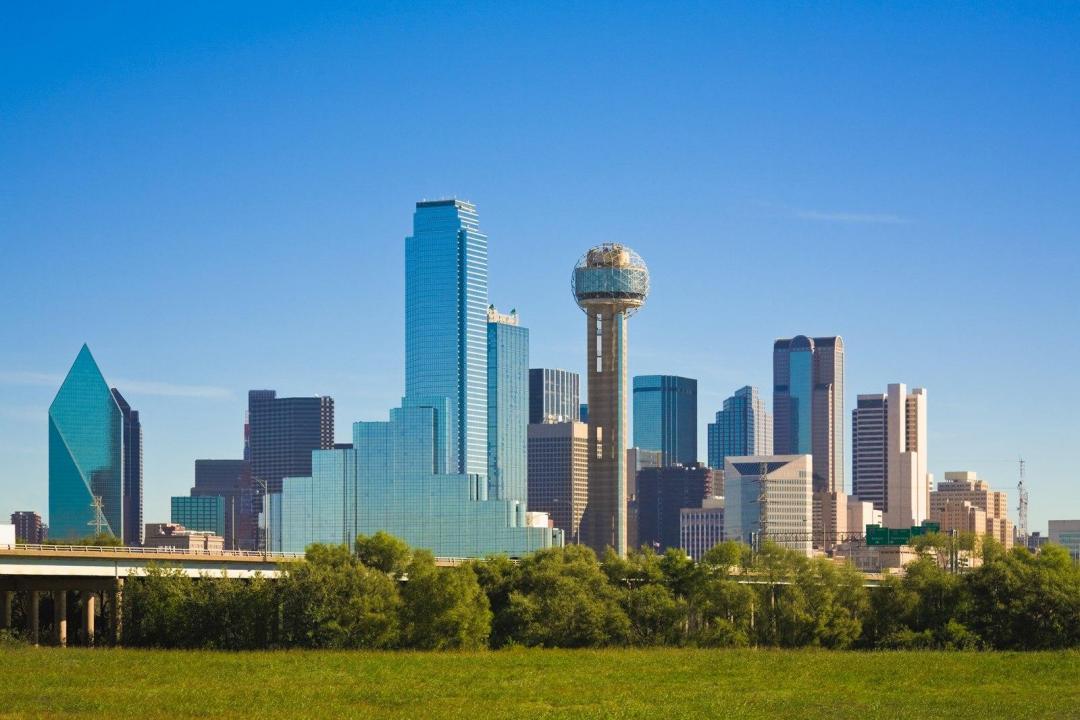
#4. Dallas County
– Index: 0.564
– Total population: 2.6 million
– White: 61.3% (1,597,069)
– Black or African American: 22.6% (588,903)
– American Indian and Alaska Native: 0.4% (10,155)
– Asian: 6.3% (163,971)
– Native Hawaiian and other Pacific Islander: 0.0% (1,240)
– 2 or more races: 2.6% (68,853)
– Some other Race: 6.8% (176,677)
Larry D. Moore // Wikimedia Commons
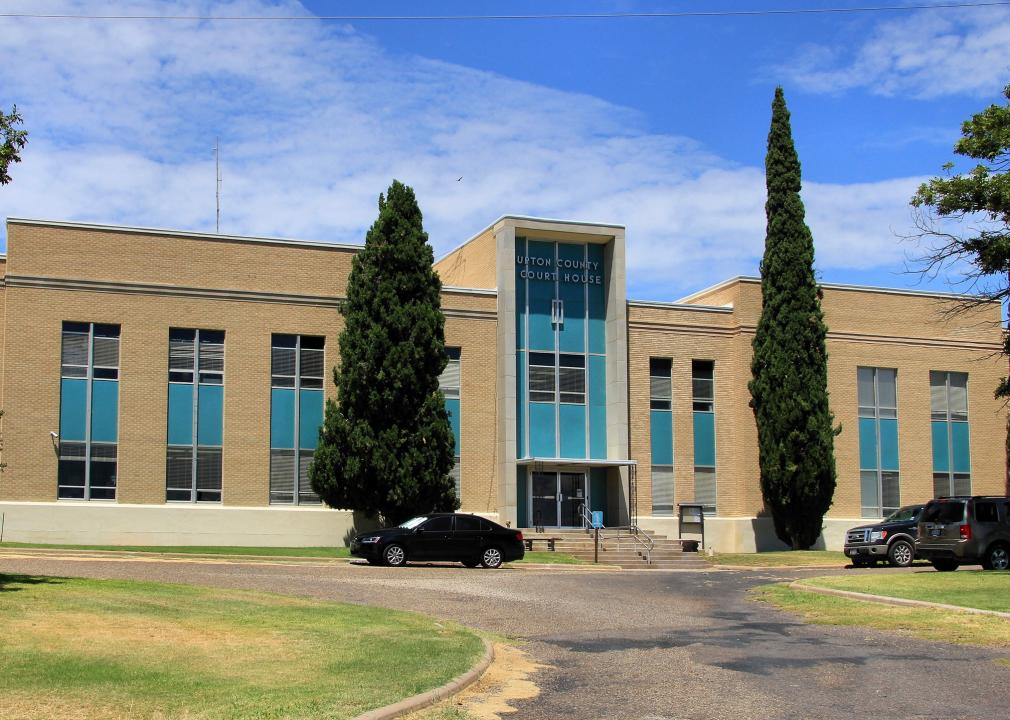
#3. Upton County
– Index: 0.567
– Total population: 3,659
– White: 45.0% (1,648)
– Black or African American: 6.0% (220)
– American Indian and Alaska Native: 0.6% (21)
– Asian: 0.7% (26)
– Native Hawaiian and other Pacific Islander: 0.0% (0)
– 2 or more races: 0.1% (3)
– Some other Race: 47.6% (1,741)

Larry D. Moore // Wikimedia Commons
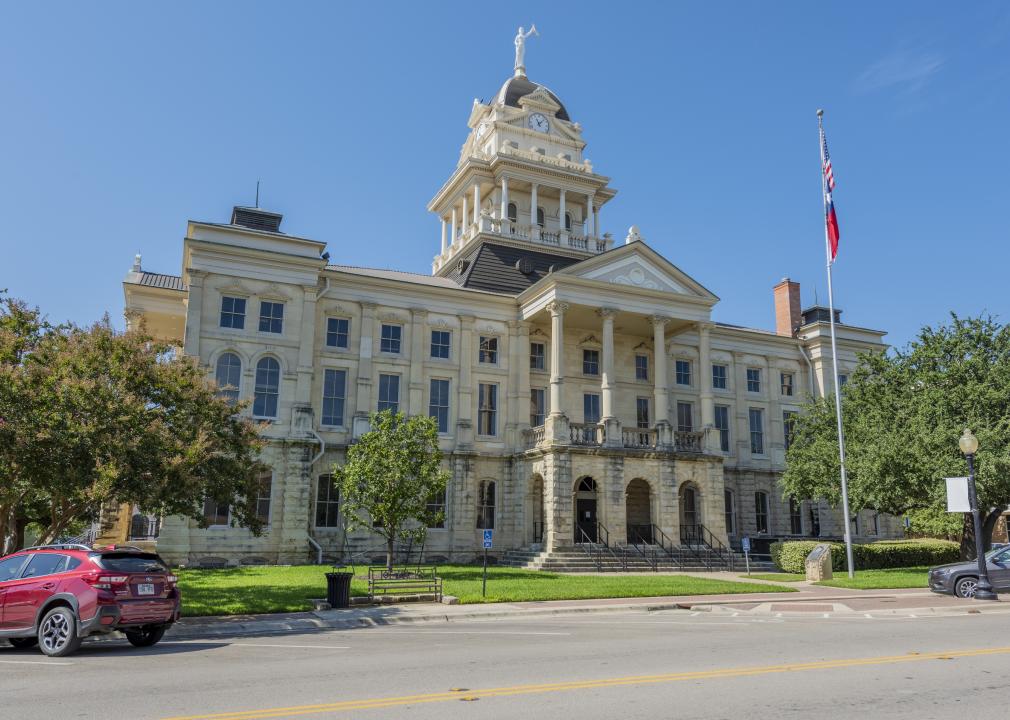
#2. Waller County
– Index: 0.582
– Total population: 51,832
– White: 58.1% (30,096)
– Black or African American: 24.9% (12,911)
– American Indian and Alaska Native: 0.9% (449)
– Asian: 1.0% (530)
– Native Hawaiian and other Pacific Islander: 0.0% (25)
– 2 or more races: 1.6% (805)
– Some other Race: 13.5% (7,016)
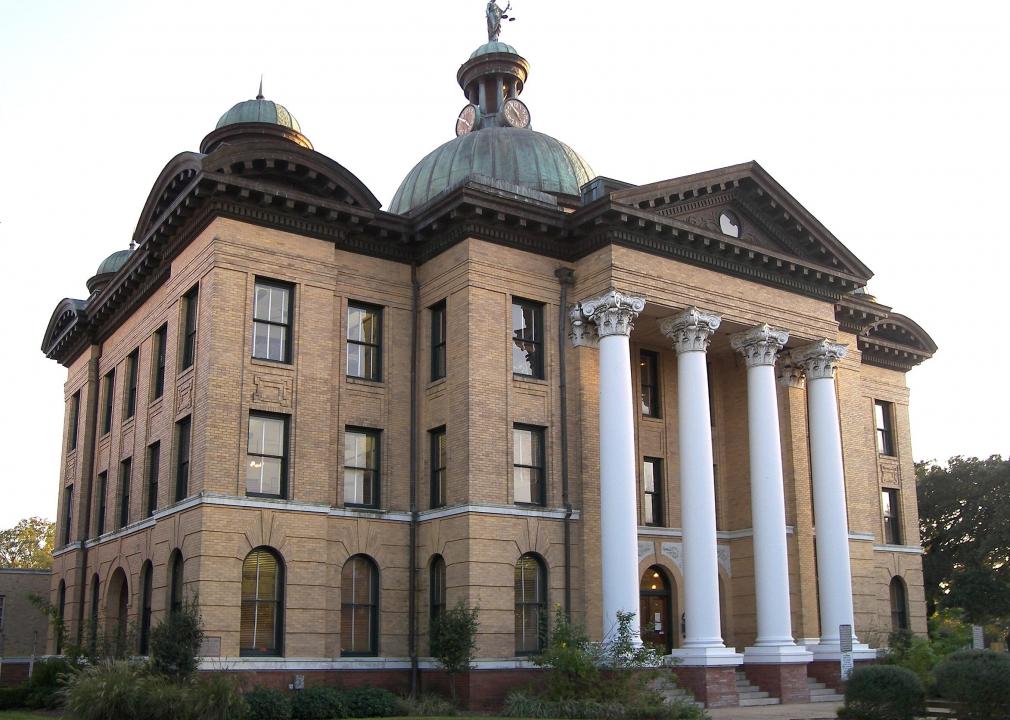
Larry D. Moore // Wikimedia Commons
#1. Fort Bend County
– Index: 0.647
– Total population: 765,394
– White: 51.7% (395,904)
– Black or African American: 20.5% (157,134)
– American Indian and Alaska Native: 0.3% (2,600)
– Asian: 20.2% (154,513)
– Native Hawaiian and other Pacific Islander: 0.1% (408)
– 2 or more races: 2.8% (21,620)
– Some other Race: 4.3% (33,215)
You may also like: Do you know Texas’s official state symbols?