Cities with the worst commutes in Texas
Canetti // Shutterstock
Cities with the worst commutes in Texas
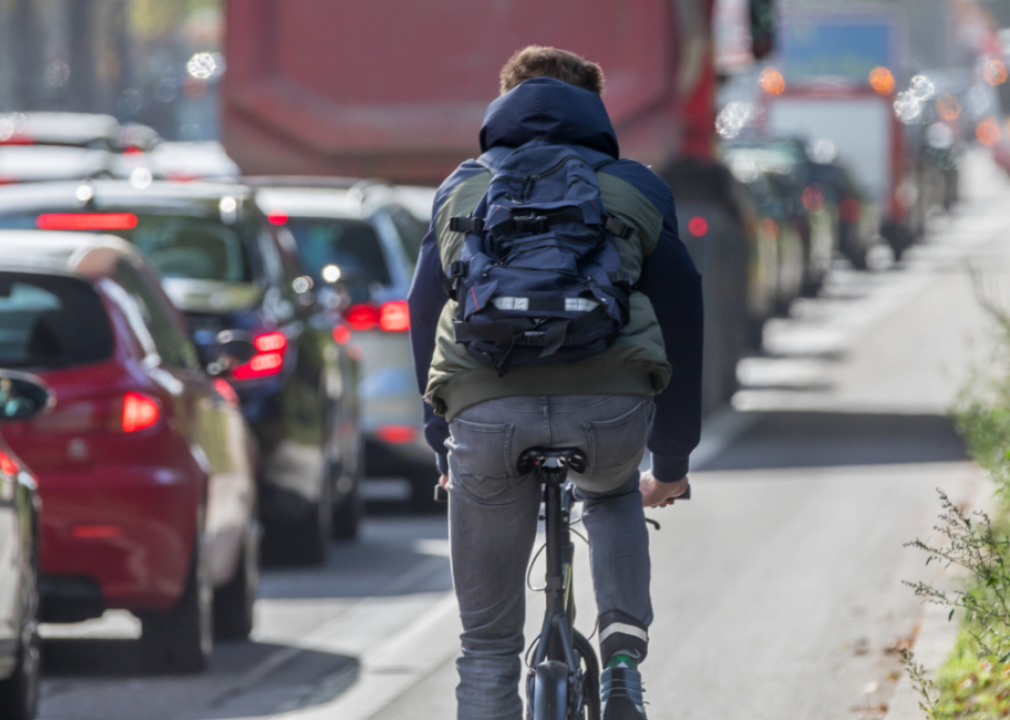
When the COVID-19 pandemic made millions of Americans remote workers, it also abruptly ended the commutes that bookend the workday. As some of those workers return to the office, conversations around the drawbacks of commutes have become more vocal. For a while, those workers enjoyed more time in the morning and evening that wasn’t spent simply traveling to and from work—an unpaid portion of the day that nevertheless eats up time and energy. And it’s not a small amount of time, either: Pre-pandemic, the average commute in the U.S. was a hair over 27 minutes one way, according to U.S. Census Bureau data. It was a record high. Cumulatively, 27 minutes each way translates to 54 minutes a day, or four-and-a-half hours per week. That’s 18 hours a month and 216 hours a year spent commuting.
Those who commute know it’s anything but idyllic. While a very small portion of workers live in the ideal scenario—a short, walkable distance from the office, along a sidewalk that is presumably regularly shoveled in the winter and where the temperature doesn’t result in a sweaty arrival in the summer—most endure clogged roads, unpredictable public transit, and the frustrations that come with. Of course, not all commutes are as bad as others, and some cities have better public transit and traffic flow. Stacker compiled a list of the cities with the worst commutes in Texas using data from the U.S. Census Bureau. Cities with at least 5,000 working adults are ranked by the longest average commute time as of the 2019 5-year estimate.
#20. Pearland
– Average time spent commuting to work (minutes): 33.6
— Percent of workers spending less than 30 minutes commuting: 38.2%
— Percent of workers spending more than an hour commuting: 12.7%
#19. Glenn Heights
– Average time spent commuting to work (minutes): 33.7
— Percent of workers spending less than 30 minutes commuting: 42.4%
— Percent of workers spending more than an hour commuting: 19.6%
#18. Wylie
– Average time spent commuting to work (minutes): 34
— Percent of workers spending less than 30 minutes commuting: 39.3%
— Percent of workers spending more than an hour commuting: 13.9%
#17. Anna
– Average time spent commuting to work (minutes): 34.2
— Percent of workers spending less than 30 minutes commuting: 32.8%
— Percent of workers spending more than an hour commuting: 15.8%
#16. Atascocita
– Average time spent commuting to work (minutes): 34.5
— Percent of workers spending less than 30 minutes commuting: 40.4%
— Percent of workers spending more than an hour commuting: 14.9%
#15. Celina
– Average time spent commuting to work (minutes): 34.5
— Percent of workers spending less than 30 minutes commuting: 37.3%
— Percent of workers spending more than an hour commuting: 17.7%
#14. Fate
– Average time spent commuting to work (minutes): 34.5
— Percent of workers spending less than 30 minutes commuting: 35.4%
— Percent of workers spending more than an hour commuting: 19%
#13. Prosper
– Average time spent commuting to work (minutes): 34.9
— Percent of workers spending less than 30 minutes commuting: 43.4%
— Percent of workers spending more than an hour commuting: 15%
#12. Buda
– Average time spent commuting to work (minutes): 35
— Percent of workers spending less than 30 minutes commuting: 42.3%
— Percent of workers spending more than an hour commuting: 15.1%
#11. Balch Springs
– Average time spent commuting to work (minutes): 35.5
— Percent of workers spending less than 30 minutes commuting: 41.2%
— Percent of workers spending more than an hour commuting: 20.8%
#10. Kyle
– Average time spent commuting to work (minutes): 36
— Percent of workers spending less than 30 minutes commuting: 42.6%
— Percent of workers spending more than an hour commuting: 18.7%
#9. Red Oak
– Average time spent commuting to work (minutes): 36.3
— Percent of workers spending less than 30 minutes commuting: 45.9%
— Percent of workers spending more than an hour commuting: 15.1%
#8. Seagoville
– Average time spent commuting to work (minutes): 36.3
— Percent of workers spending less than 30 minutes commuting: 38.5%
— Percent of workers spending more than an hour commuting: 19.4%
#7. Royse City
– Average time spent commuting to work (minutes): 36.3
— Percent of workers spending less than 30 minutes commuting: 42%
— Percent of workers spending more than an hour commuting: 27.8%
#6. Little Elm
– Average time spent commuting to work (minutes): 36.4
— Percent of workers spending less than 30 minutes commuting: 37.5%
— Percent of workers spending more than an hour commuting: 15.1%
#5. Pecan Grove
– Average time spent commuting to work (minutes): 37.1
— Percent of workers spending less than 30 minutes commuting: 40.2%
— Percent of workers spending more than an hour commuting: 18.6%
#4. Fresno
– Average time spent commuting to work (minutes): 37.4
— Percent of workers spending less than 30 minutes commuting: 31.7%
— Percent of workers spending more than an hour commuting: 16%
#3. Forney
– Average time spent commuting to work (minutes): 38
— Percent of workers spending less than 30 minutes commuting: 34.8%
— Percent of workers spending more than an hour commuting: 19.1%
#2. Canyon Lake
– Average time spent commuting to work (minutes): 40.3
— Percent of workers spending less than 30 minutes commuting: 38.6%
— Percent of workers spending more than an hour commuting: 21.5%
#1. Sienna Plantation
– Average time spent commuting to work (minutes): 40.8
— Percent of workers spending less than 30 minutes commuting: 26.2%
— Percent of workers spending more than an hour commuting: 26.1%
![]()