How office vacancy rates have changed in the 10 most congested metros
Justin Sullivan // Getty Images
How office vacancy rates have changed in the 10 most congested metros
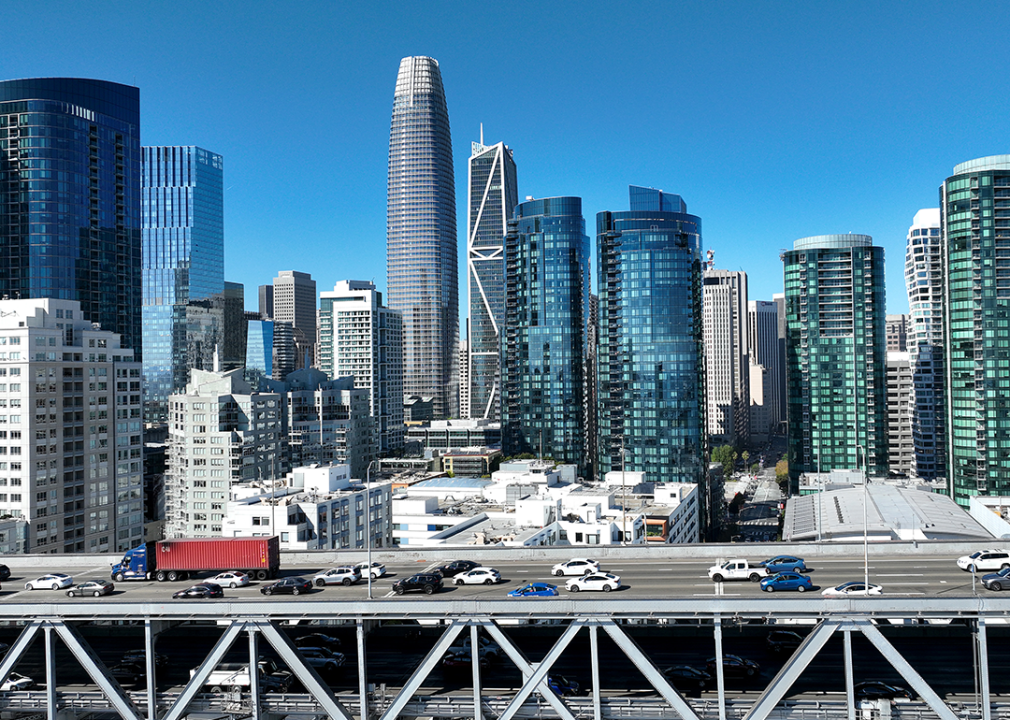
Cars drive the San Francisco skyline along Interstate 80.
Downtowns across America were hollowed out due to the COVID-19 pandemic’s reduction of in-person work in 2020. Three years later, many offices remain empty or sparsely occupied as workers and employers opt for more flexible workweeks.
The shift to hybrid work schedules that has played out in the years since began with health concerns, but it continued thanks to a surge in new technology over the pandemic, making remote work easier. Rising costs for housing near jobs and gas to commute also made remote work more attractive.
Firmspace used CoStar and National Association of Realtors commercial real estate data as well as INRIX traffic data to illustrate the relationship between office vacancies and traffic as hybrid work has become more common in the U.S. All vacancy rates are as of the fourth quarter of their corresponding year; cities are ranked in reverse order based on those with the most hours lost to traffic.
Hybrid work schedules are feasible for most workers in the U.S.; have shown an ability to reduce turnover by more than 30%; and allow workers to reinvest the time otherwise spent commuting to raising families, recreation, or secondary jobs. The average worker who could perform their job remotely saved more than an hour a day, a National Bureau of Economic Research paper found.
Office vacancy rates rose about 3% nationwide on average from 2019 to 2022, according to commercial real estate data from CoStar and the NAR. Vacancies were lower in less populous suburbs through the end of 2022, while buildings in major metros tended to have more empty offices.
Traffic data suggests offices in cities with the most traffic have struggled to fill office towers. The average worker in one of the most congested cities, measured by INRIX, lost about 105 hours to traffic in 2022.
This year, even companies with growing revenues are deciding to shrink their physical footprints. Dallas–Fort Worth-based banking software provider Alkami is among the most recent to jettison its extra tower space. In some downtowns, vacancies have begotten more, with one San Francisco community leader describing empty buildings as having an effect “like a virus” that kills business opportunities for others.
![]()
Firmspace
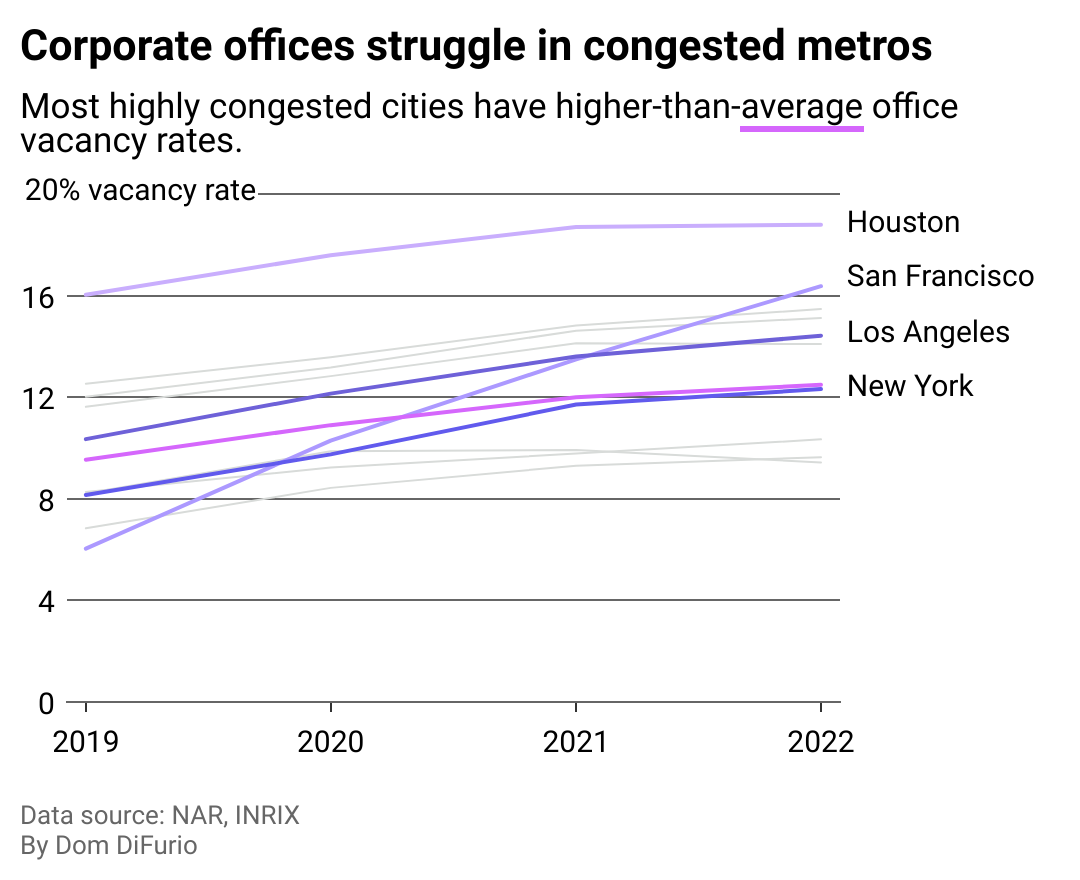
Cities with the most traffic congestion may face office space reckoning
A line chart showing the vacancy rate of offices in each of the top 10 metros for traffic as of 2022. San Francisco, Los Angeles, and New York all experienced the most growth in vacancies since 2019.
The majority of the most congested cities have also seen above-average office vacancy rates. In sprawling Houston, vacancy rates have remained elevated above all other top cities for traffic congestion. Among that group, San Francisco, Los Angeles, and New York all saw office vacancies rise the most in relation to their pre-pandemic rates.
Keep reading to see if your city ranks among the 10 most congested and how its office culture has fared since 2019.
Canva
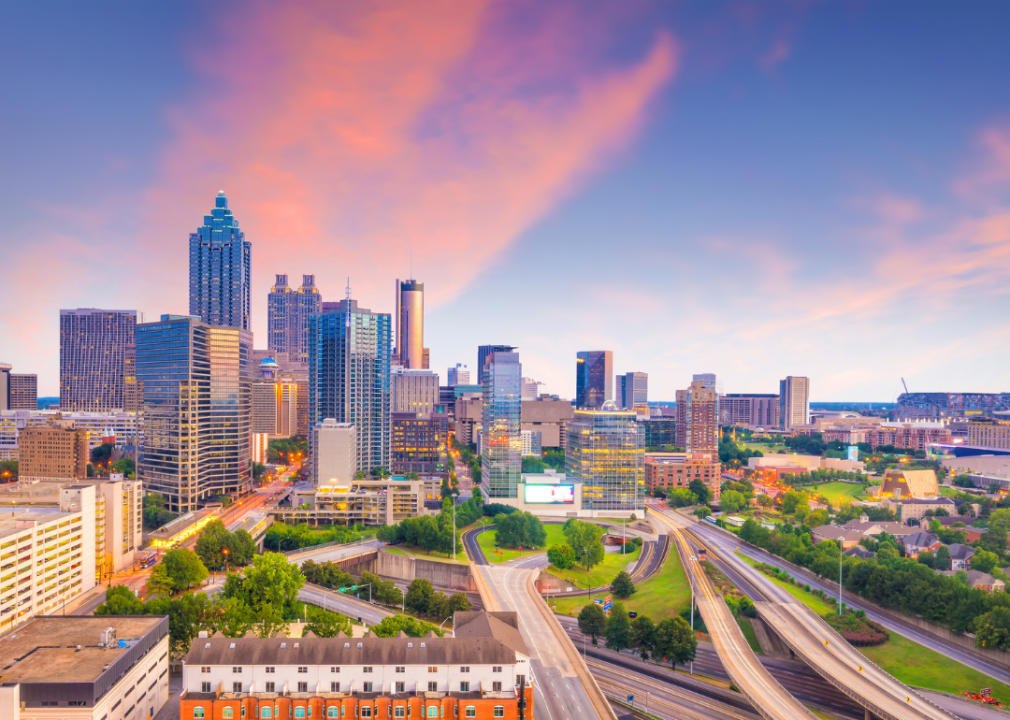
Atlanta
Aerial view of Atlanta skyline.
Office vacancy rate in 2022: 14.09%
Vacancy change since pre-pandemic: +2.47%
Hours lost to traffic: 74
Sean Pavone // Shutterstock
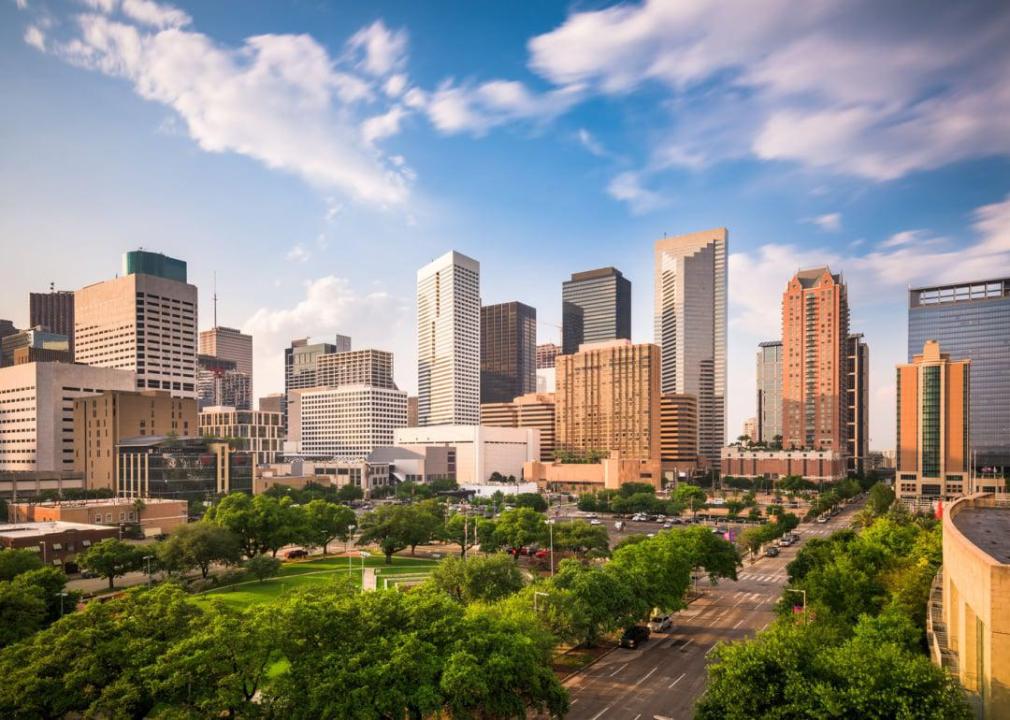
Houston
Houston downtown park and skyline.
Office vacancy rate in 2022: 18.79%
Vacancy change since pre-pandemic: +2.76%
Hours lost to traffic: 74
Orhan Cam // Shutterstock
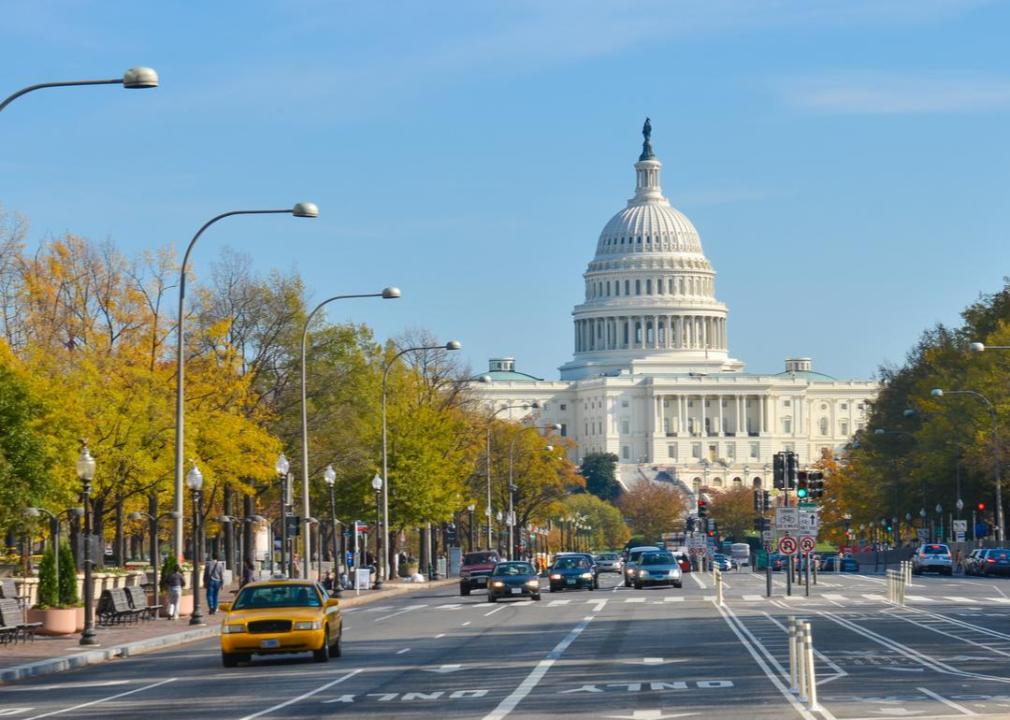
Washington DC
Pennsylvania Avenue and US Capitol.
Office vacancy rate in 2022: 15.47%
Vacancy change since pre-pandemic: +2.93%
Hours lost to traffic: 83
Canva
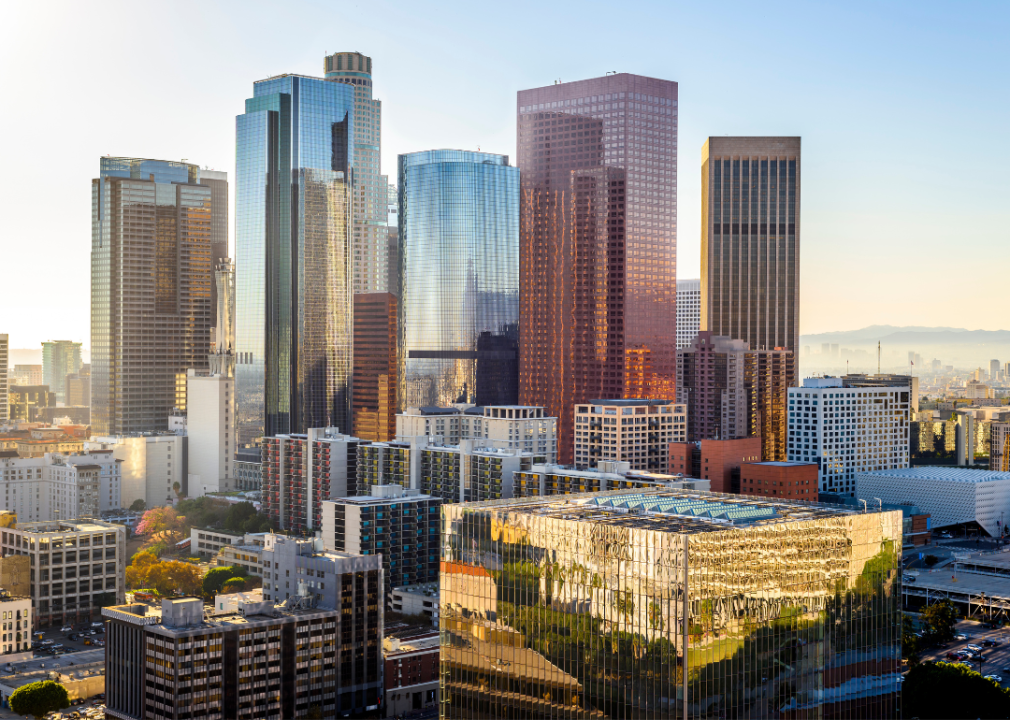
Los Angeles
Aerial view of downtown Los Angeles.
Office vacancy rate in 2022: 14.42%
Vacancy change since pre-pandemic: +4.07%
Hours lost to traffic: 95
TierneyMJ // Shutterstock
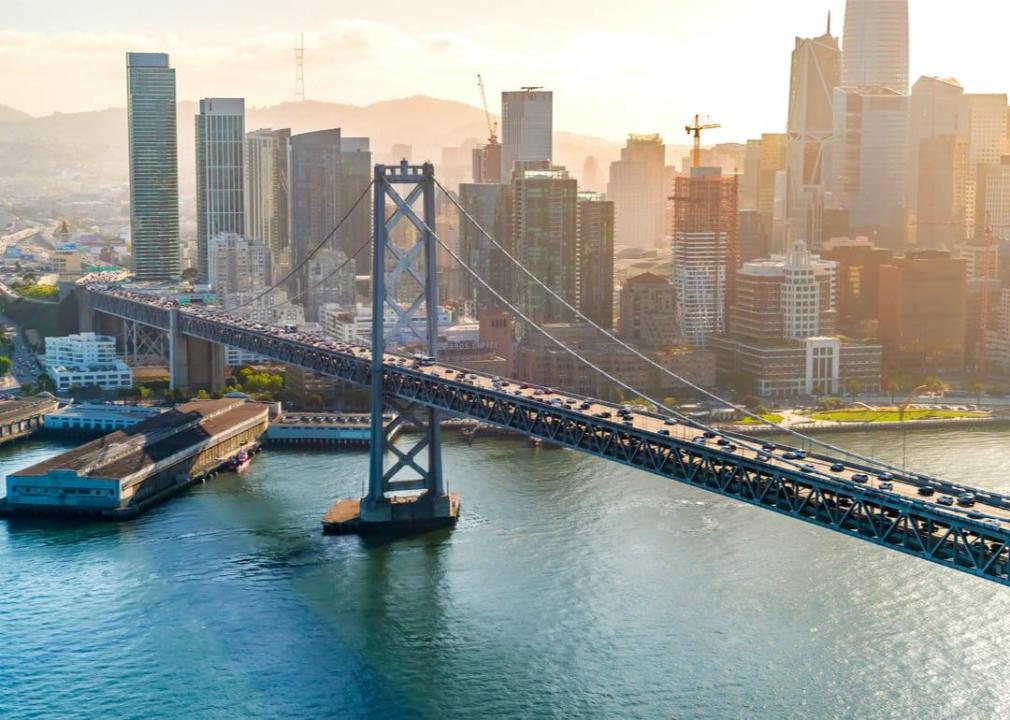
San Francisco
Aerial view of the Bay Bridge in San Francisco.
Office vacancy rate in 2022: 16.37%
Vacancy change since pre-pandemic: +10.33%
Hours lost to traffic: 97
Sean Pavone // Shutterstock
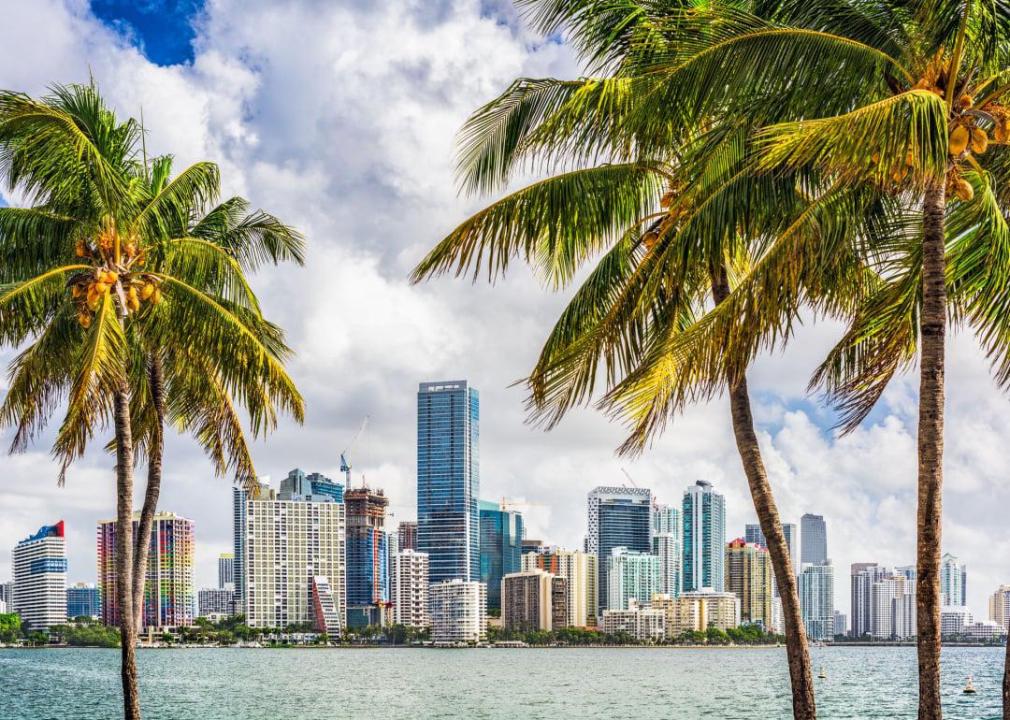
Miami
Skyline of Miami with palm trees.
Office vacancy rate in 2022: 9.43%
Vacancy change since pre-pandemic: +1.22%
Hours lost to traffic: 105
f11photo // Shutterstock
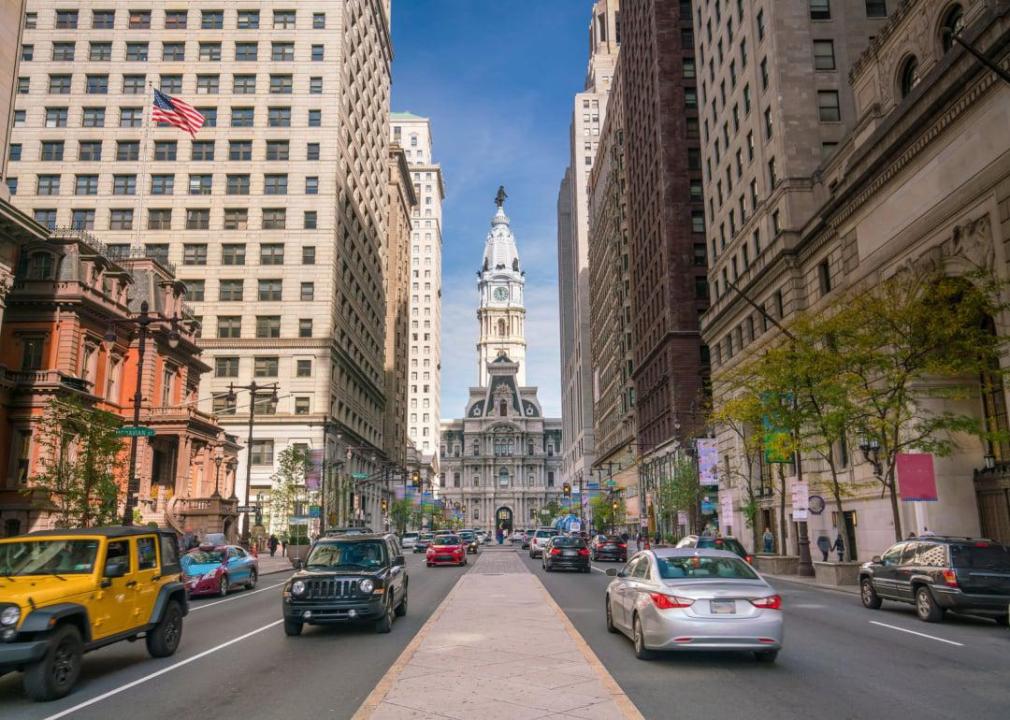
Philadelphia
Street view of downtown Philadelphia.
Office vacancy rate in 2022: 10.34%
Vacancy change since pre-pandemic: +2.06%
Hours lost to traffic: 114
Thiago Leite // Shutterstock
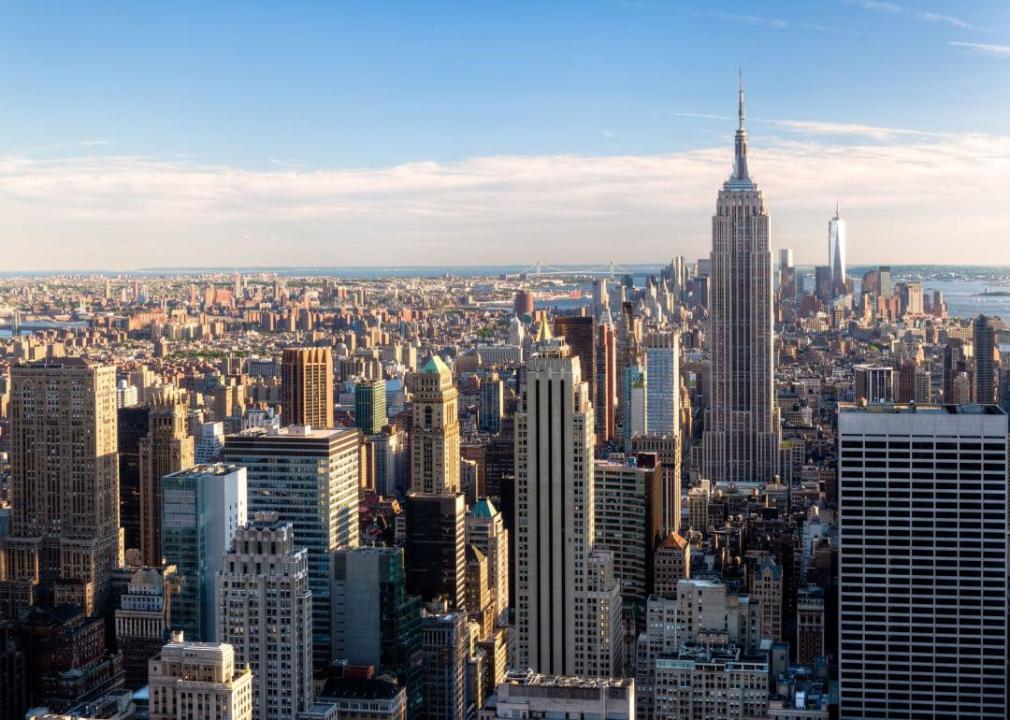
New York
Elevated view of New York City skyline.
Office vacancy rate in 2022:
Vacancy change since pre-pandemic: +4.17%
Hours lost to traffic: 117
lunamarina // Shutterstock
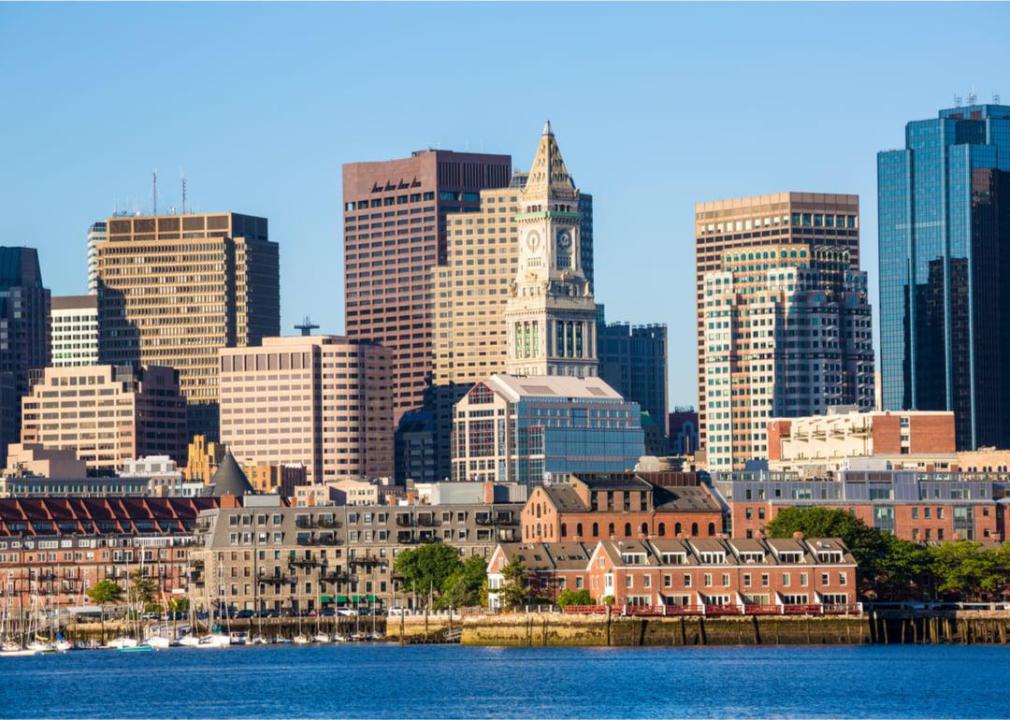
Boston
Boston skyline with river.
Office vacancy rate in 2022: 9.64%
Vacancy change since pre-pandemic: +2.80%
Hours lost to traffic: 134
This story originally appeared on Firmspace and was produced and
distributed in partnership with Stacker Studio.
