See how El Paso ranks in commuting
Canva
See how El Paso ranks in commuting
When people say, “It’s not about the destination, it’s about the journey,” they probably aren’t talking about commuting. But, believe it or not, some commutes are worth savoring. In fact, some cities have made commuting downright enjoyable — or at least relatively painless.
What makes for a great commute? Lyft surveyed over 1,400 commuters to see what they value most. A full 25% said that time was the most important factor, 19% called out consistency, and 13% pointed to cost.
We then analyzed data across millions of Lyft rides, supplemented by public data sources, to see where travelers enjoyed the shortest, cheapest, and greenest commutes, as well as the most vibrant downtowns to reward their travels. (To compare big apples to big apples, we limited the data set to El Paso and 34 other cities in the U.S. with populations over 500,000.) Then we combined those scores to give each city a final, overall score. See our methodology section for more details. Read on to see where El Paso ranks for the best overall commute.
![]()

Canva
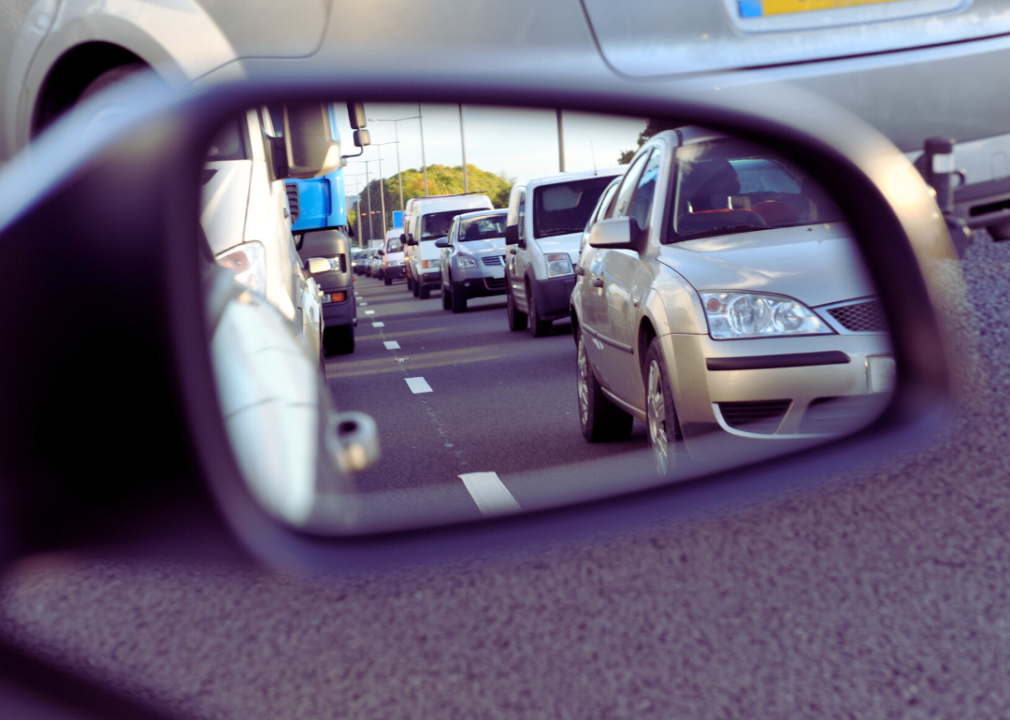
Quickest commutes
In a country where the typical employee spends more than a quarter of their day working, maximizing free time — and minimizing commute time — matters.
Shortest commute time: On average, commuters spend about 25 minutes getting to/from work. But some cities, notably Columbus, Memphis, and Milwaukee have some of the fastest commutes, at around 22 minutes. Over the course of a year, this difference adds up to 13 hours.
Fastest commutes: But not all minutes are created equal. Ten minutes spent cruising on a highway is less painful than ten minutes spent bumper-to-bumper. According to Lyft’s data, commuters in Fort Worth, Memphis, and Detroit average over 27 mph, 4 mph faster than the average.
Least-congested commutes: The most notorious commutes aren’t just slow — they are much slower than non-commute travel along the same route. As Eric Bourassa, director of transportation at Boston’s Metropolitan Area Planning Council (MAPC) puts it: “On a Saturday night, it might take you 20 minutes to get home, but on a Friday afternoon, it might take you six times as long. People feel that.” Only two cities do not experience slower travel during commuting hours, according to Lyft data: Columbus (1.3% faster) and Las Vegas (6.3% faster). Overall, cities experience 8% slower travel, on average.
El Paso commuting time stats
– Commuting time score: 95.1
— 5th of the 35 cities ranked
– Average commute time: 24.4 minutes
– Average traffic speed: 27.0 mph
Cities with the quickest commutes
#1. Columbus, OH: 100.0 quickest commute score
#2. Las Vegas, NV: 99.9
#3. Memphis, TN: 99.8
#4. Fresno, CA: 97.6
#5. El Paso, TX: 95.1
#6. Detroit, MI: 95.0
#7. San Diego, CA: 93.8
#8. Milwaukee, WI: 90.8
#9. Tucson, AZ: 89.7
#10. Jacksonville, FL: 89.3
Canva
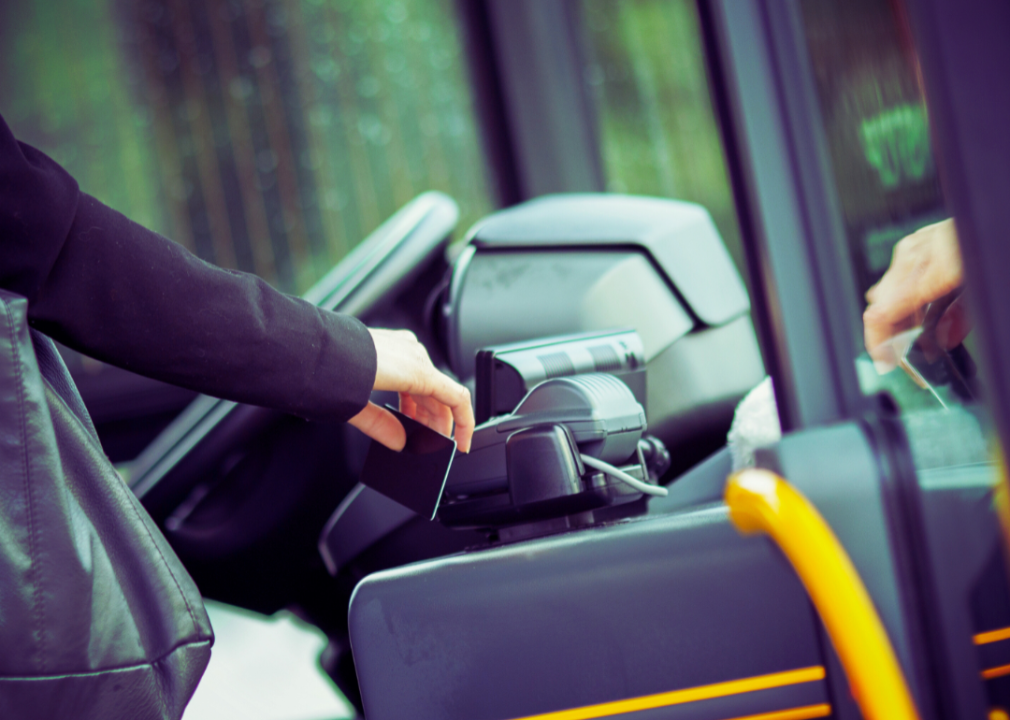
Cheapest commutes
Commutes don’t just cost time, they cost money: Tolls and parking can be significant expenses for the 68.7% of Americans who commute to work alone in a vehicle each day. And for the small share of Americans who take public transit to work, fares can add up as well. According to the Consumer Expenditure Survey, administered by the Bureau of Labor Statistics, in 2022, individual households in the U.S. spent $12,295 on transportation — about 17% of all household expenditures (second only to housing).
Cheapest parking: According to SpotHero, New York City is the priciest place to park in the country — costing at least $350 a month. But in lower-density cities like Memphis, Columbus, and Houston, the expense is often under $40 a month.
Lowest fuel costs: Multiplying regional gas prices with the average length (in miles) of a commute in that region, we estimate that the average monthly cost of gas for commuting is Albuquerque‘s $34; Milwaukee comes in on the low end ($25 and under), and San Jose and San Diego are among the most expensive, at $50.
Cheapest public transit: On average, commuting via public transit costs around $70 a month. Once again, New York City is at the high end ($132), and smaller cities like Memphis ($25) and Albuquerque ($28) are at the low end (this data was collected before Albuquerque eliminated its transit fares entirely in late 2023). It’s worth noting, however, that the cost of public transit often correlates with the quality of the service (e.g., it takes nearly twice as long to commute by public transit in Memphis than in New York).
El Paso commuting cost stats
– Commuting cost score: 87.3
— 7th of the 35 cities ranked
– Monthly parking cost: $50
– Monthly fuel cost: $29.20
– Monthly public transit cost: $48
Cities with the cheapest commutes
#1. Memphis, TN: 100.0 commute cost score
#2. Columbus, OH: 95.8
#3. Albuquerque, NM: 94.0
#4. Houston, TX: 93.9
#5. Dallas, TX: 88.8
#6. Baltimore, MD: 88.5
#7. El Paso, TX: 87.3
#8. Tucson, AZ: 80.6
#9. Las Vegas, NV: 80.4
#10. Phoenix, AZ: 76.5

Canva
Cleanest commutes
In the U.S., transportation is the largest contributor to greenhouse gas emissions. And commutes are a big part of that: An average 15-mile commute in a private vehicle can lead to, roughly, an additional two to six tons of C02 emissions each year. Overall, people who live in (and take advantage of) cities that offer alternatives to driving a personal vehicle — biking, walking, public transit, etc. — have dramatically lower carbon footprints.
Most bike-friendly: San Francisco leads in the share of commuters who bike to work (over 3%), likely due to its favorable weather conditions and strong biking culture and infrastructure. Plus, Lyft-operated Bay Wheels is responsible for nearly 200,000 trips a month.
Most carpoolers: On average, roughly 9% of people carpool to work, but this percentage is highest in Southwest cities, like El Paso, San Antonio, and Las Vegas. Why? In Texas, it may be due to the large number of HOV lanes that incentivize driving with another passenger to avoid tolls.
Most walkers: On average, only 3% of Americans walk to work. But given that college towns tend to have the highest share of walking commuters, it’s no surprise that Boston — home to 44 institutions of higher learning — overperforms. A full 13% of commuters there walk to work.
Most-used public transit: Most New Yorkers agree: The best way to get around the city is the subway, which operates 24 hours a day, seven days a week. While an average of 3% of commuters nationwide take public transit, New York clocks in at a whopping 43%.
Fewest drivers: Overall, about three-quarters of Americans drive a private fuel-based vehicle to work. But in some cities — like, again, New York, Boston, and San Francisco — the plurality of commuters choose not to drive. According to Bourassa, this makes sense: It’s easier to avoid car use “in cities that were established before the automobile.” Driving EVs (which people most commonly use in the California cities of San Jose, San Francisco, and San Diego) can substantially reduce the impact of driving, so we removed EV miles traveled from our calculations.
El Paso commuting environmental stats
– Commuting environmental score: 17.3
— 23rd of the 35 cities ranked
– Bikers: 0.0% of commuters
– Carpoolers: 12.2% of commuters
– Walkers: 1.5% of commuters
– Public transportation: 0.5% of commuters
– Drivers: 87.5% of commuters
Cities with the most environmentally friendly commutes
#1. New York City, NY: 100.0 commute environmental score
#2. Boston, MA: 97.5
#3. San Francisco, CA: 92.2
#4. Washington, D.C.: 84.1
#5. Seattle, WA: 61.6
#6. Philadelphia, PA: 61.3
#7. Chicago, IL: 52.8
#8. Portland, OR: 38.8
#9. Denver, CO: 32.9
#10. Los Angeles, CA: 31.1

Canva
Most vibrant downtowns
Thinking beyond the literal journey, what might make a commute better? In this last section, we look at the cities with the most vibrant downtowns — as indicated by the presence of bars and shops — that draw people to work and, just maybe, convince them to stay a while.
Busiest downtowns: COVID took a toll on almost all city downtowns, and many have not fully recovered, leading to vacant storefronts and empty streets that are less enticing to the daily commuter. But according to Lyft data, in cities like Columbus and Baltimore, the recovery in downtown activity now exceeds 2019 levels.
Most bustling happy hours: Let’s be honest — what really makes going to the office worth it? The likelihood of getting a drink and gossiping with your friends or coworkers afterward. And in Washington, D.C., New York, and San Francisco, you are pretty darn likely — 40% more than average, according to Lyft data — to go to a bar or restaurant after work.
Busiest shoppers: Beyond happy hour, the possibility of doing some shopping after work can make a commuter’s trip downtown worth it. Lyft data suggests that the retail-rich cities of San Francisco and New York are most likely to entice commuters.
Green space: Taking a walk in a park before or after work can also add to a downtown’s attractiveness, so we included how much land in a city is devoted to green space as a metric.
Vacancy rates: Empty offices suggest a less lively downtown, so we gave a city’s vacancy rate a negative value when adding all the results together to calculate each city’s vibrancy scores.
El Paso downtown vibrancy stats
– Downtown vibrancy score: 57.1
— 4th of the 35 cities ranked
– Downtown activity: 0.9X fewer ride shares compared to pre-Covid
– Green space: 18% of city area
– Office vacancy rates: 10%
Cities with the most vibrant downtowns
#1. New York City, NY: 100.0 downwtown vibrancy score
#2. Washington, D.C.: 78.2
#3. Boston, MA: 60.0
#4. El Paso, TX: 57.1
#5. Baltimore, MD: 52.0
#6. Las Vegas, NV: 50.7
#7. San Francisco, CA: 48.9
#8. San Diego, CA: 48.8
#9. Columbus, OH: 46.9
#10. Chicago, IL: 42.3

Canva
Best commutes
Considering all four measures, El Paso is the 2nd best city for commuting.
Cities with the best commutes
#1. Columbus, OH: 84.5 overall commute score
#2. El Paso, TX: 82.4
#3. Las Vegas, NV: 80.3
#4. Memphis, TN: 67.2
#5. Albuquerque, NM: 66.5
#6. Baltimore, MD: 59.9
#7. Phoenix, AZ: 58.5
#8. Tucson, AZ: 55.0
#9. Detroit, MI: 52.2
#10. Dallas, TX: 49.1
Methodology
- The commuter survey was conducted online within the United States by The Harris Poll from Aug. 22 through Aug. 26, 2024. A representative sample of 1,404 respondents aged 18+ completed the survey. All respondents had to regularly commute to work (via personal driving, carpool, public transportation, rideshare, etc.) to qualify.
- Average commute time (minutes) is calculated using the 2022 American Census Survey, as the average time it takes for a working person to commute in minutes.
- Traffic (mph) is calculated using Lyft data, as the average speed for rides to/from office and work destinations during commuting hours (6 a.m. to 10 a.m. and 4 p.m. to 8 p.m.), from August 2023 to August 2024.
- Congestion during commuting hours (% change) is calculated using Lyft data, as the percent change in average speed for rides to/from office and work destinations during commuting hours, relative to average speed for non-commuting rides, from August 2023 to August 2024.
- Speed score is a sum of (negative) average commute time, traffic (mph), and congestion during commuting hours (percent change), after each measure has been standardized to have a standard deviation of 1 and a mean of 0.
- Monthly parking cost ($) is estimated using SpotHero (following Finn 2023), where we took the lowest monthly parking price for each city, starting in August 2024.
- Monthly fuel cost ($) is estimated using EIA data as of Aug. 4, 2024. For cities without city-level data, we used the region’s average fuel cost. Following Brookings’ (2011) strategy, we multiplied that number by the average miles for a commute to an office or work destination (Lyft data) and divided by mpg for the average 2024 vehicle.
- Monthly public transit cost ($) is the cost of a monthly pass for public transit (streetcar, bus, light and heavy rail, etc.) in each city. Source: American Public Transportation Association (APTA) 2022, by way of Coast.
- Cost score is the average cost of driving and using public transit for each city, weighted by the share of commuters who commute that way, and then standardized to have a standard deviation of 1 and a mean of 0.
- Bike to work is calculated using the Census Bureau’s 2022 American Community Survey (ACS) as the share of commuting residents who bike to work.
- Carpool to work is calculated using the ACS 2022 as the share of commuting residents who carpool to work.
- Walk to work is calculated using the ACS 2022 as the share of commuting residents who walk to work.
- Public transit to work is calculated using the ACS 2022 as the share of commuting residents who take public transit (bus, light rail, train) to work.
- Drive a fuel car to work is the share of commuters who drive to work, calculated using the ACS 2022, multiplied by the share of miles driven in non-electric vehicles (data from Replica, weighted by population to get to city-level data).
- Environmental score is the sum of the percentages of people who bike, carpool, walk, take public transit, and drive a fuel car (negative) to work, after each measure has been standardized to have a standard deviation of 1 and a mean of 0.
- Downtown rebound is calculated using Lyft data, as the ratio of average monthly rides to a city’s downtown (January 2024 to August 2024) relative to the average monthly rides to the downtown in 2019.
- Likelihood of happy hour is calculated using Lyft data from August 2023 to August 2024, as the rate of going to a restaurant or happy hour after the office, relative to the average rate.
- Likelihood of shopping after is calculated using Lyft data from August 2023 to August 2024, as the rate of going to a mall, pharmacy, or shop after the office, relative to the average rate.
- Office vacancy rate is pulled from the Q4 2023 Colliers Office market report. Supplemented by individual city reports.
- Green space is calculated using the Trust for Public Land‘s data on the share of city land devoted to parks.
- Vibrancy score is a sum of downtown rebound, likelihood of happy hour, likelihood of shopping after, office vacancy rate (negative), and green space, after each measure has been standardized to have a standard deviation of 1 and a mean of 0.
- Commute score is the average across speed score, cost score, environmental score, and vibrancy score.
This story was produced by Lyft and reviewed and distributed by Stacker Media.
