Energy bill up? Here’s how electricity costs have changed over the past year
Sunshine Studio // Shutterstock
Energy bill up? Here’s how electricity costs have changed over the past year
A square home electricity meter inside a clear weatherproof box.
Electricity costs across the U.S. are making their biggest jumps since the last major economic downturn.
Despite pushing to build more renewable energy sources over the last decade, fossil fuels still buoy most of our electricity generation. All the voltage required to keep our lights and appliances powered daily has to come from somewhere—and 60% of that electricity in the U.S. comes from plants that turn petroleum, coal, and natural gas into power. While America has, to a large degree, mitigated its reliance on petroleum, natural gas and coal together account for all but 0.7% of all fossil fuel-based electricity generation.
A shortage of natural gas around the globe is pushing the prices to record levels. Of course, utility providers are passing that cost increase on to their consumers—the average American owner or renter. The ongoing war in Ukraine has also created a battle of resources, as Russia has revoked allied countries’ access to its oil and natural gas resources. The war reached a possible fracture as Russian President Vladimir Putin annexed four Ukrainian regions and made unsubtle hints at nuclear retaliation should NATO nations attempt to intercede.
Russia is the second largest producer of natural gas in the world. However, unlike the U.S., Russia’s largest oil and gas producers are controlled by the state, meaning the industry can be manipulated and weaponized by its government. In the last two decades, the U.S., particularly Texas, tripled down on natural gas production through innovative new extraction techniques known as “fracking.”
Even with the elevated U.S. natural gas production over the last 10 years, the global shortage combined with the Biden administration’s decision to export more fossil fuel is pinching markets and driving prices up.
A Bank of America data analysis released in September 2022 found households with incomes below $150,000 per year have experienced the most significant increases in their utility bills this year. While gas prices have risen, their rise doesn’t compare to that of electricity costs, which also differ among states—each of which is home to an energy industry that uses different combinations of renewable energy sources and fossil fuels to power homes.
OhmConnect analyzed data from the Energy Information Administration to examine the rising cost of residential electricity in the U.S. and how it varies across states.
![]()
OhmConnect
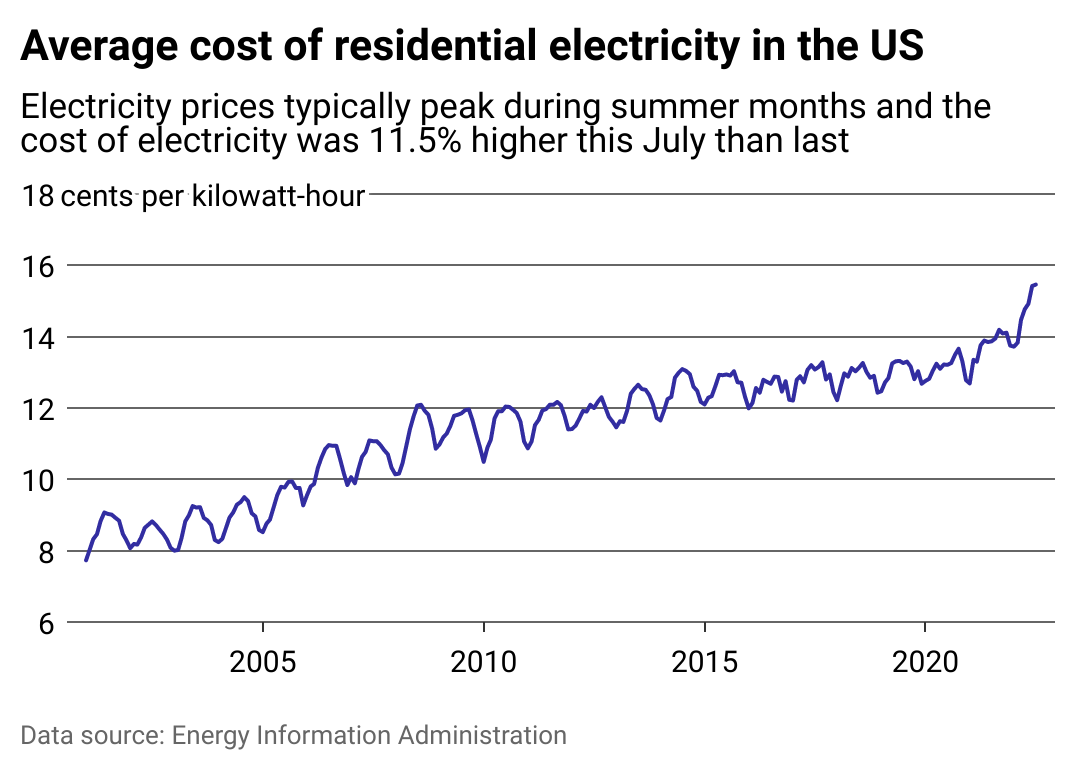
Residential electricity costs set a new record in July 2022
Line chart showing the seasonally fluctuating cost of electricity in centers per kilowatthour, with July 2022 setting a new record
The average monthly cost of electricity hit 15 cents per kilowatt-hour in June. The price declined for almost half of 2020 before beginning the upward trajectory into 2021 and 2022. In July, the average American’s utility bill reflected electricity costs that were more than 11% higher than the same month in 2021.
The last time Americans saw electricity prices jump this much was in 2009. Before that, the first nine months of 2006 came with double-digit increases in electricity prices as the 2000s energy crisis peaked, driven by high demand and natural disasters such as Hurricane Katrina, which shut down 90% of U.S. oil production for some time.
OhmConnect
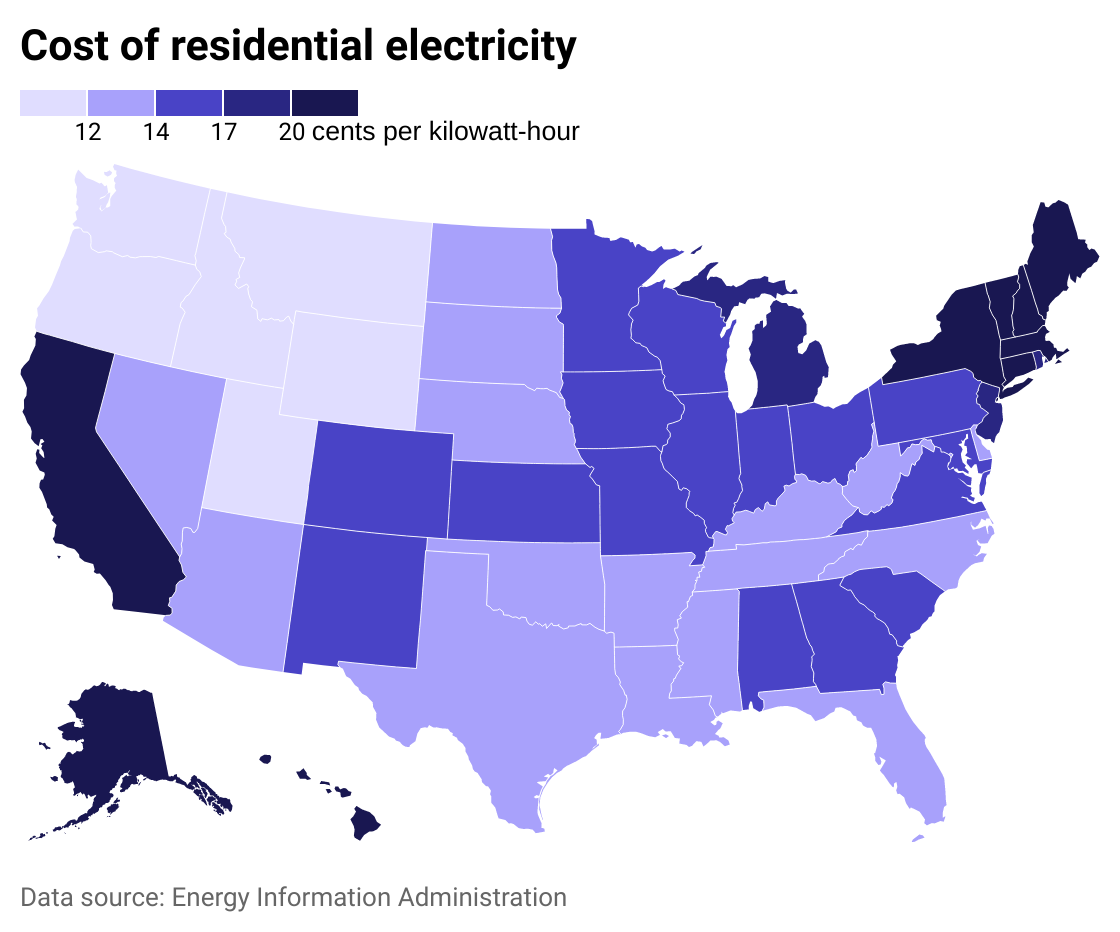
New England and California residents have the highest electricity costs in the continental US
Map showing regional trends of electricity cost. Costs in the Pacific Northwest are lowest per kilowatthour
New England states, including Maine, Connecticut, and New Hampshire, are susceptible to spikes in the price of natural gas due to the states’ power grids’ reliance on fossil fuels, according to power grid operator ISO New England. The region uses natural gas for 53% of its electricity needs; the national average is 38%. Proposals to create approximately 30,000 MW of wind power generating capacity in the region would make wind-generated power competitive within the grid, which presently has just under 33,000 MW in overall generating capacity—but such measures have yet to be implemented.
OhmConnect
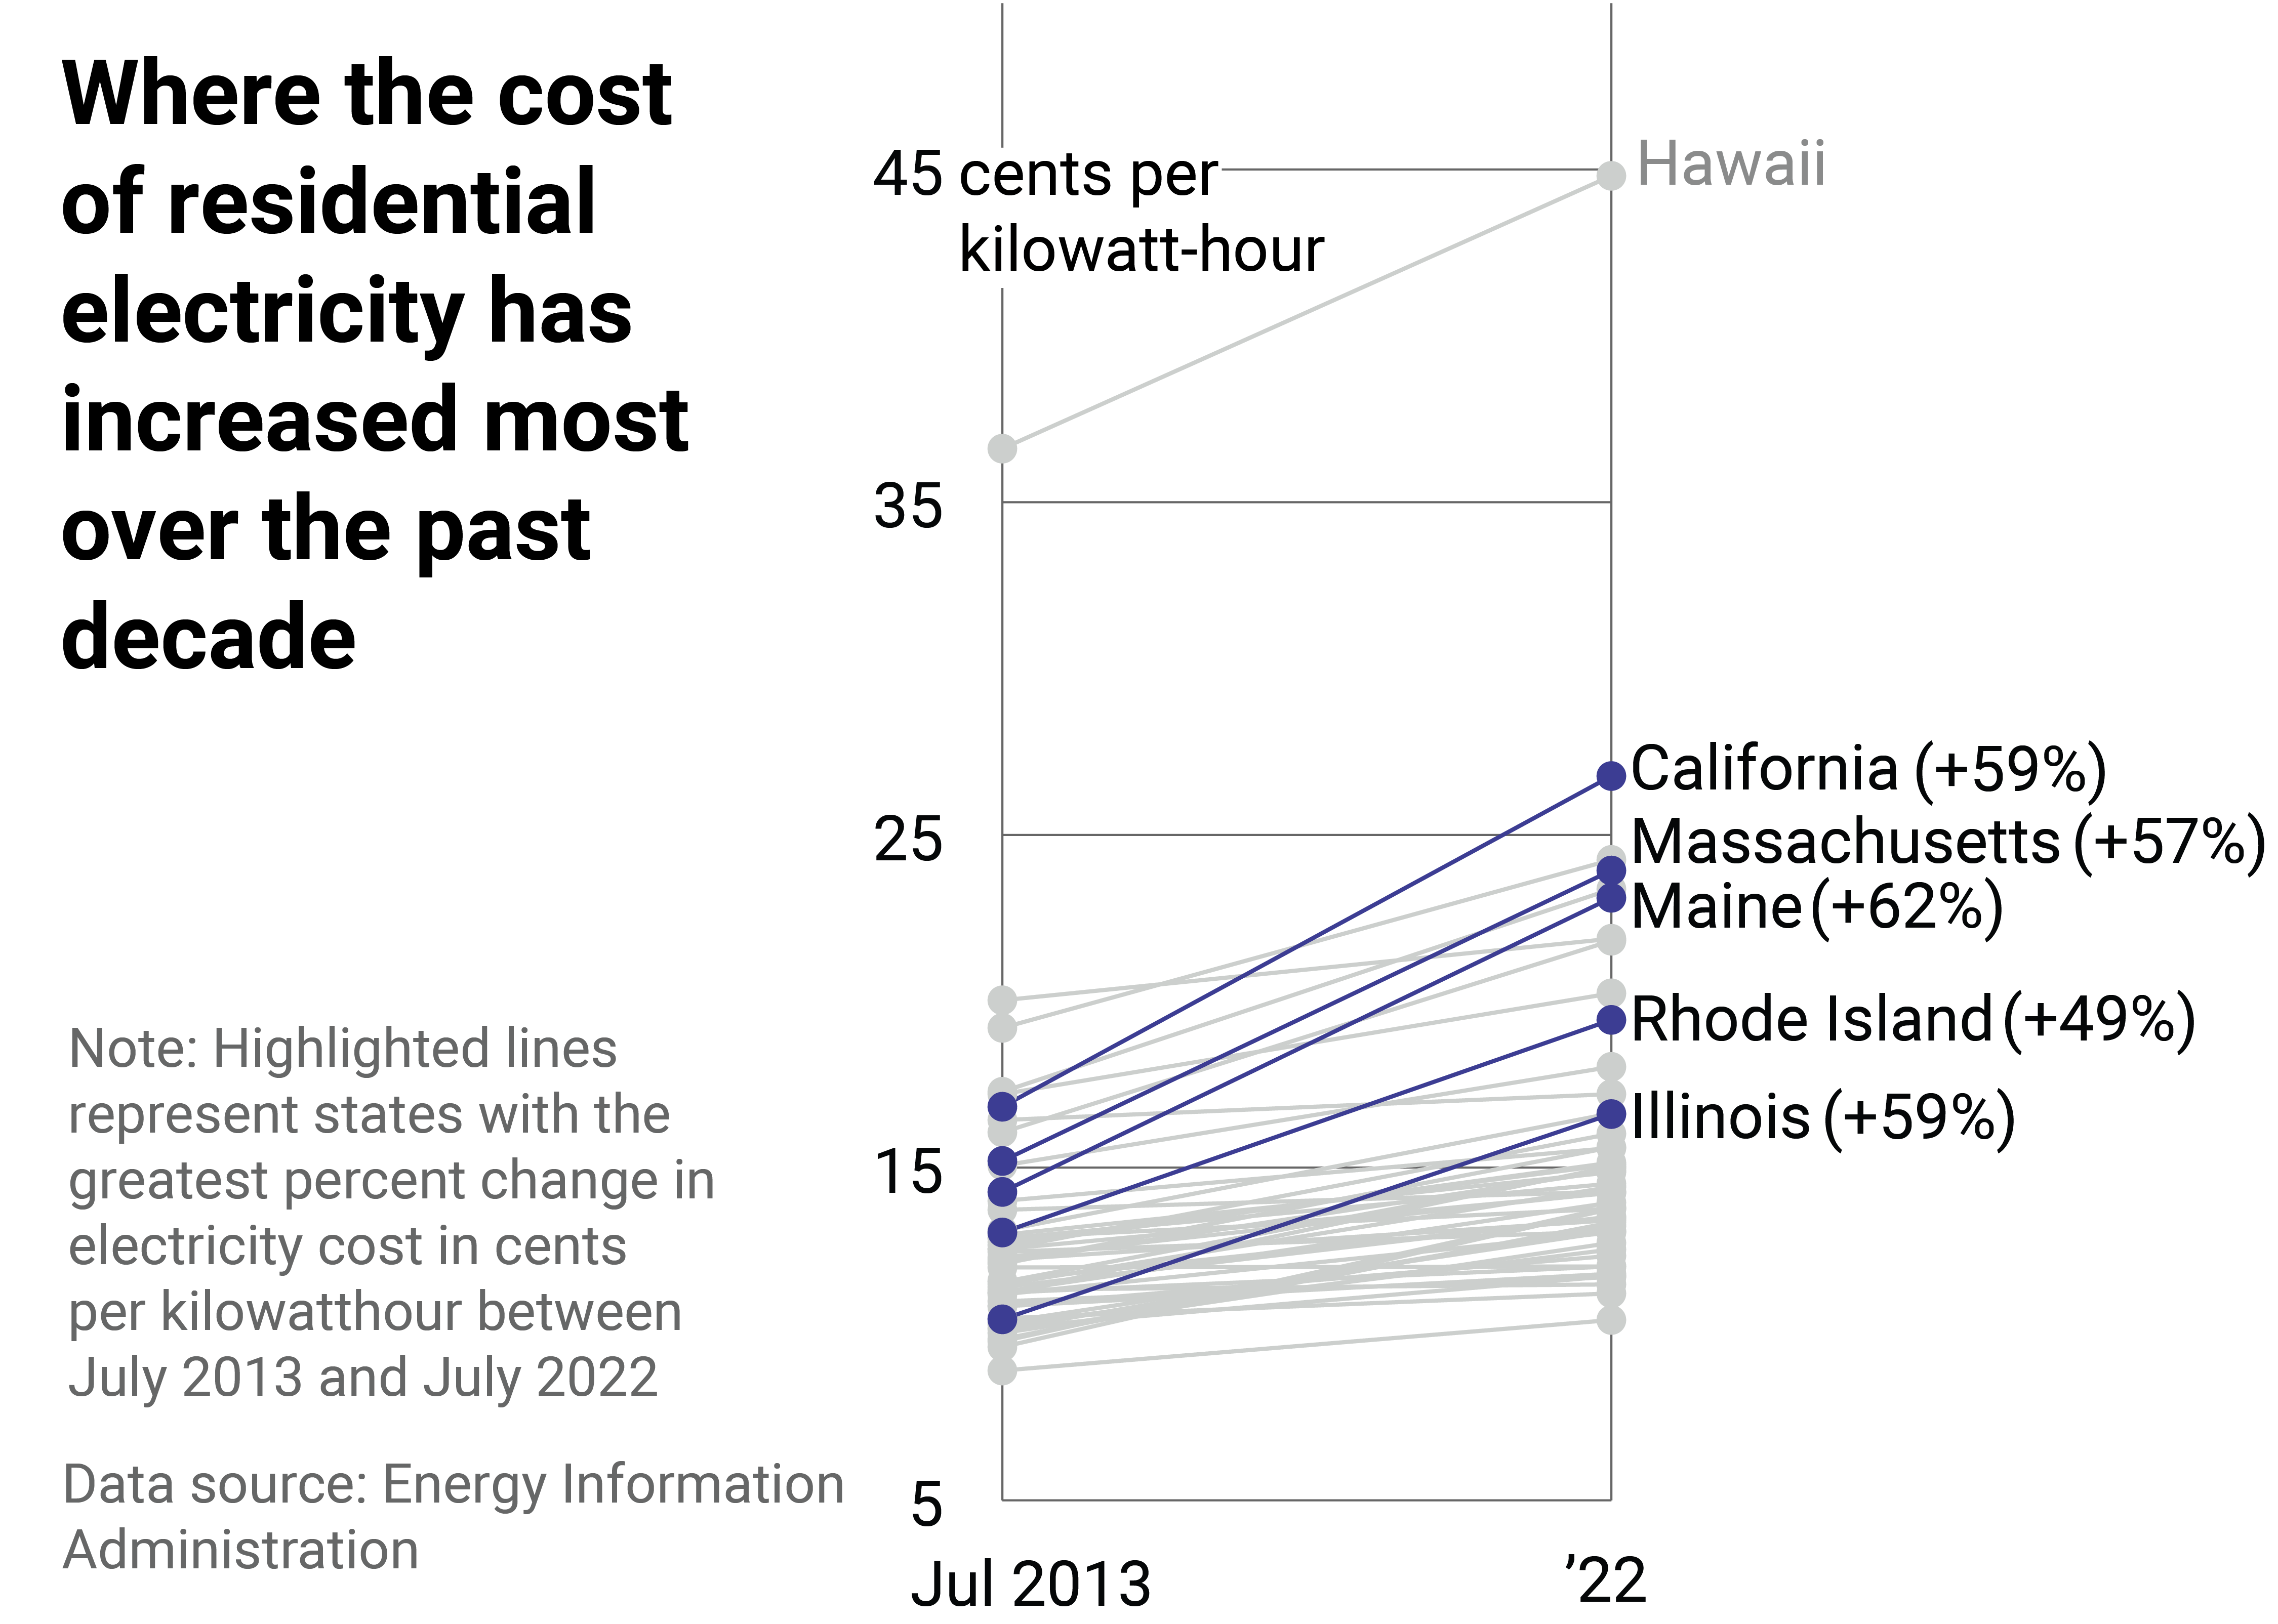
California and some New England states have also seen the most significant cost increases since 2013
Map showing regional trends of change in electricity cost since July 2013
California, Massachusetts, Maine, Rhode Island, and Illinois have seen residential electricity prices jump more than any other state over the last decade.
In recent years, as the population has grown and the demand for electricity generation has increased, New York has resisted the building of new or expanded pipelines that could move more natural gas north from Pennsylvania and other states. Opponents argue more infrastructure creates more dependence on fossil fuels. Oil and gas proponents have derided the bans on pipeline expansions and other attempts to de-emphasize fossil fuels, saying it’s a factor driving up consumer costs.
On the West Coast, California might as well be the poster child of energy fragility in the modern era as wildfires and heat waves wreak havoc on its power grid year after year. The state continues to wrestle with increased energy costs while setting aggressive electrification goals to combat climate change. Baked into the state’s electricity rates are funds for infrastructure upgrades, wildfire damage mitigation, and energy efficiency programs.
This story originally appeared on OhmConnect and was produced and
distributed in partnership with Stacker Studio.
