How COVID-19 recovery will impact the 14 top business travel markets

Canva
How COVID-19 recovery will impact the 14 top business travel markets
Three business women walking down the street, one pulling a rolling bag.
In the two and a half years since the COVID-19 pandemic began, nearly every industry has been fundamentally transformed, from health care and retail to shipping and manufacturing. But one of the first and most deeply affected industries to feel the initial brunt of the pandemic was travel.
Mass cancellations of flights, trains, and rental car reservations in March 2020 sent the travel sector into a spiral, with business travel being the most acutely affected. Pre-pandemic, the global business travel industry was responsible for $1.4 trillion in direct spending. While spending is expected to grow 38% this year to bring global business travel spending back over $1 trillion, a return to pre-pandemic levels likely won’t happen until 2024 at the earliest.
To better understand the future travel outlook in different global markets, TravelPerk used the Global Business Travel Association’s Business Travel Spending report to rank the countries that spend the most on domestic and international business travel
There are several challenges with forecasting business travel during such an uncertain period. GBTA’s report focused on the ability to analyze high-frequency data on flight and hotel demand and its relationship with other economic and epidemiological data. Generally speaking, business travel activity rises and falls with global output. However, there is a notable break in the trend in 2020 as the pandemic has affected business travel to a much greater extent than overall economic activity.
This study of global business travel activity looked at a total of 73 countries from 44 different industries, and the top 14 are included in this story. Russia, originally among the top 15, was excluded given the impact of the war on business travel projections.
The study includes business travel spending, productivity, and growth, and understands business travel spending as both domestic and international outbound spending, taking into account the origin of the business travel. The sources used are from the supply side, such as airlines, hotels, and rental car companies, as well as government, travel research groups, and others.
The data points featured contain estimates drawn from actual business travel figures for 2019-2020 and estimates drawn from projected figures for 2021-2025. As part of the comprehensive list, COVID-19 data extracted from Our World in Data is included.
Since many countries still apply different levels of travel restrictions, this can make it difficult for the sector to fully recover. An updated map of the latest restrictions can be found on the World Travel Restrictions U.N. World Food Programme website.
![]()

Canva
#14. Japan
A woman waiting for a train in Japan.
– Estimated change in business travel spending 2019 to 2020: -57.0%
– Estimated change in business travel spending 2020 to 2021: -36.7%
– Projected change in business travel spending 2019 to 2025: +17.5%
COVID-19 trends:
– Cumulative COVID-19 cases (as of July 13, 2022): 9,901,424
– Estimated cases per 1M people: 79,457.69
– Notable peak period: Feb. 1, 2022-Feb. 9, 2022 (758.28 cases per 1M people)

Canva
#13. United Kingdom
A man in a gray suit looking at his phone on the street while pulling a suitcase.
– Estimated change in business travel spending 2019 to 2020: -60.0%
– Estimated change in business travel spending 2020 to 2021: -17.2%
– Projected change in business travel spending 2019 to 2025: +12.4%
COVID-19 trends:
– Cumulative COVID-19 cases: 23,159,426
– Estimated cases per 1M people: 344,219.20
– Notable peak period: Dec. 29, 2021-Jan. 5, 2022 (2,718.57 cases per 1M people)

Canva
#12. India
A man with a leather briefcase sitting on steps while working on his laptop.
– Estimated change in business travel spending 2019 to 2020: -58.4%
– Estimated change in business travel spending 2020 to 2021: -14.4%
– Projected change in business travel spending 2019 to 2025: +4.9%
COVID-19 trends:
– Cumulative COVID-19 cases: 43,689,989
– Estimated cases per 1M people: 31,039.44
– Notable peak period: May 1, 2021-May 8, 2021 (277.95 cases per 1M people)
Canva
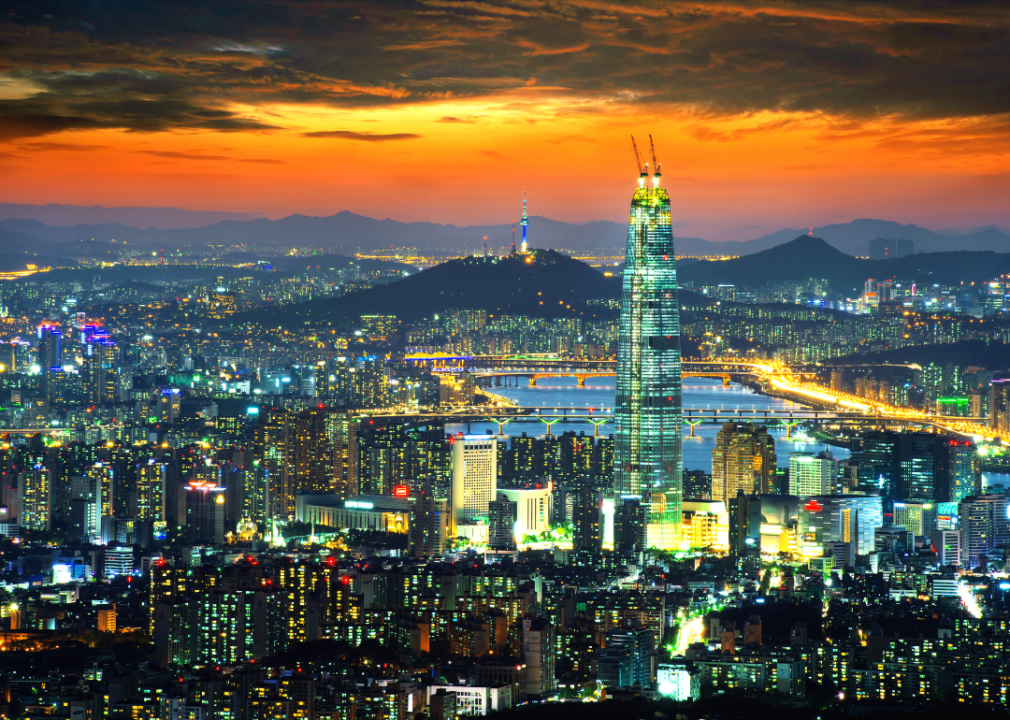
#11. South Korea
Seoul, South Korea skyline in the evening with an orange sky.
– Estimated change in business travel spending 2019 to 2020: -60.5%
– Estimated change in business travel spending 2020 to 2021: -14.3%
– Projected change in business travel spending 2019 to 2025: +1.1%
COVID-19 trends:
– Cumulative COVID-19 cases: 18,641,278
– Estimated cases per 1M people: 359,660.97
– Notable peak period: May 10, 2022-May 17, 2022 (7,893.94 cases per 1M people)
Canva
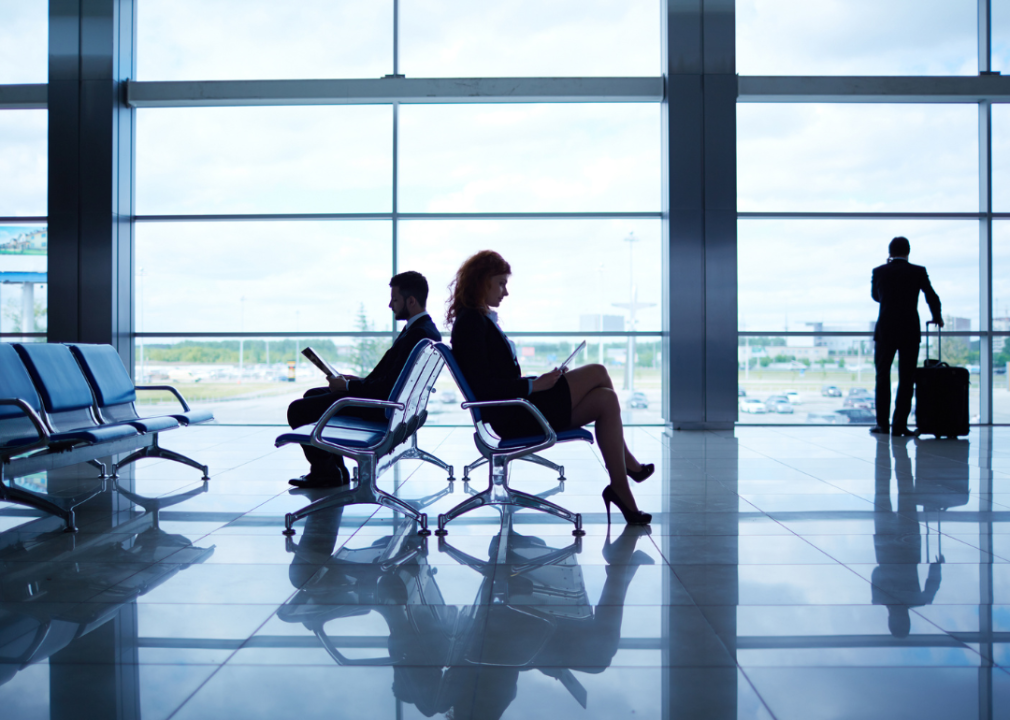
#10. Canada
Business travelers waiting in the airport.
– Estimated change in business travel spending 2019 to 2020: -54.3%
– Estimated change in business travel spending 2020 to 2021: -10.7%
– Projected change in business travel spending 2019 to 2025: +7.9%
COVID-19 trends:
– Cumulative COVID-19 cases: 4,000,304
– Estimated cases per 1M people: 104,843.47
– Notable peak period: Jan. 3, 2022-Jan. 10, 2022 (1,087.00 cases per 1M people)
Canva
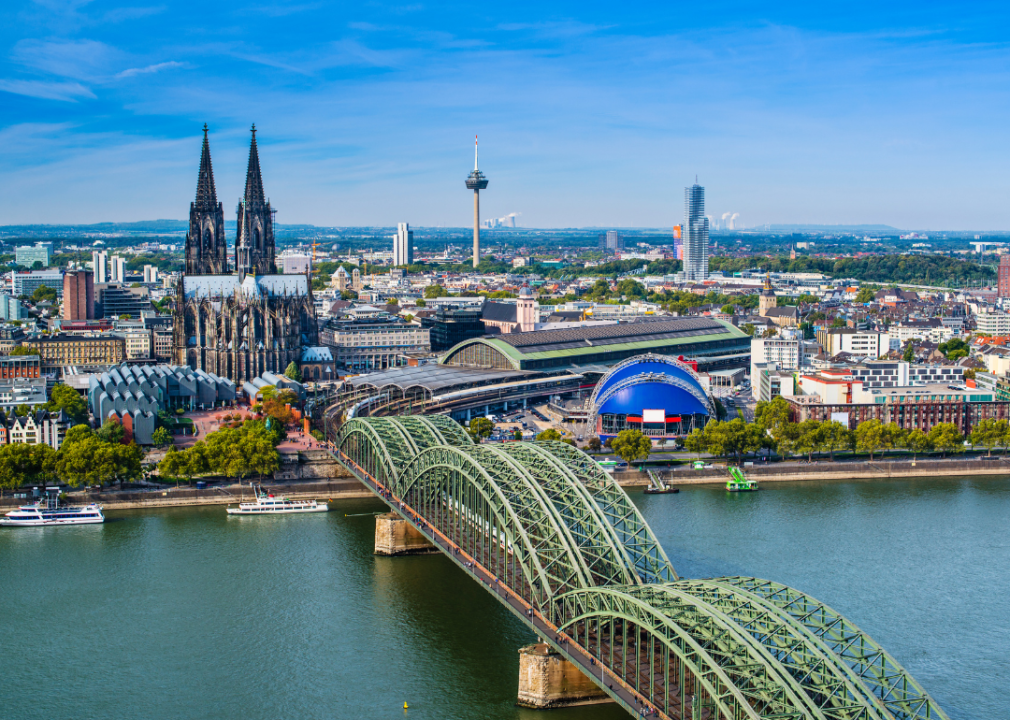
#9. Germany
Aerial view of Cologne, Germany.
– Estimated change in business travel spending 2019 to 2020: -61.5%
– Estimated change in business travel spending 2020 to 2021: -7.8%
– Projected change in business travel spending 2019 to 2025: +5.0%
COVID-19 trends:
– Cumulative COVID-19 cases: 29,460,249
– Estimated cases per 1M people: 353,204.17
– Notable peak period: March 24, 2022-March 31, 2022 (3,015.39 cases per 1M people)

Canva
#8. Italy
Two business people sitting by a fountain in Rome.
– Estimated change in business travel spending 2019 to 2020: -62.1%
– Estimated change in business travel spending 2020 to 2021: -4.3%
– Projected change in business travel spending 2019 to 2025: +9.7%
COVID-19 trends:
– Cumulative COVID-19 cases: 19,778,911
– Estimated cases per 1M people: 333,875.77
– Notable peak period: Jan. 7, 2022-Jan. 14, 2022 (3,069.22 cases per 1M people)
Canva
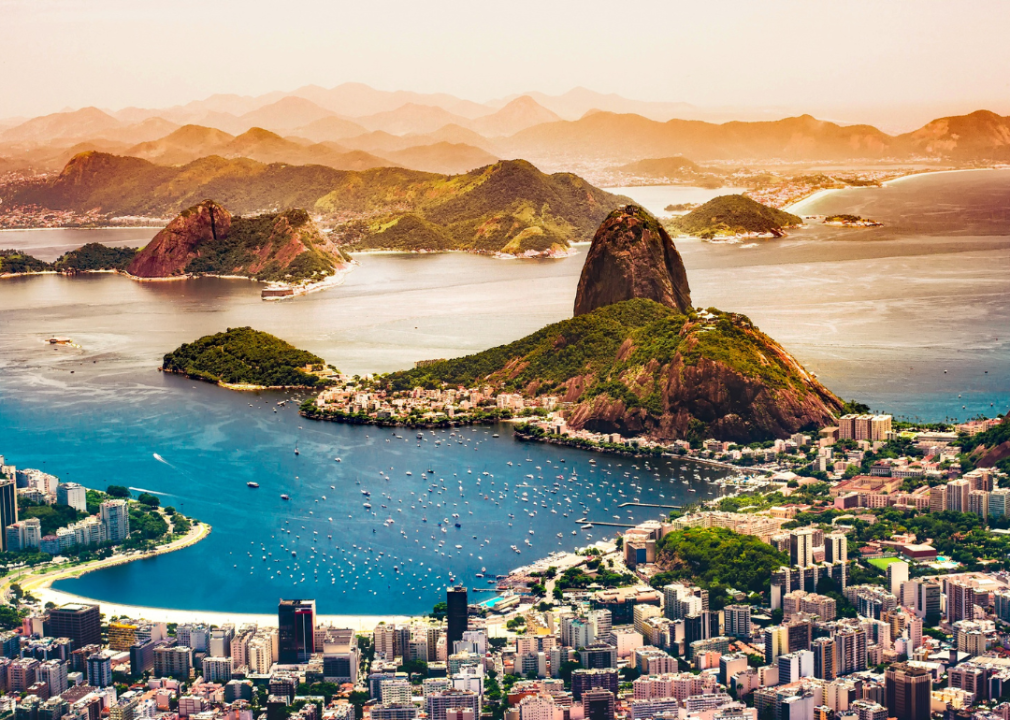
#7. Brazil
Rio de Janeiro, Brazil cityscape and water.
– Estimated change in business travel spending 2019 to 2020: -55.4%
– Estimated change in business travel spending 2020 to 2021: -2.7%
– Projected change in business travel spending 2019 to 2025: -0.4%
COVID-19 trends:
– Cumulative COVID-19 cases: 33,076,779
– Estimated cases per 1M people: 154,329.13
– Notable peak period: Jan. 22, 2022-Jan. 29, 2022 (882.89 cases per 1M people)
Canva
#6. France
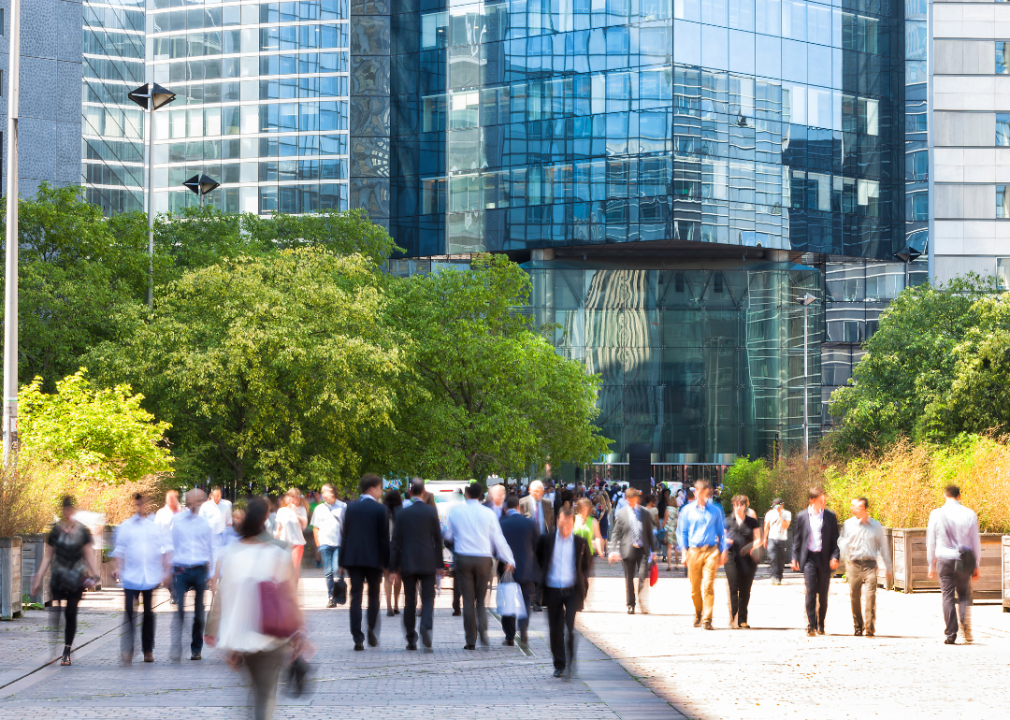
Blurred business people walking to work in France.
– Estimated change in business travel spending 2019 to 2020: -56.6%
– Estimated change in business travel spending 2020 to 2021: +1.4%
– Projected change in business travel spending 2019 to 2025: +6.3%
COVID-19 trends:
– Cumulative COVID-19 cases: 32,737,629
– Estimated cases per 1M people: 485,563.01
– Notable peak period: Jan. 18, 2022-Jan. 25, 2022 (5,436.72 cases per 1M people)
Canva
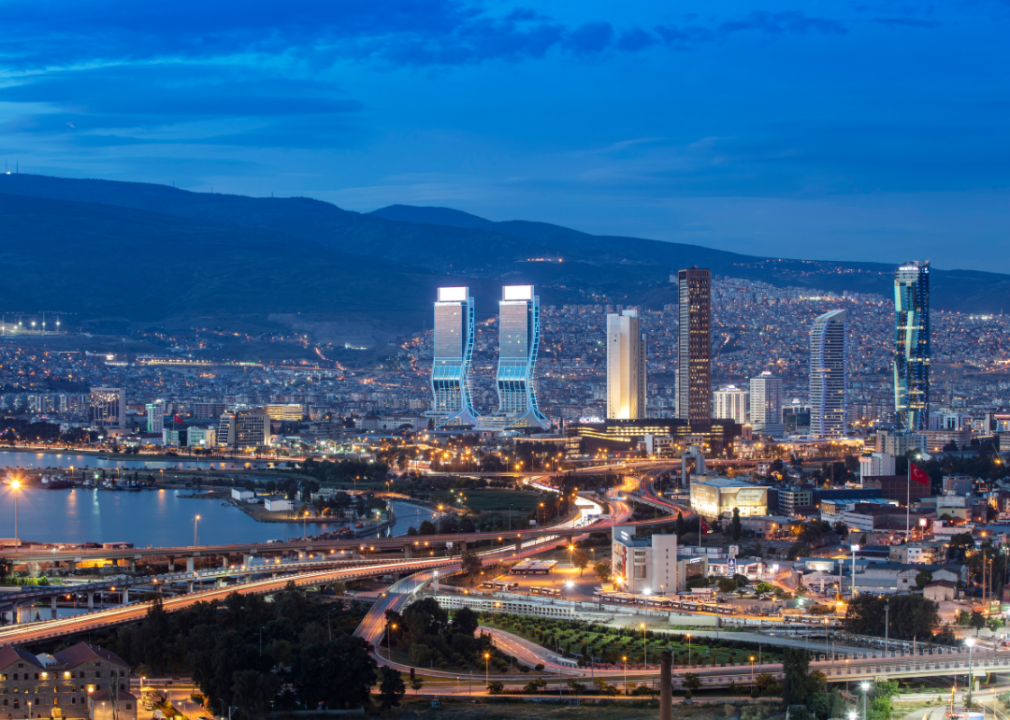
#5. Turkey
The city of Izmir in Turkey at night.
– Estimated change in business travel spending 2019 to 2020: -33.7%
– Estimated change in business travel spending 2020 to 2021: +6.8%
– Projected change in business travel spending 2019 to 2025: -11.1%
COVID-19 trends:
– Cumulative COVID-19 cases: 15,297,539
– Estimated cases per 1M people: 180,447.85
– Notable peak period: Feb. 1, 2022-Feb. 8, 2022 (1,219.40 cases per 1M people)
Canva
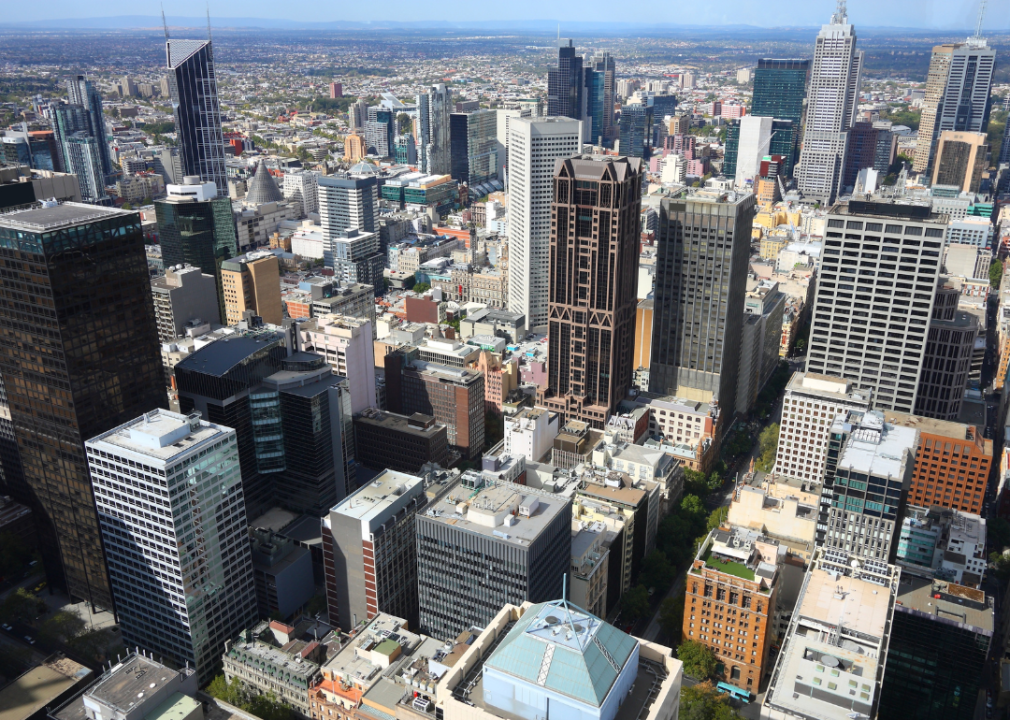
#4. Australia
Skyscrapers in Melbourne City, Australia.
– Estimated change in business travel spending 2019 to 2020: -60.9%
– Estimated change in business travel spending 2020 to 2021: +11.1%
– Projected change in business travel spending 2019 to 2025: -1.6%
COVID-19 trends:
– Cumulative COVID-19 cases: 8,653,081
– Estimated cases per 1M people: 333,823.98
– Notable peak period: Jan. 6, 2022-Jan. 13, 2022 (4,213.35 cases per 1M people)
Canva
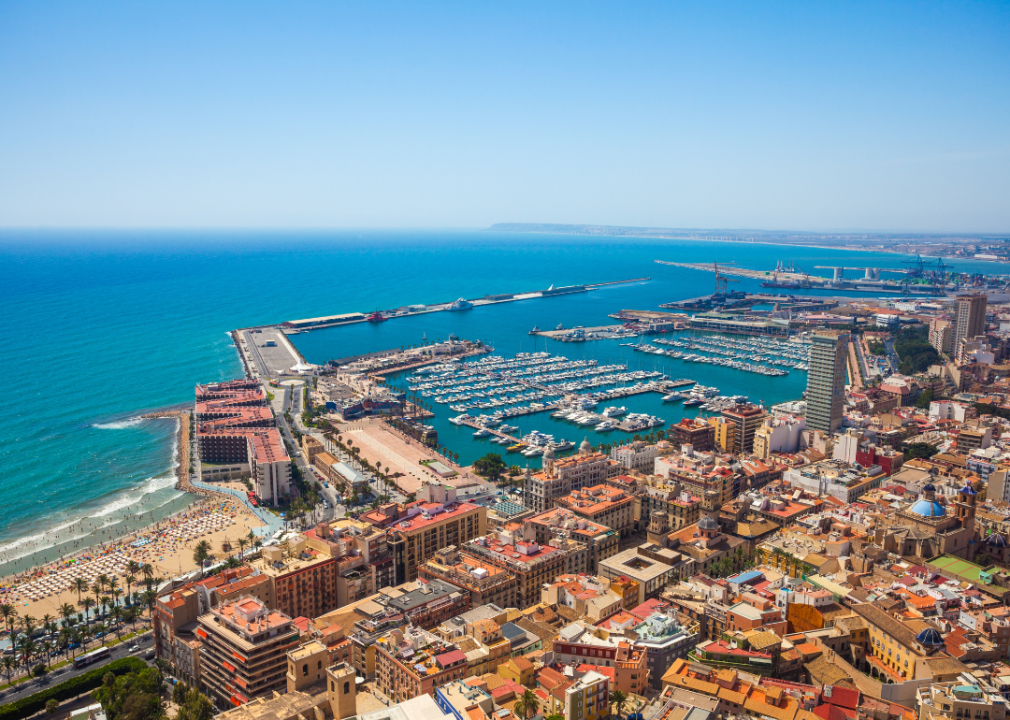
#3. Spain
Aerial view of Alicante, Spain.
– Estimated change in business travel spending 2019 to 2020: -57.0%
– Estimated change in business travel spending 2020 to 2021: +12.7%
– Projected change in business travel spending 2019 to 2025: +8.5%
COVID-19 trends:
– Cumulative COVID-19 cases: 13,032,841
– Estimated cases per 1M people: 274,451.09
– Notable peak period: Jan. 6, 2022-Jan. 13, 2022 (3,032.60 cases per 1M people)

Canva
#2. United States
Two women discussing business over coffee.
– Estimated change in business travel spending 2019 to 2020: -61.2%
– Estimated change in business travel spending 2020 to 2021: +30.8%
– Projected change in business travel spending 2019 to 2025: +11.2%
COVID-19 trends:
– Cumulative COVID-19 cases: 89,149,655
– Estimated cases per 1M people: 264,540.90
– Notable peak period: Jan. 8, 2022-Jan. 15, 2022 (2,397.05 cases per 1M people)

Canva
#1. China
Laptop and business folder on the bed in a hotel room.
– Estimated change in business travel spending 2019 to 2020: -41.4%
– Estimated change in business travel spending 2020 to 2021: +31.7%
– Projected change in business travel spending 2019 to 2025: +9.9%
COVID-19 trends:
– Cumulative COVID-19 cases: 893,814
– Estimated cases per 1M people: 626.85
– Notable peak period: April 8, 2022-April 15, 2022 (18.63 cases per 1M people)
This story originally appeared on TravelPerk and was produced and
distributed in partnership with Stacker Studio.
