US airports with the most delays
Canva
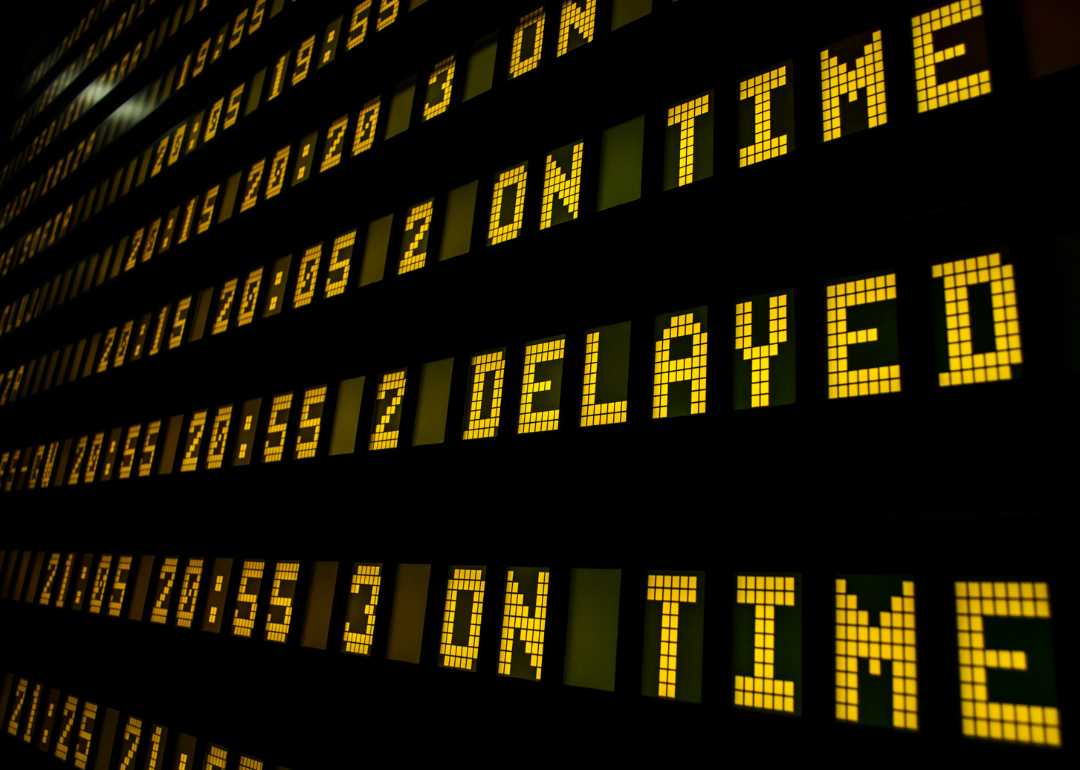
US airports with the most delays
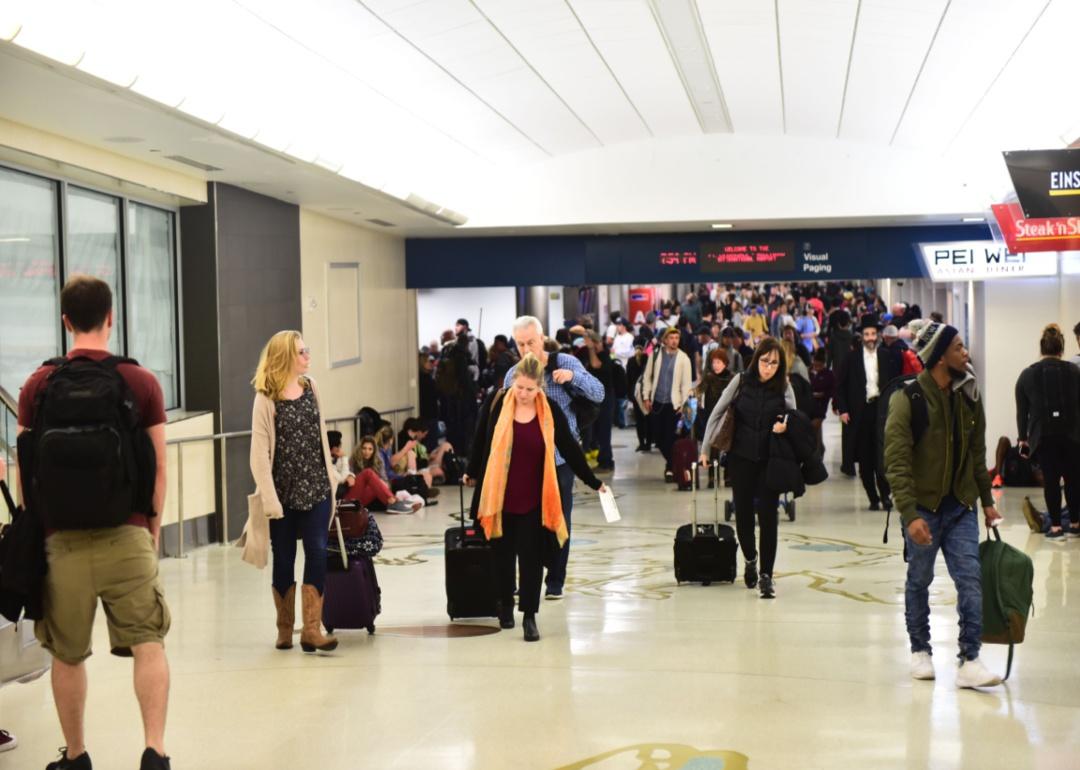
A black sign with yellow lettering showing flight delays.
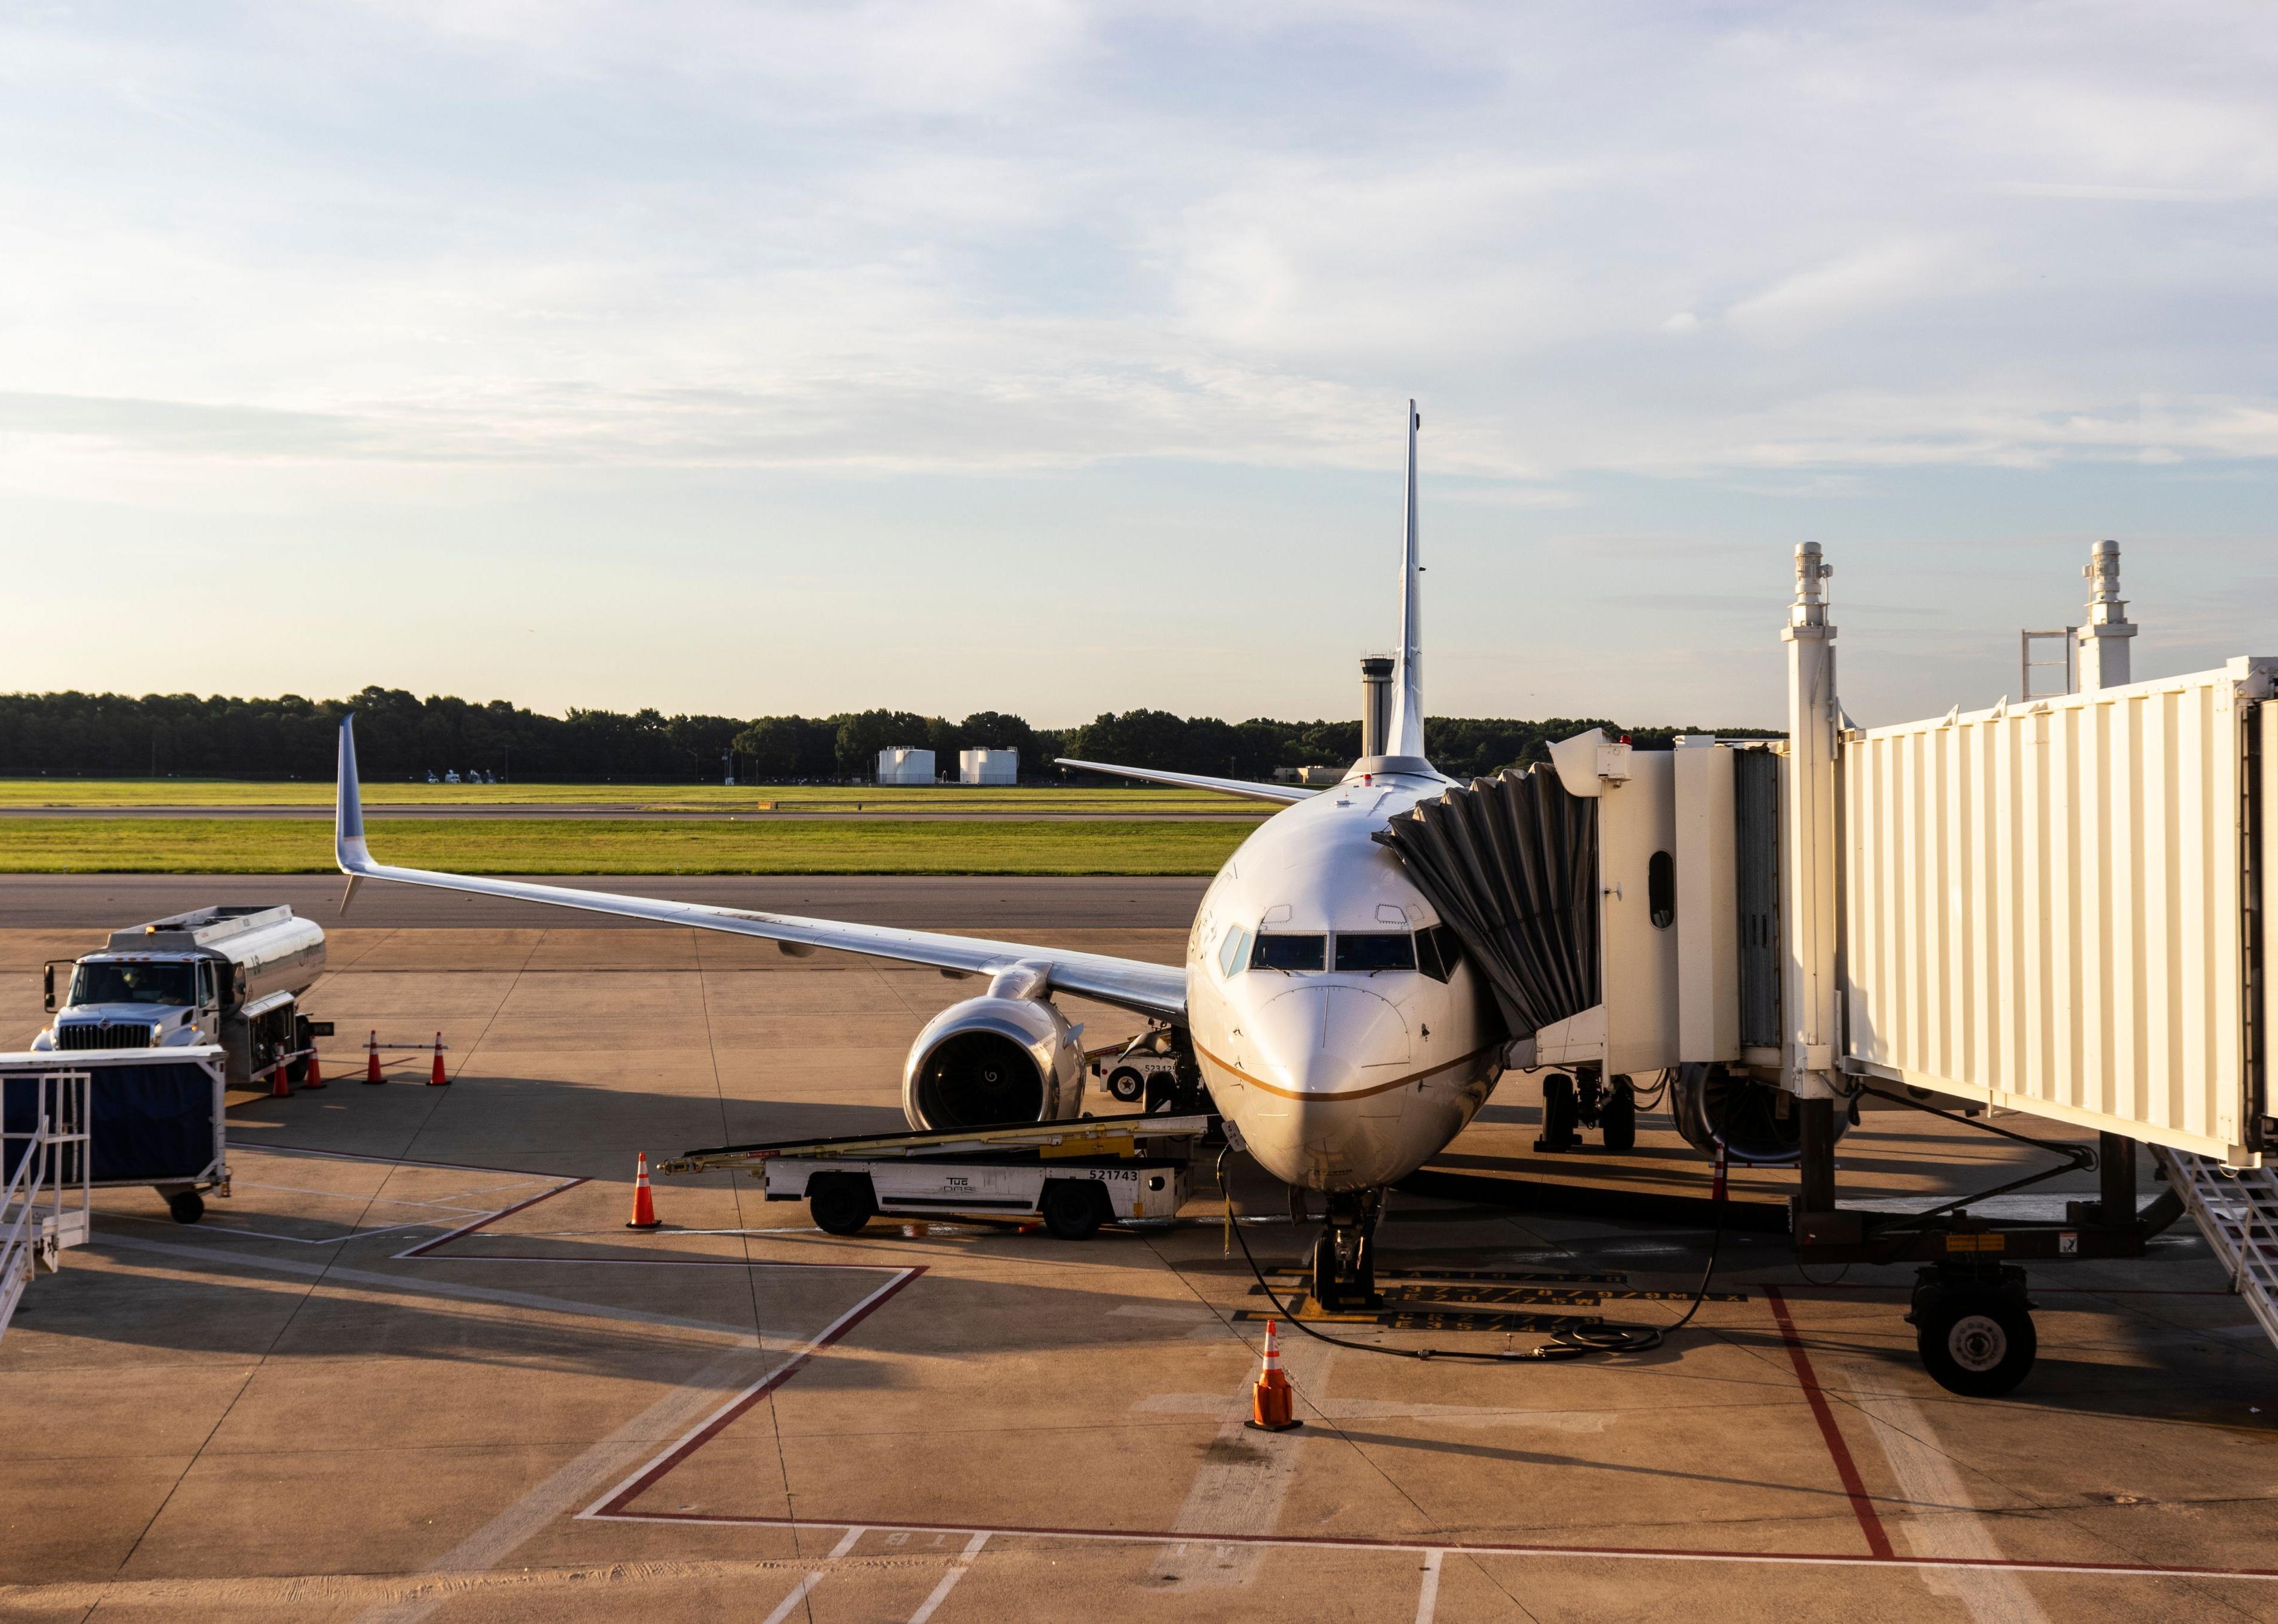
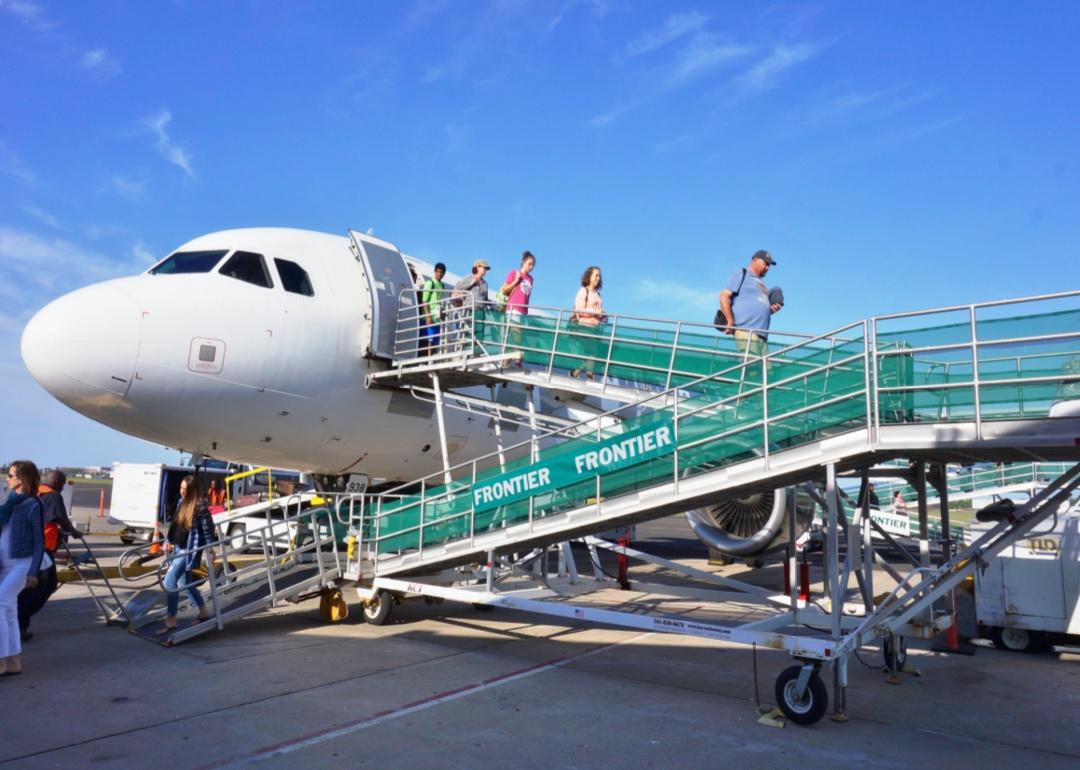
Frequent fliers and first-time passengers dread arriving at airports only to discover their flights have been delayed—or worse, canceled. Even a delay of one hour can throw a journey into disarray, causing passengers to miss connecting flights or the meetings they were flying out to catch in the first place.
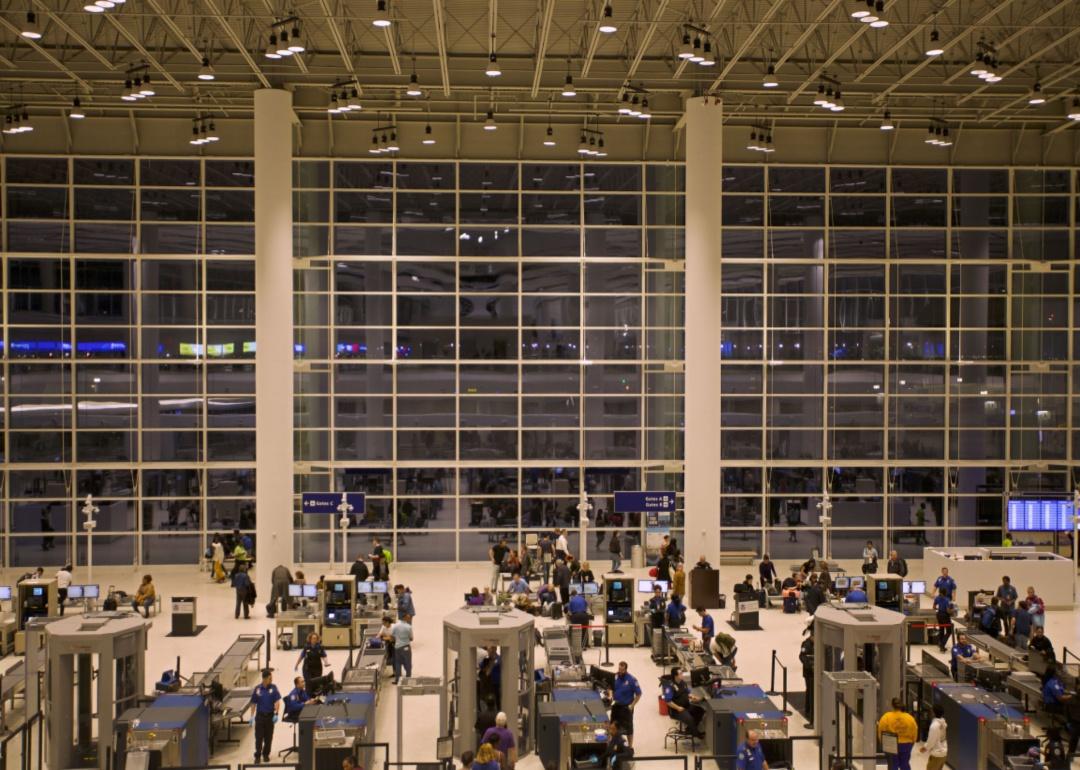
There are five basic kinds of cancellations and delays for aircraft. Carrier delays are the fault of the airline and often the most frustrating for passengers, like inefficient loading and unloading, plane cleanings, fueling delays, or problems with maintenance and crew. Extreme weather delays refer to uncontrollable, dangerous weather that postpones or prevents an aircraft from taking off. National Airspace System delays are within the control of the NAS and include nonextreme weather, heavy airline traffic, or air traffic control issues. Late-arriving aircraft delays refer to flights arriving late, so the aircraft’s next flight is similarly delayed. The last delay involves airport security, which causes big headaches when long lines (defined as waits lasting 30 minutes or longer), broken equipment, terminals, or concourse evacuation or reboarding due to a security breach causes a delay.
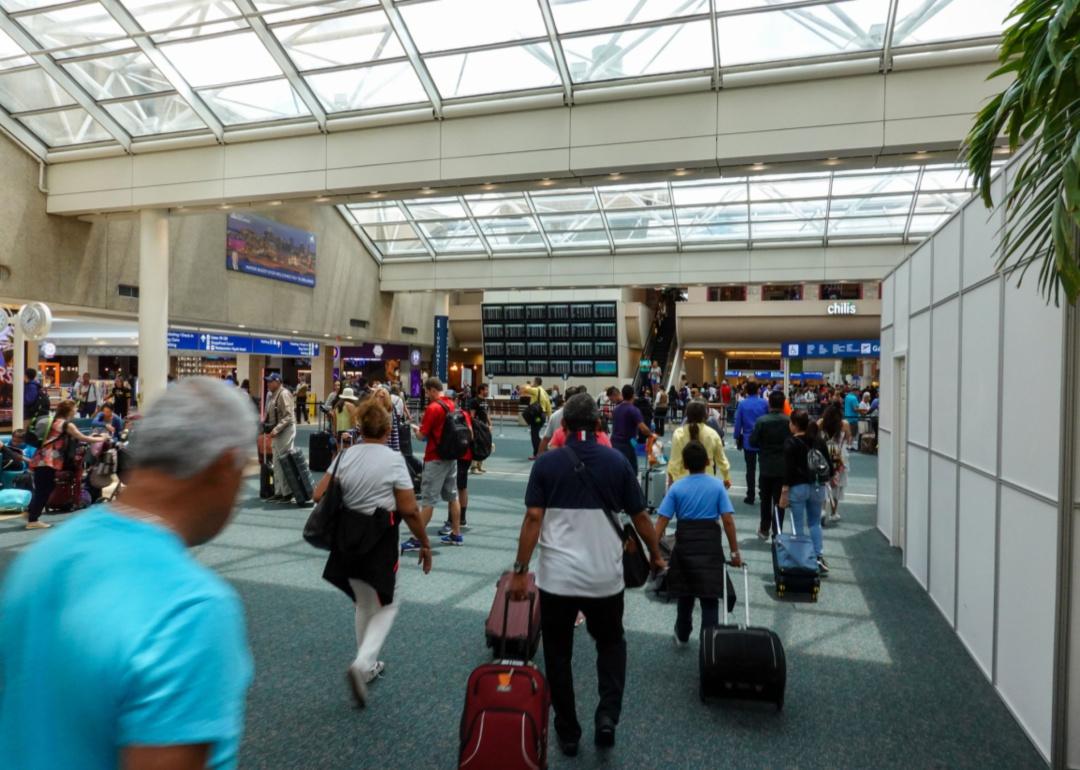
Some airports are better at working these kinks out before you make it through the security checkpoint than others. The Bureau of Transportation Statistics collects data on where and why flights are taking off and arriving late. Stacker analyzed the data collected from August 2021 to July 2022 at the 241 U.S. airports with more than 1,000 flights a year to find those with the most delays. Airports are ranked by on-time performance, referring to flights that weren’t canceled, diverted, or delayed for 15 minutes or more. Percentages are further given for the causes of each delay.
Booking a flight for your upcoming holiday vacation? Read on to see which airports you might want to avoid if you want your trip to get started on time.
You may also like: Strange laws to be aware of in the most popular countries for tourists
![]()
Imageforge // Shutterstock
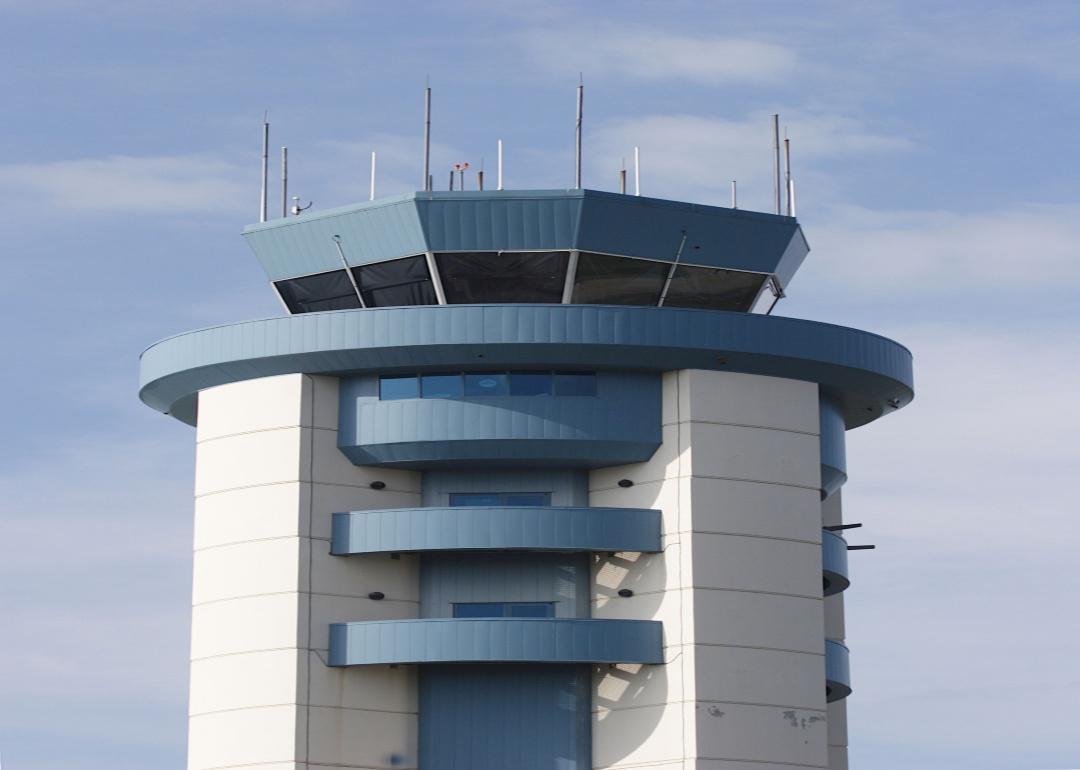
#100. Richmond, Virginia: Richmond International
A blue and white airport control tower.
– Annual flights (August 2021-July 2022): 18,746
– On-time performance: 76.64%
– Air carrier delay: 8.8%
– Weather delay: 0.8%
– National Aviation System delay: 4.2%
– Security delay: 0.1%
– Aircraft arriving late delay: 6.5%
– Cancelled flights: 3.0%
– Diverted flights: 0.1%
Wasted Time R (talk) // Wikimedia Commons
#99. Little Rock, Arkansas: Bill and Hillary Clinton Nat Adams Field
The approach towards the control tower of an airport.
– Annual flights (August 2021-July 2022): 10,273
– On-time performance: 76.59%
– Air carrier delay: 9.8%
– Weather delay: 1.0%
– National Aviation System delay: 3.3%
– Security delay: 0.0%
– Aircraft arriving late delay: 7.0%
– Cancelled flights: 2.0%
– Diverted flights: 0.3%
Canva
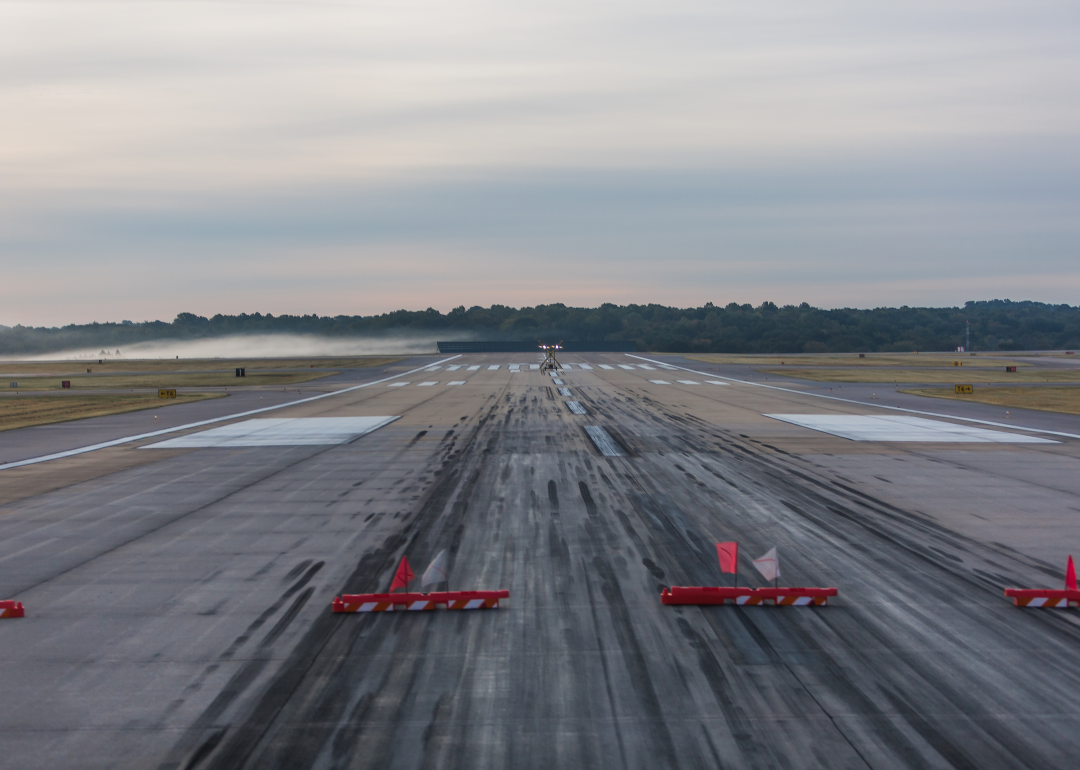
#98. Nashville, Tennessee: Nashville International
Nashville International Airport runway during morning fog.
– Annual flights (August 2021-July 2022): 84,727
– On-time performance: 76.54%
– Air carrier delay: 8.2%
– Weather delay: 0.5%
– National Aviation System delay: 3.7%
– Security delay: 0.1%
– Aircraft arriving late delay: 8.4%
– Cancelled flights: 2.5%
– Diverted flights: 0.1%
Lars Schmidt // Wikimedia Commons
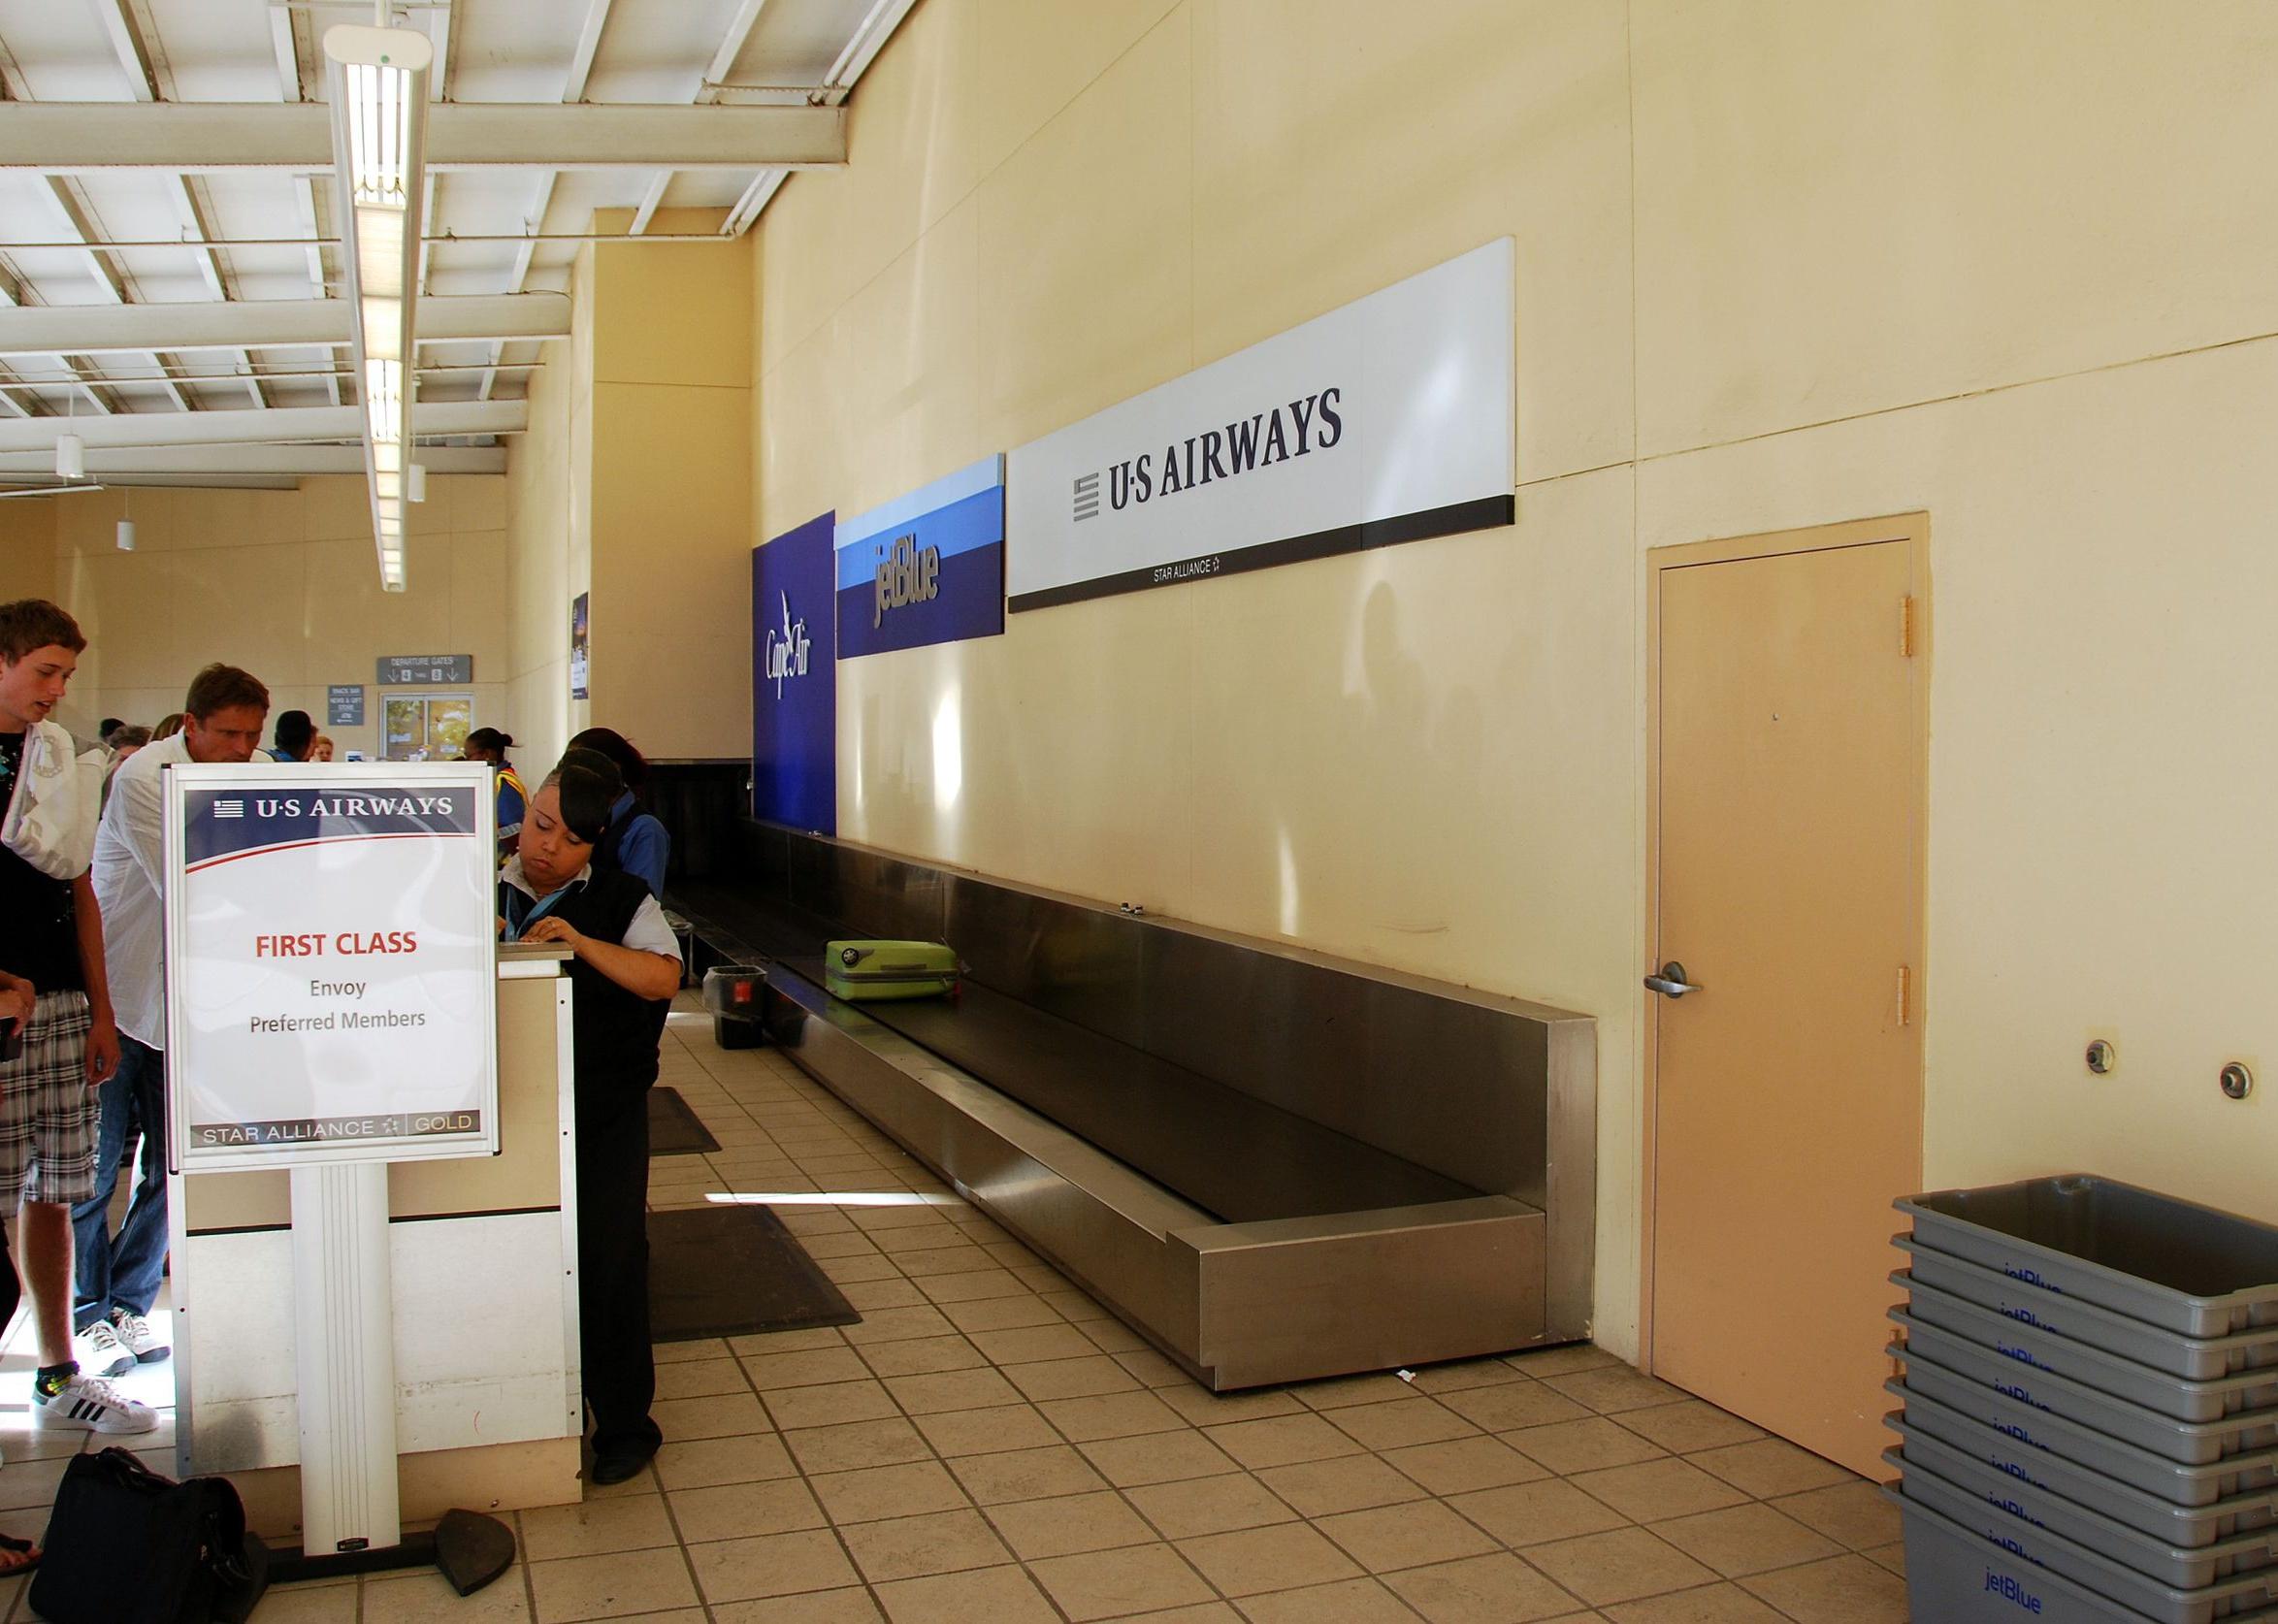
#97. Christiansted, Virgin Islands: Henry E. Rohlsen
People standing at a first class airport kiosk in a small airport.
– Annual flights (August 2021-July 2022): 1,226
– On-time performance: 76.51%
– Air carrier delay: 10.1%
– Weather delay: 1.1%
– National Aviation System delay: 6.4%
– Security delay: 0.3%
– Aircraft arriving late delay: 4.9%
– Cancelled flights: 0.7%
– Diverted flights: 0.0%
University of College // Shutterstock
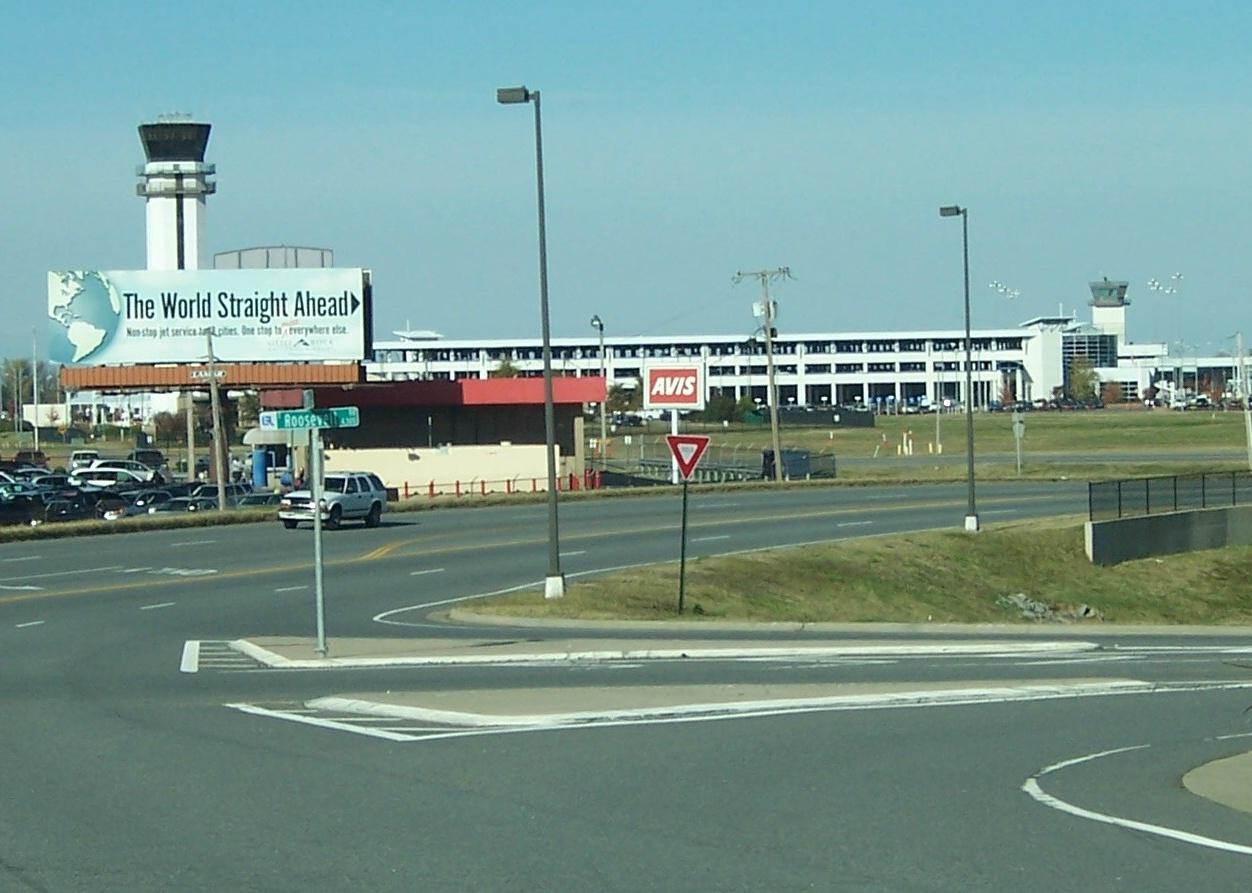
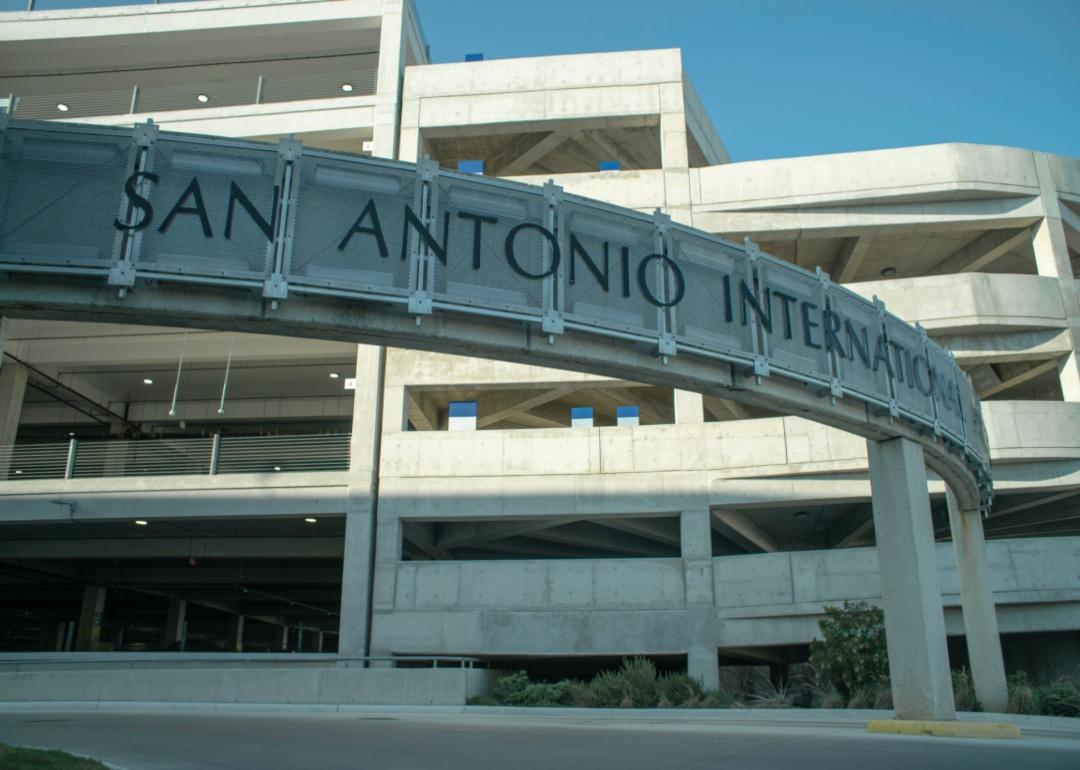
#96. San Antonio, Texas: San Antonio International
San Antonio International Airport sign in front of a concrete parking garage.
– Annual flights (August 2021-July 2022): 33,033
– On-time performance: 76.49%
– Air carrier delay: 9.8%
– Weather delay: 0.5%
– National Aviation System delay: 2.9%
– Security delay: 0.1%
– Aircraft arriving late delay: 8.1%
– Cancelled flights: 2.0%
– Diverted flights: 0.2%
You may also like: Oldest national parks in America
Wangkun Jia // Shutterstock
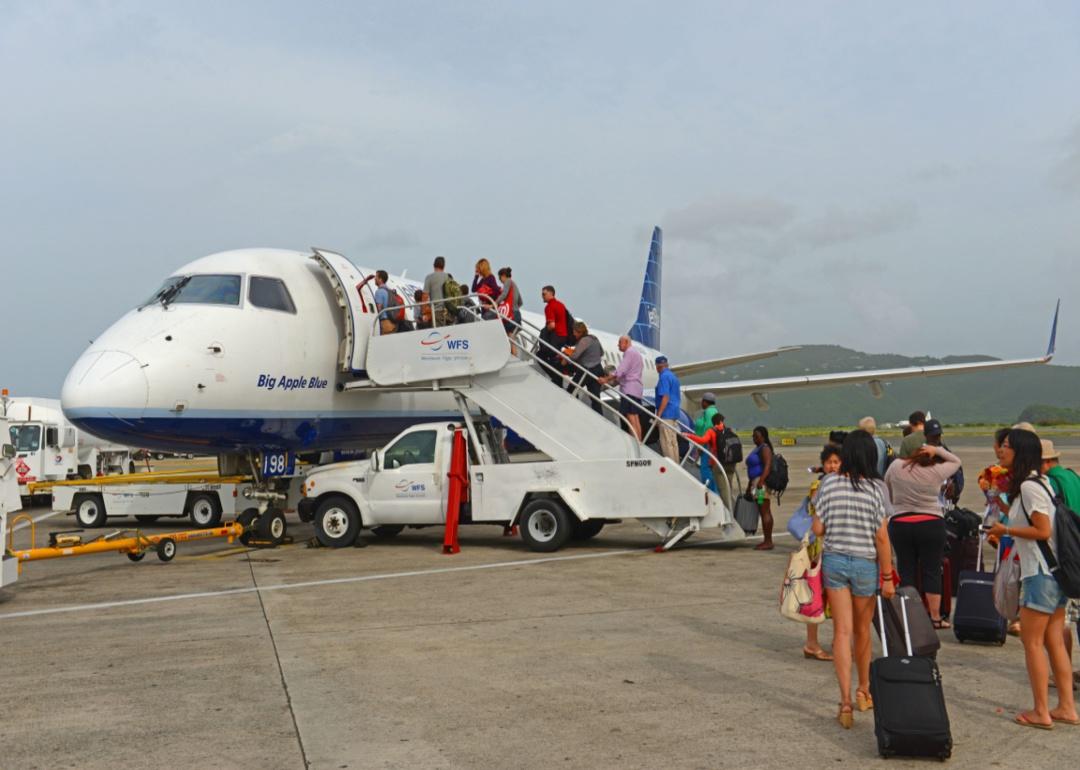
#95. Charlotte Amalie, Virgin Islands: Cyril E King
A long line of passengers on the tarmac waiting to board an airplane.
– Annual flights (August 2021-July 2022): 5,912
– On-time performance: 76.30%
– Air carrier delay: 9.0%
– Weather delay: 0.5%
– National Aviation System delay: 9.0%
– Security delay: 0.1%
– Aircraft arriving late delay: 3.3%
– Cancelled flights: 1.4%
– Diverted flights: 0.3%
EQRoy // Shutterstock
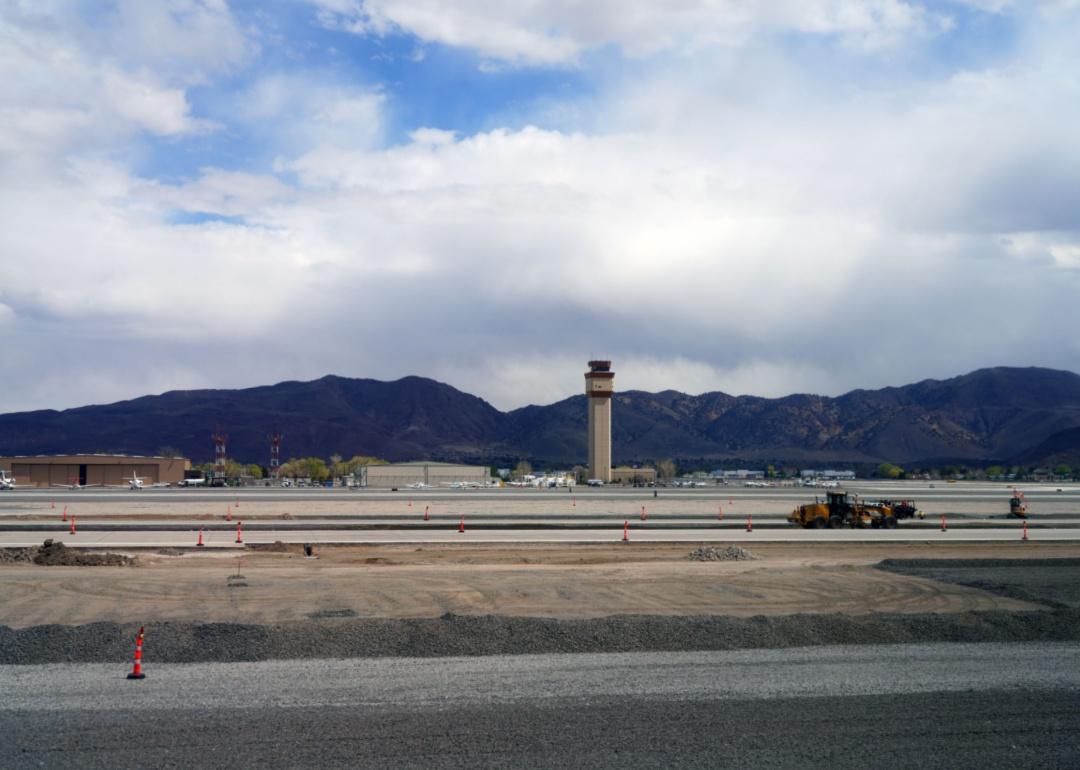
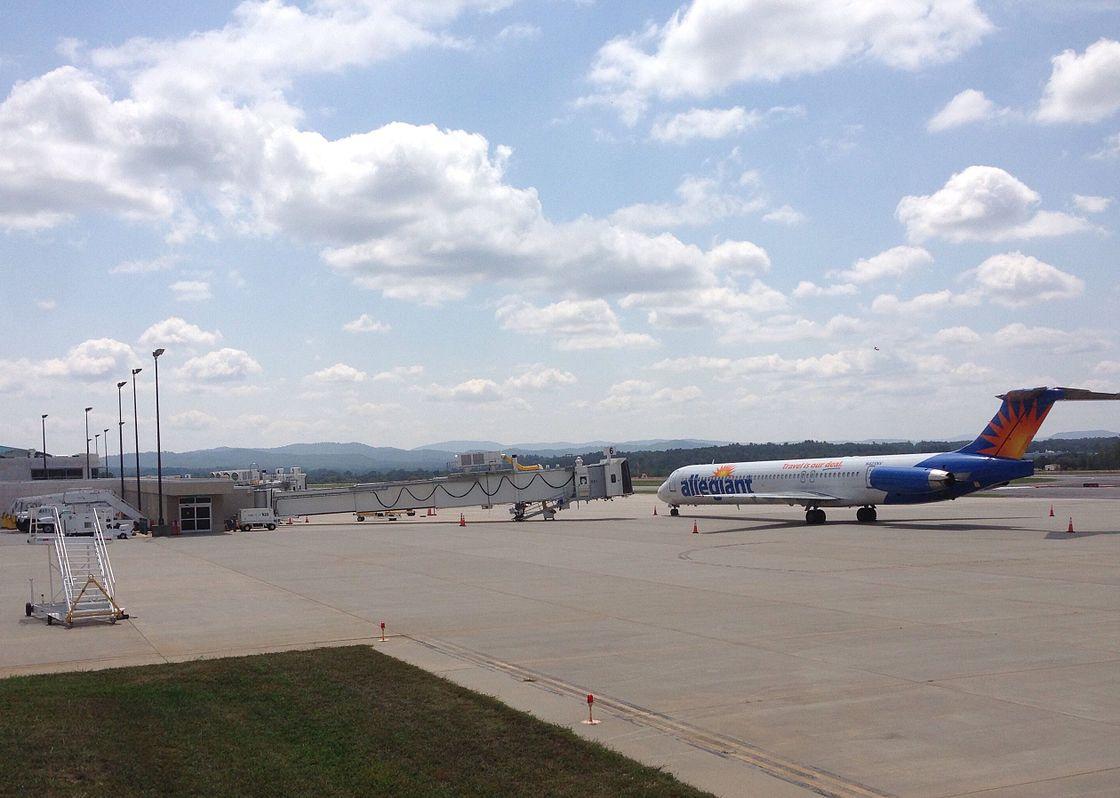
#94. Reno, Nevada: Reno/Tahoe International
The Reno-Tahoe Airport runway and tower with mountains in the background.
– Annual flights (August 2021-July 2022): 20,305
– On-time performance: 76.24%
– Air carrier delay: 9.7%
– Weather delay: 0.9%
– National Aviation System delay: 2.4%
– Security delay: 0.0%
– Aircraft arriving late delay: 8.4%
– Cancelled flights: 1.8%
– Diverted flights: 0.3%
EQRoy // Shutterstock
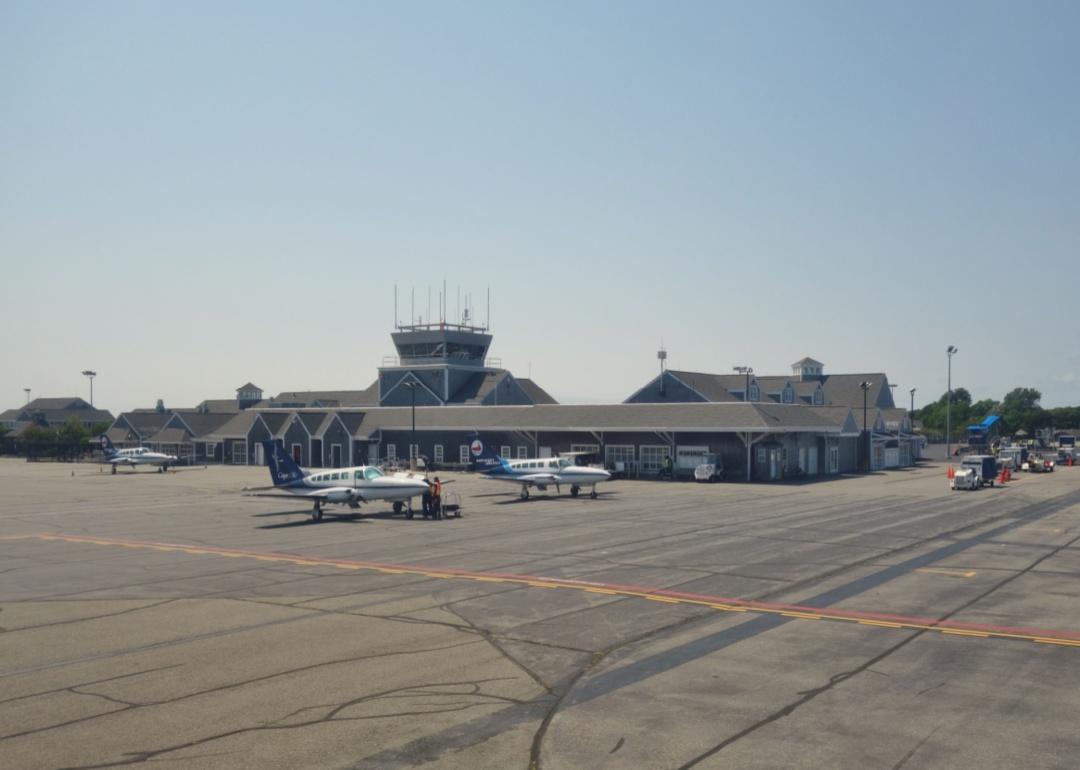
#93. Nantucket, Massachusetts: Nantucket Memorial
The small Nantucket Memorial airport and private planes.
– Annual flights (August 2021-July 2022): 1,531
– On-time performance: 76.22%
– Air carrier delay: 8.1%
– Weather delay: 1.5%
– National Aviation System delay: 4.8%
– Security delay: 0.0%
– Aircraft arriving late delay: 5.0%
– Cancelled flights: 3.7%
– Diverted flights: 0.7%
Spiffymartin // Wikimedia Commons
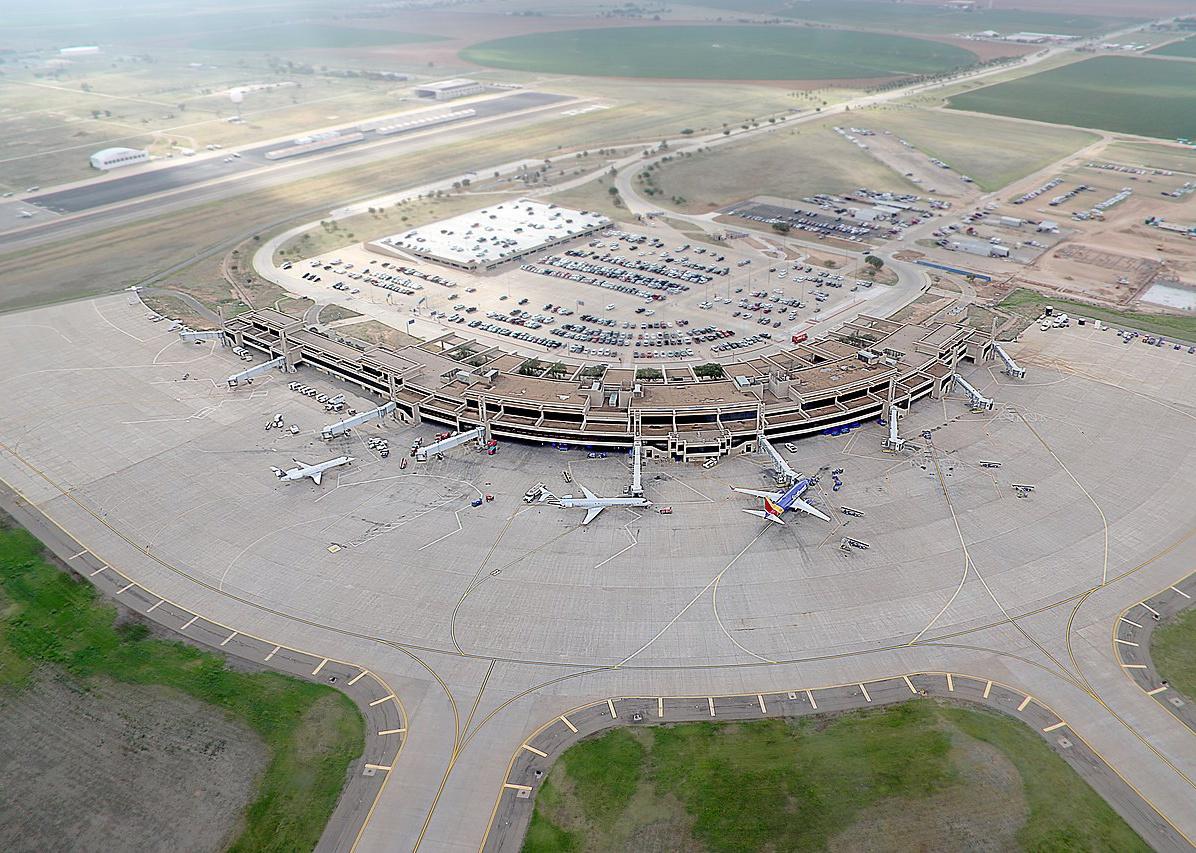
#92. Lubbock, Texas: Lubbock Preston Smith International
The Lubbock Preston Smith Airport from above.
– Annual flights (August 2021-July 2022): 5,679
– On-time performance: 76.18%
– Air carrier delay: 9.7%
– Weather delay: 0.6%
– National Aviation System delay: 1.4%
– Security delay: 0.1%
– Aircraft arriving late delay: 9.4%
– Cancelled flights: 2.4%
– Diverted flights: 0.2%
Logan Bush // Shutterstock
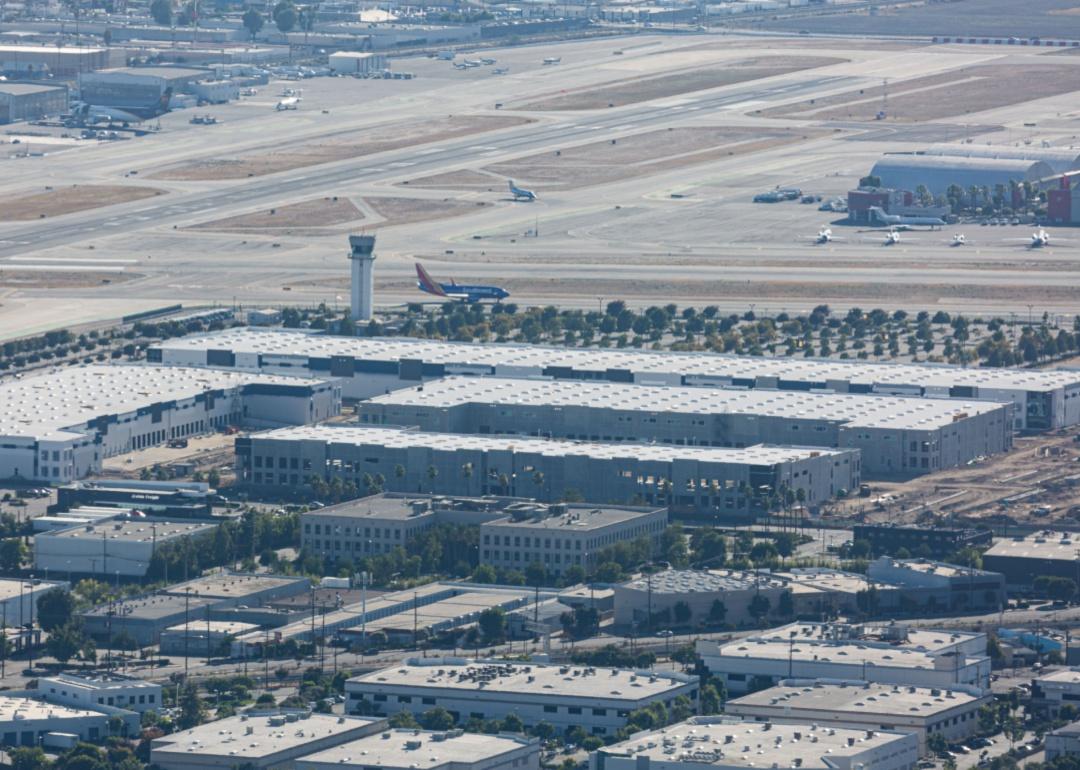
#91. Burbank, California: Bob Hope
An aerial view of buildings planes on the runway at Bob Hope Airport.
– Annual flights (August 2021-July 2022): 29,540
– On-time performance: 76.13%
– Air carrier delay: 7.6%
– Weather delay: 0.3%
– National Aviation System delay: 3.0%
– Security delay: 0.0%
– Aircraft arriving late delay: 9.5%
– Cancelled flights: 3.0%
– Diverted flights: 0.4%
You may also like: The busiest times of day for security checks at 10 major US airports
EQRoy // Shutterstock
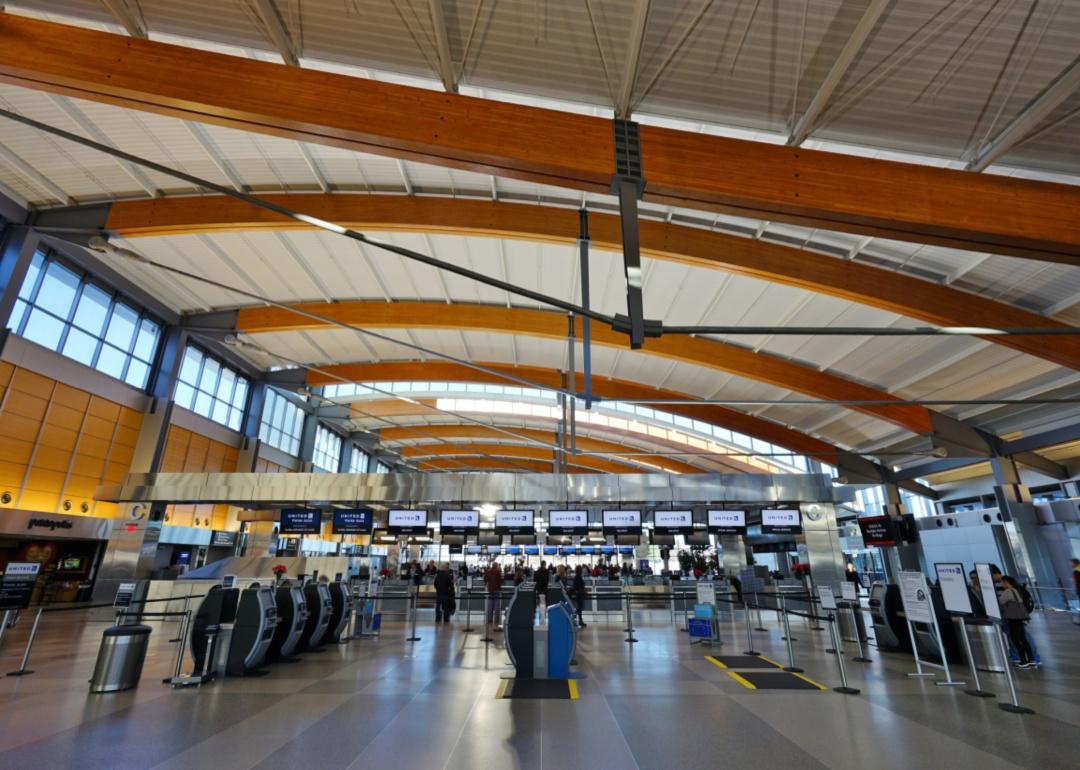
#90. Raleigh/Durham, North Carolina: Raleigh-Durham International
People waiting to check in for flights at the airport.
– Annual flights (August 2021-July 2022): 52,971
– On-time performance: 76.11%
– Air carrier delay: 8.8%
– Weather delay: 0.6%
– National Aviation System delay: 4.3%
– Security delay: 0.1%
– Aircraft arriving late delay: 7.1%
– Cancelled flights: 2.8%
– Diverted flights: 0.2%
2p2play // Shutterstock
#89. Boston, Massachusetts: Logan International
Logan International Airport crowded with lines of people.
– Annual flights (August 2021-July 2022): 125,707
– On-time performance: 76.09%
– Air carrier delay: 8.1%
– Weather delay: 0.6%
– National Aviation System delay: 5.0%
– Security delay: 0.1%
– Aircraft arriving late delay: 6.7%
– Cancelled flights: 3.3%
– Diverted flights: 0.1%
Jeffrey Beall // Wikimedia Commons
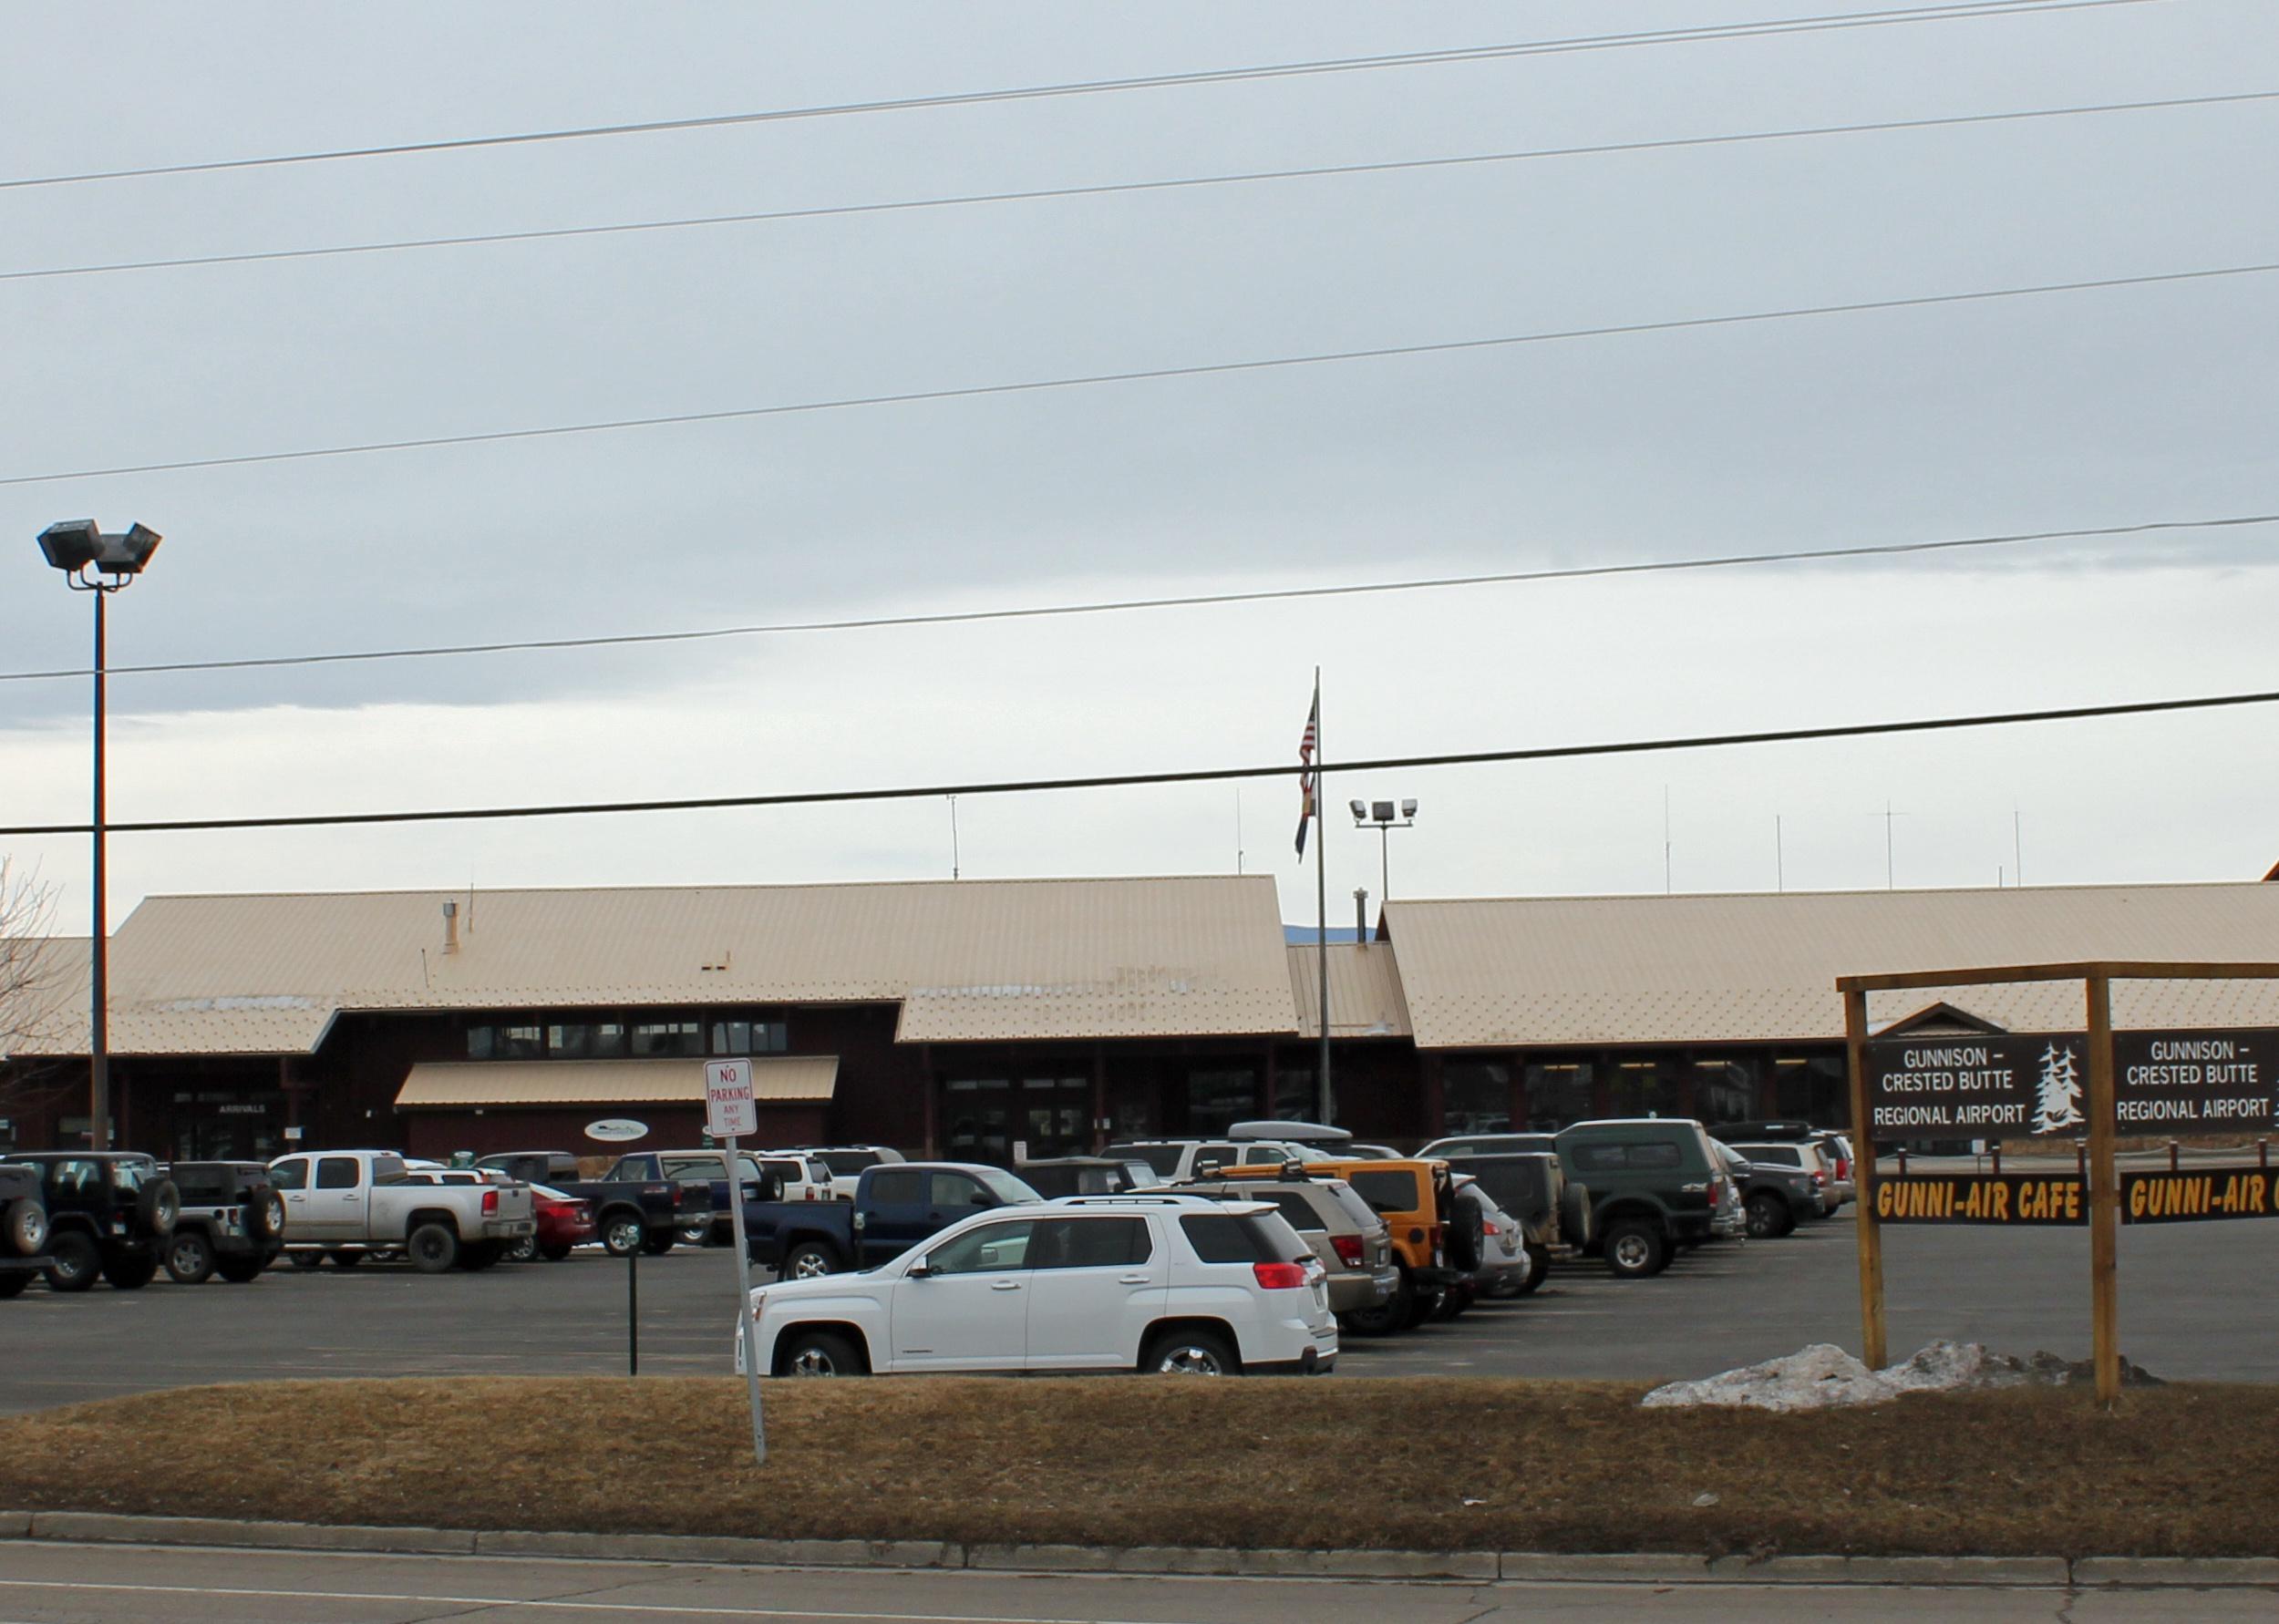
#88. Gunnison, Colorado: Gunnison-Crested Butte Regional
Small brown buildings at the Gunnison-Crested Butte airport surrounded by snowy mountains.
– Annual flights (August 2021-July 2022): 1,015
– On-time performance: 76.06%
– Air carrier delay: 12.6%
– Weather delay: 0.6%
– National Aviation System delay: 0.3%
– Security delay: 0.0%
– Aircraft arriving late delay: 5.2%
– Cancelled flights: 4.5%
– Diverted flights: 0.7%
United States Geological Survey // Wikimedia Commons
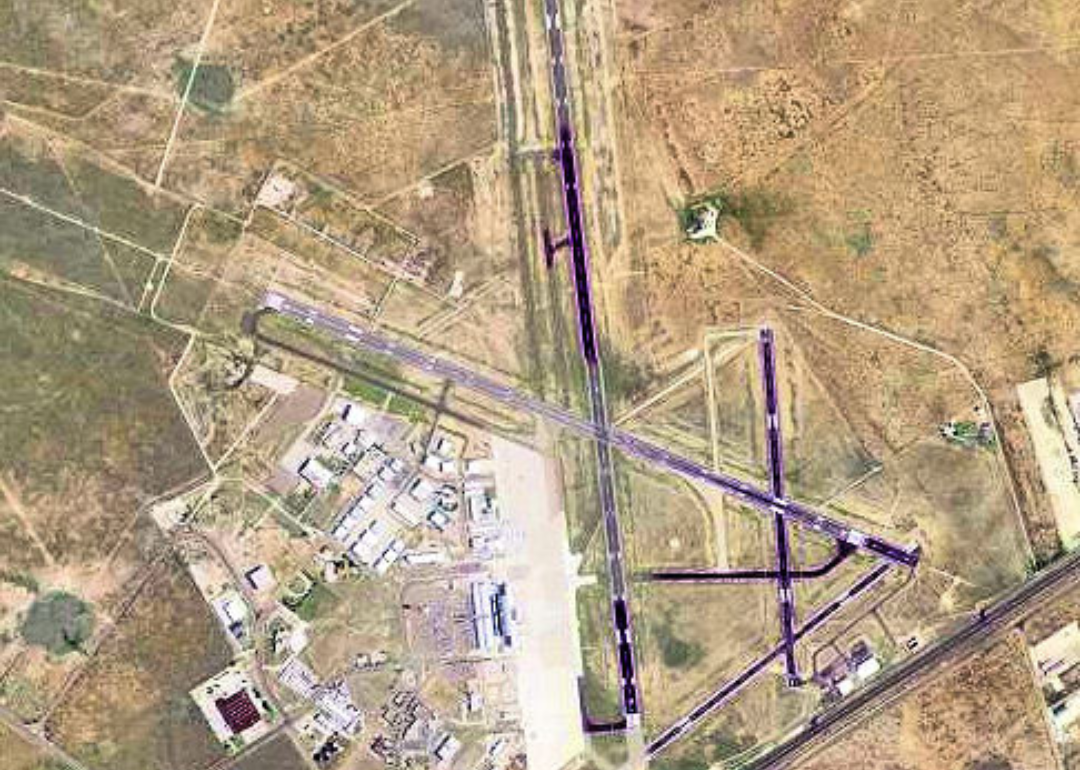
#87. Midland/Odessa, Texas: Midland International Air and Space Port
An airport from above.
– Annual flights (August 2021-July 2022): 8,542
– On-time performance: 76.02%
– Air carrier delay: 10.0%
– Weather delay: 0.6%
– National Aviation System delay: 2.1%
– Security delay: 0.1%
– Aircraft arriving late delay: 8.5%
– Cancelled flights: 2.5%
– Diverted flights: 0.2%
EQRoy // Shutterstock
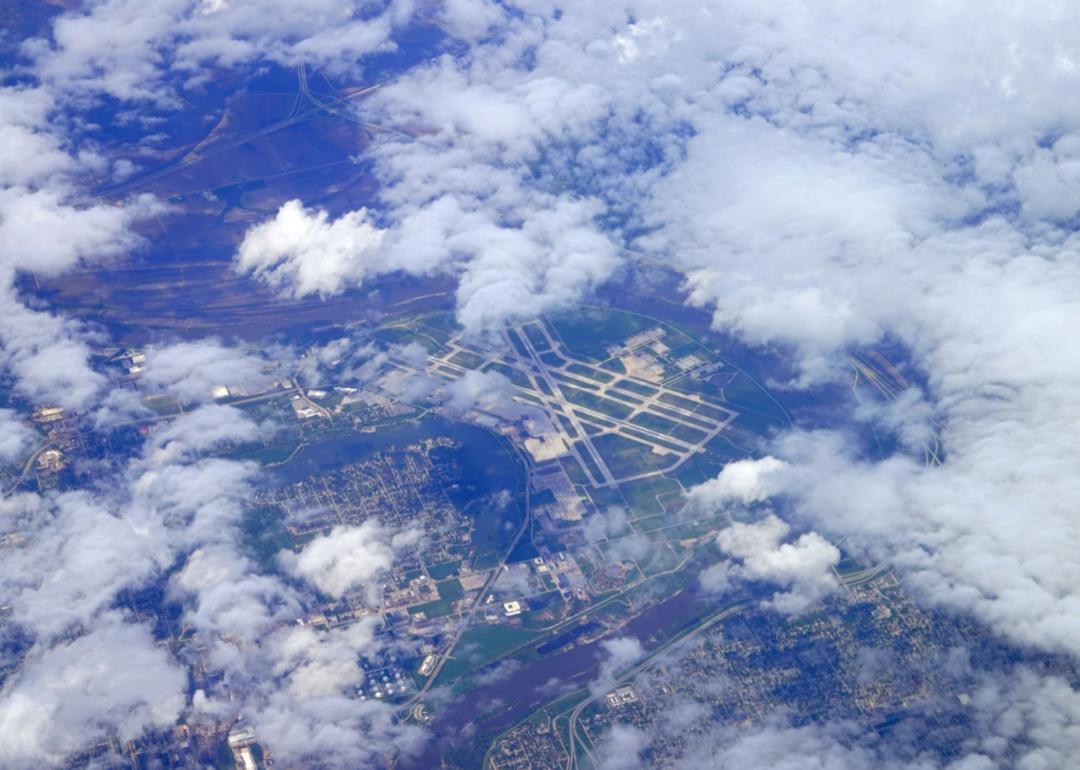
#86. Omaha, Nebraska: Eppley Airfield
Eppley Airfield from above the clouds.
– Annual flights (August 2021-July 2022): 21,953
– On-time performance: 76.00%
– Air carrier delay: 10.6%
– Weather delay: 1.1%
– National Aviation System delay: 2.9%
– Security delay: 0.0%
– Aircraft arriving late delay: 7.3%
– Cancelled flights: 1.9%
– Diverted flights: 0.2%
You may also like: Most walk-friendly cities in America

Christopher S. Berglund // Shutterstock
#85. Pensacola, Florida: Pensacola International
A walkway with a white chain hand rail at Pensacola Airport.
– Annual flights (August 2021-July 2022): 11,994
– On-time performance: 75.98%
– Air carrier delay: 9.0%
– Weather delay: 0.8%
– National Aviation System delay: 4.4%
– Security delay: 0.1%
– Aircraft arriving late delay: 7.1%
– Cancelled flights: 2.4%
– Diverted flights: 0.2%
Joaquin Ossorio Castillo // Shutterstock
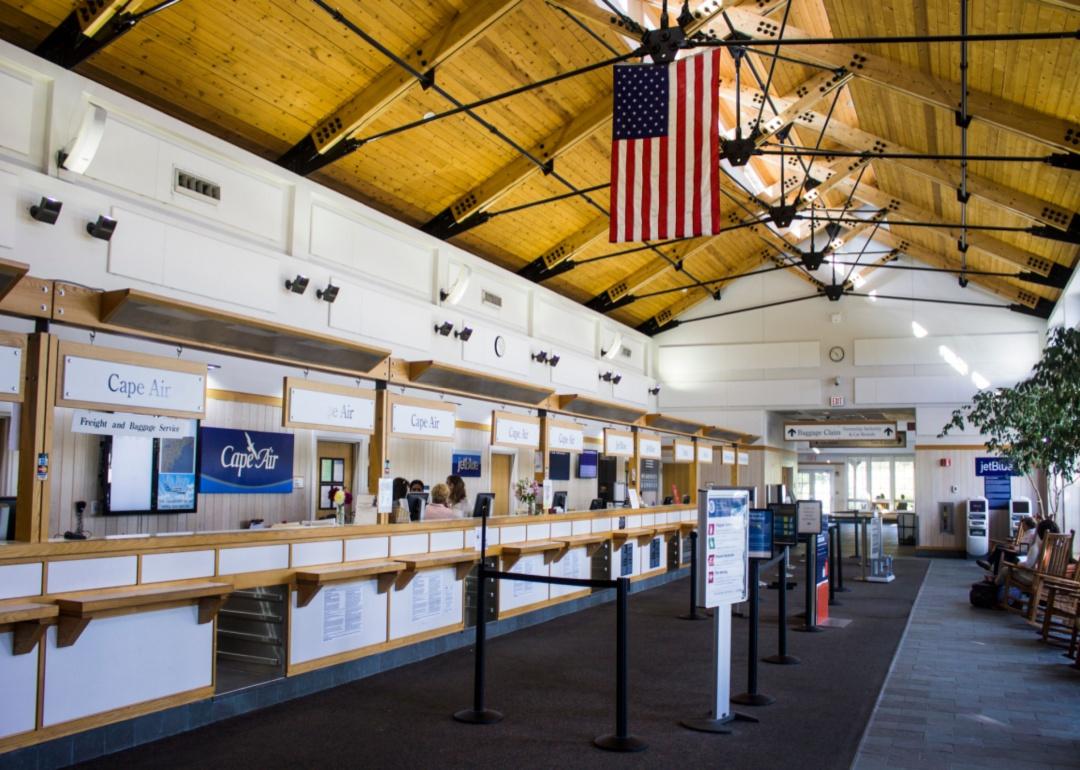
#84. Martha’s Vineyard, Massachusetts: Martha’s Vineyard Airport
Air check-in kiosks at a small airport.
– Annual flights (August 2021-July 2022): 1,006
– On-time performance: 75.94%
– Air carrier delay: 10.3%
– Weather delay: 0.2%
– National Aviation System delay: 3.1%
– Security delay: 0.1%
– Aircraft arriving late delay: 6.4%
– Cancelled flights: 3.5%
– Diverted flights: 0.4%
EQRoy // Shutterstock
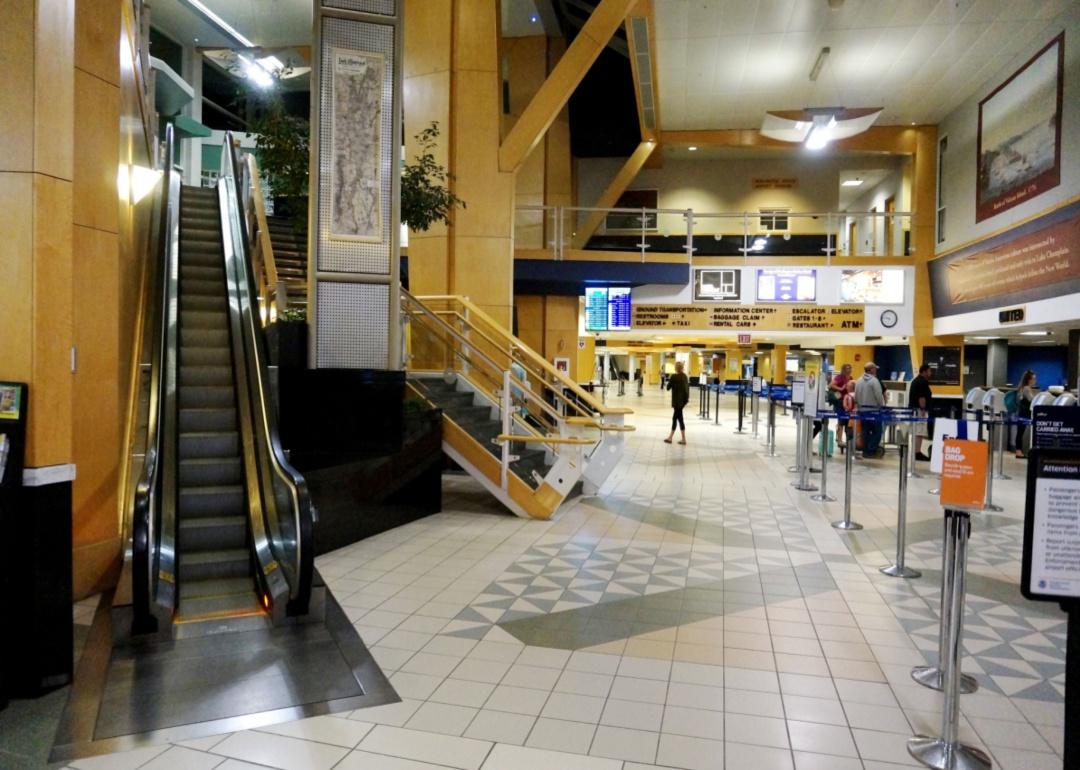
#83. Burlington, Vermont: Burlington International
A small terminal in Burlington, VT.
– Annual flights (August 2021-July 2022): 7,189
– On-time performance: 75.94%
– Air carrier delay: 8.6%
– Weather delay: 0.8%
– National Aviation System delay: 4.3%
– Security delay: 0.0%
– Aircraft arriving late delay: 6.2%
– Cancelled flights: 3.8%
– Diverted flights: 0.3%
Royalbroil // Wikimedia Commons
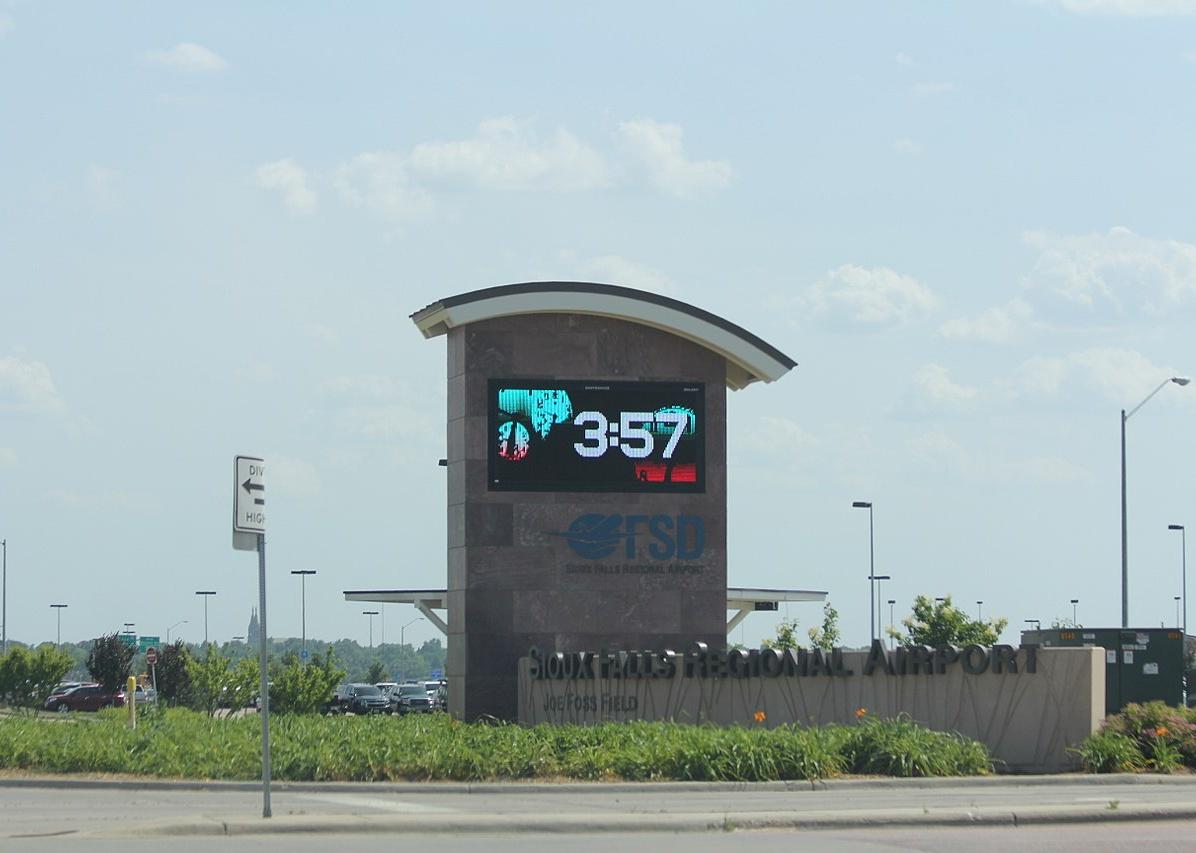
#82. Sioux Falls, South Dakota: Joe Foss Field
The entrance road and sign to Joe Foss Field.
– Annual flights (August 2021-July 2022): 7,694
– On-time performance: 75.90%
– Air carrier delay: 10.8%
– Weather delay: 1.0%
– National Aviation System delay: 4.1%
– Security delay: 0.1%
– Aircraft arriving late delay: 5.7%
– Cancelled flights: 1.9%
– Diverted flights: 0.5%
YVRA AD // Wikimedia Commons
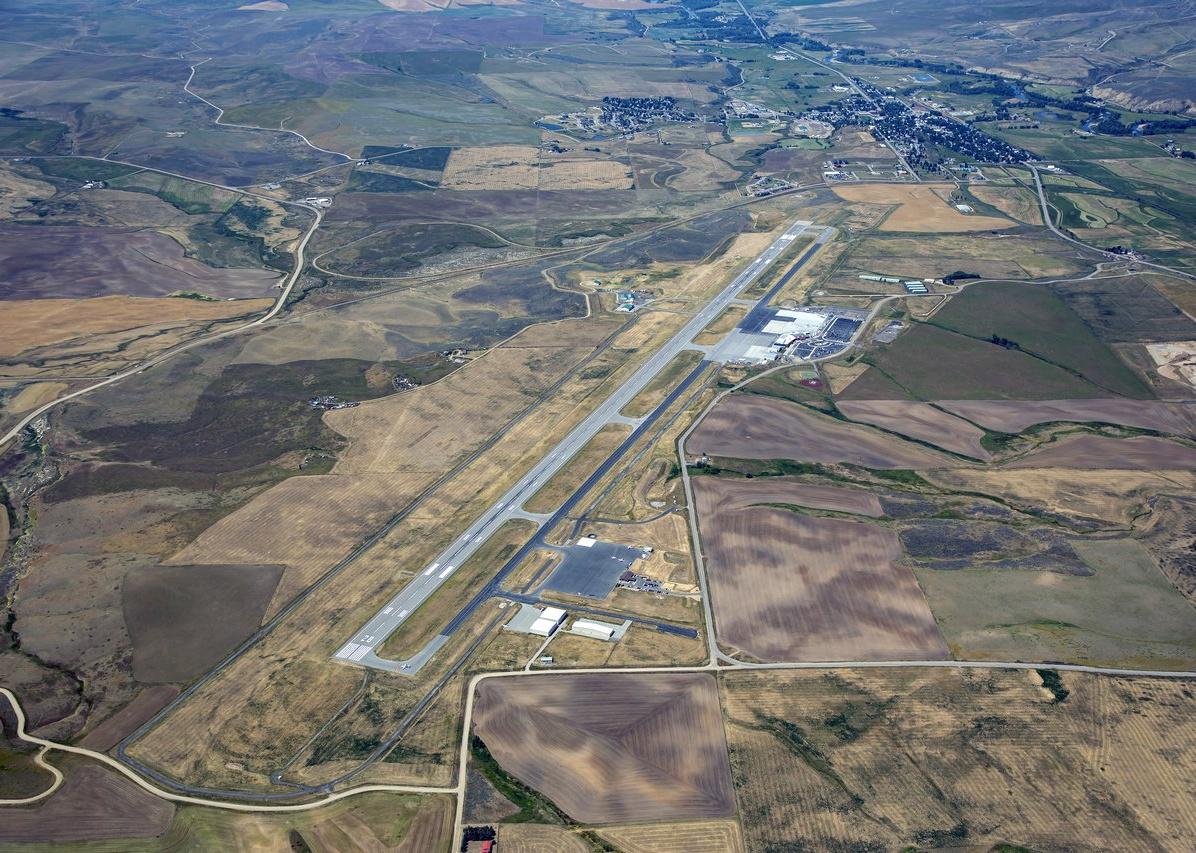
#81. Hayden, Colorado: Yampa Valley
Aerial view of Yampa Valley airport.
– Annual flights (August 2021-July 2022): 2,638
– On-time performance: 75.85%
– Air carrier delay: 11.7%
– Weather delay: 1.0%
– National Aviation System delay: 2.9%
– Security delay: 0.1%
– Aircraft arriving late delay: 5.3%
– Cancelled flights: 2.2%
– Diverted flights: 0.9%
You may also like: 20 tips for the ultimate road trip
United States Geological Survey // Wikimedia Commons
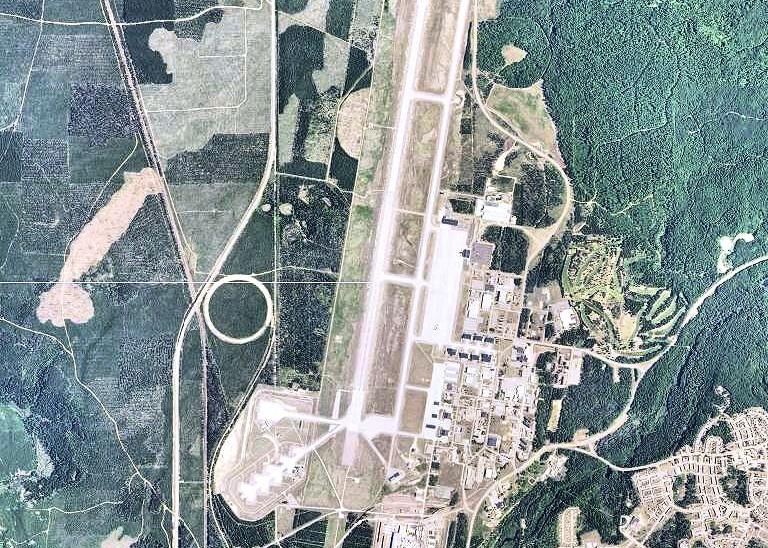
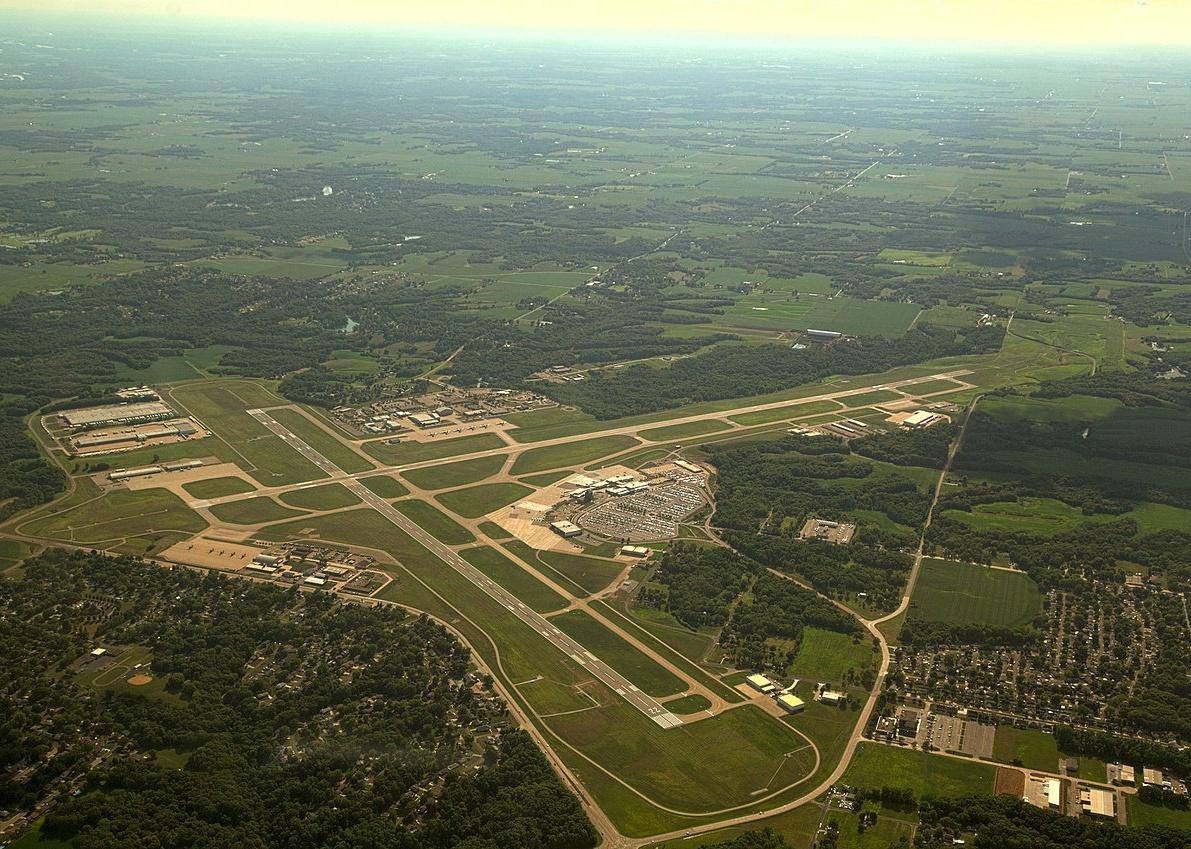
#80. Marquette, Michigan: Sawyer International
Digital orthophoto of Sawyer International Airport in Michigan.
– Annual flights (August 2021-July 2022): 1,408
– On-time performance: 75.85%
– Air carrier delay: 11.2%
– Weather delay: 4.9%
– National Aviation System delay: 2.0%
– Security delay: 0.0%
– Aircraft arriving late delay: 1.6%
– Cancelled flights: 3.9%
– Diverted flights: 0.6%
Sean Pavone // Shutterstock
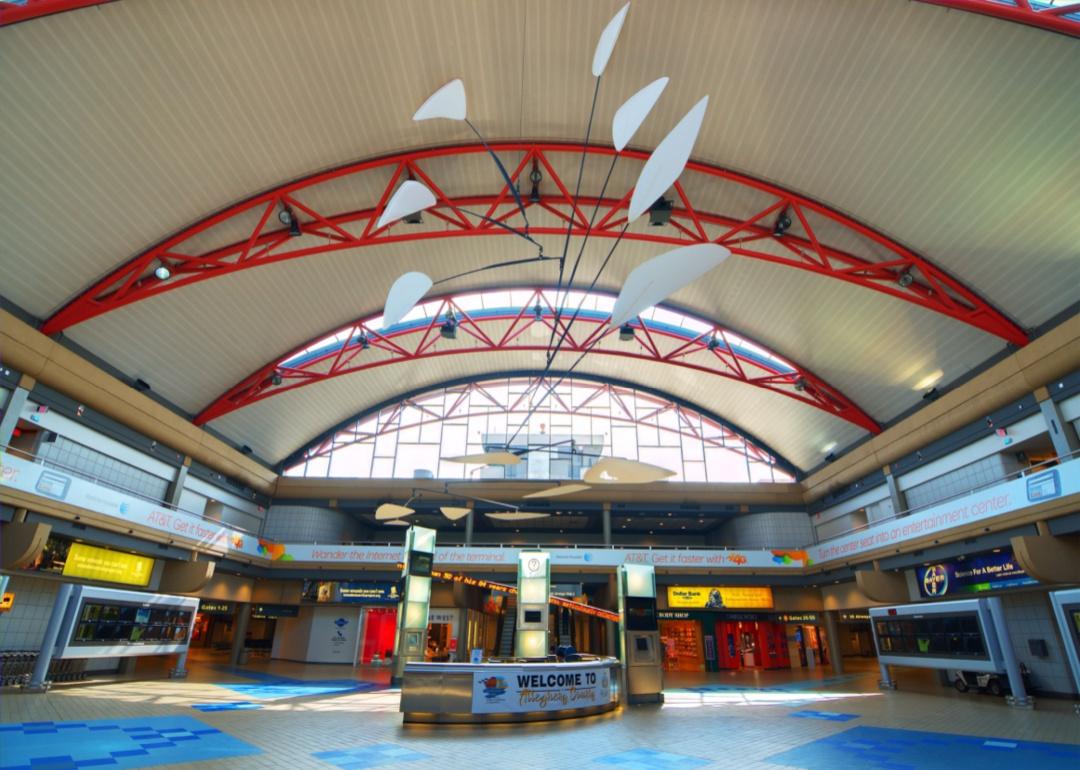
#79. Pittsburgh, Pennsylvania: Pittsburgh International
A large atrium with red arches in Pittsburgh airport.
– Annual flights (August 2021-July 2022): 40,255
– On-time performance: 75.77%
– Air carrier delay: 8.7%
– Weather delay: 0.8%
– National Aviation System delay: 3.9%
– Security delay: 0.1%
– Aircraft arriving late delay: 7.7%
– Cancelled flights: 2.9%
– Diverted flights: 0.1%
EQRoy // Shutterstock
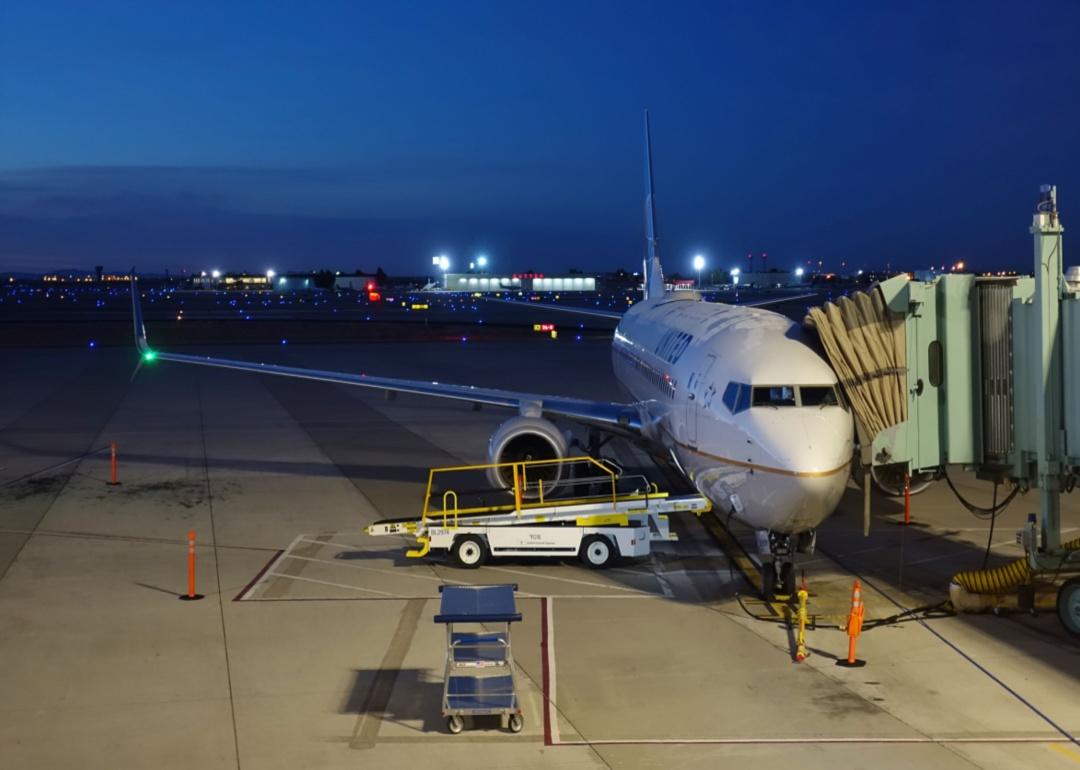
#78. Albuquerque, New Mexico: Albuquerque International Sunport
An airplane hooked to a terminal at Albuquerque airport.
– Annual flights (August 2021-July 2022): 19,775
– On-time performance: 75.73%
– Air carrier delay: 10.8%
– Weather delay: 0.9%
– National Aviation System delay: 2.1%
– Security delay: 0.0%
– Aircraft arriving late delay: 8.6%
– Cancelled flights: 1.6%
– Diverted flights: 0.1%
Canva
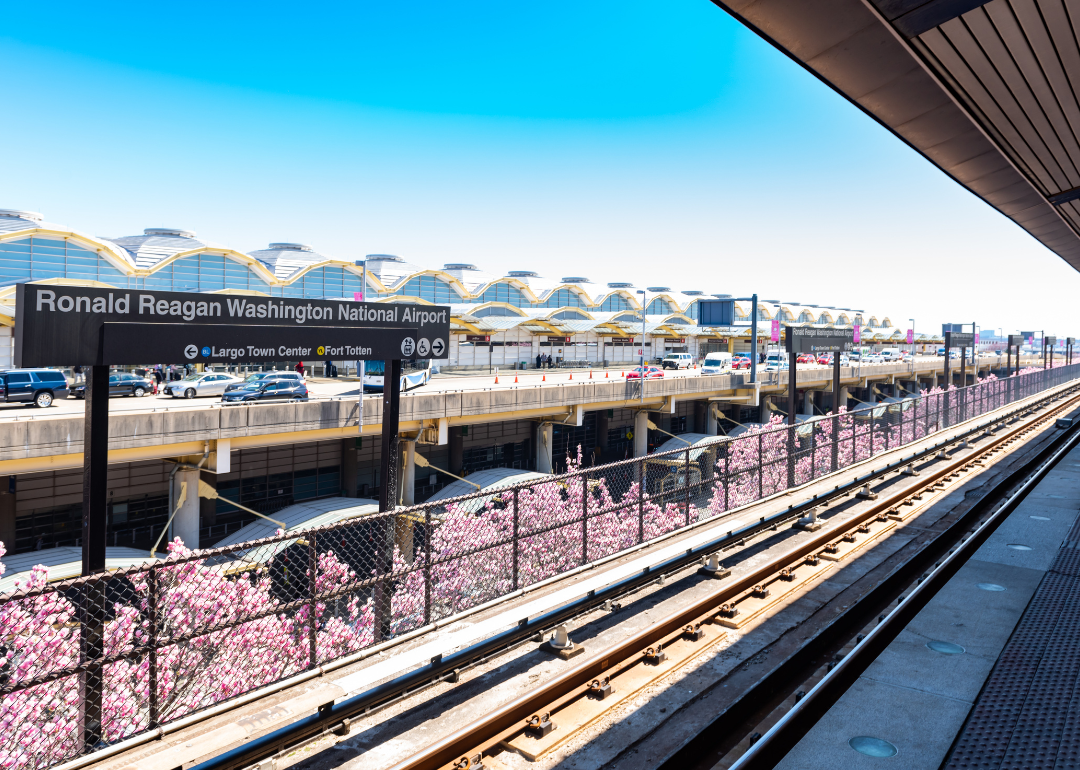
#77. Washington DC: Ronald Reagan Washington National
Metro station and cherry blossoms at Ronald Reagan Washington National.
– Annual flights (August 2021-July 2022): 129,120
– On-time performance: 75.70%
– Air carrier delay: 6.1%
– Weather delay: 0.6%
– National Aviation System delay: 6.1%
– Security delay: 0.1%
– Aircraft arriving late delay: 7.4%
– Cancelled flights: 3.7%
– Diverted flights: 0.3%
Joseph Creamer // Shutterstock
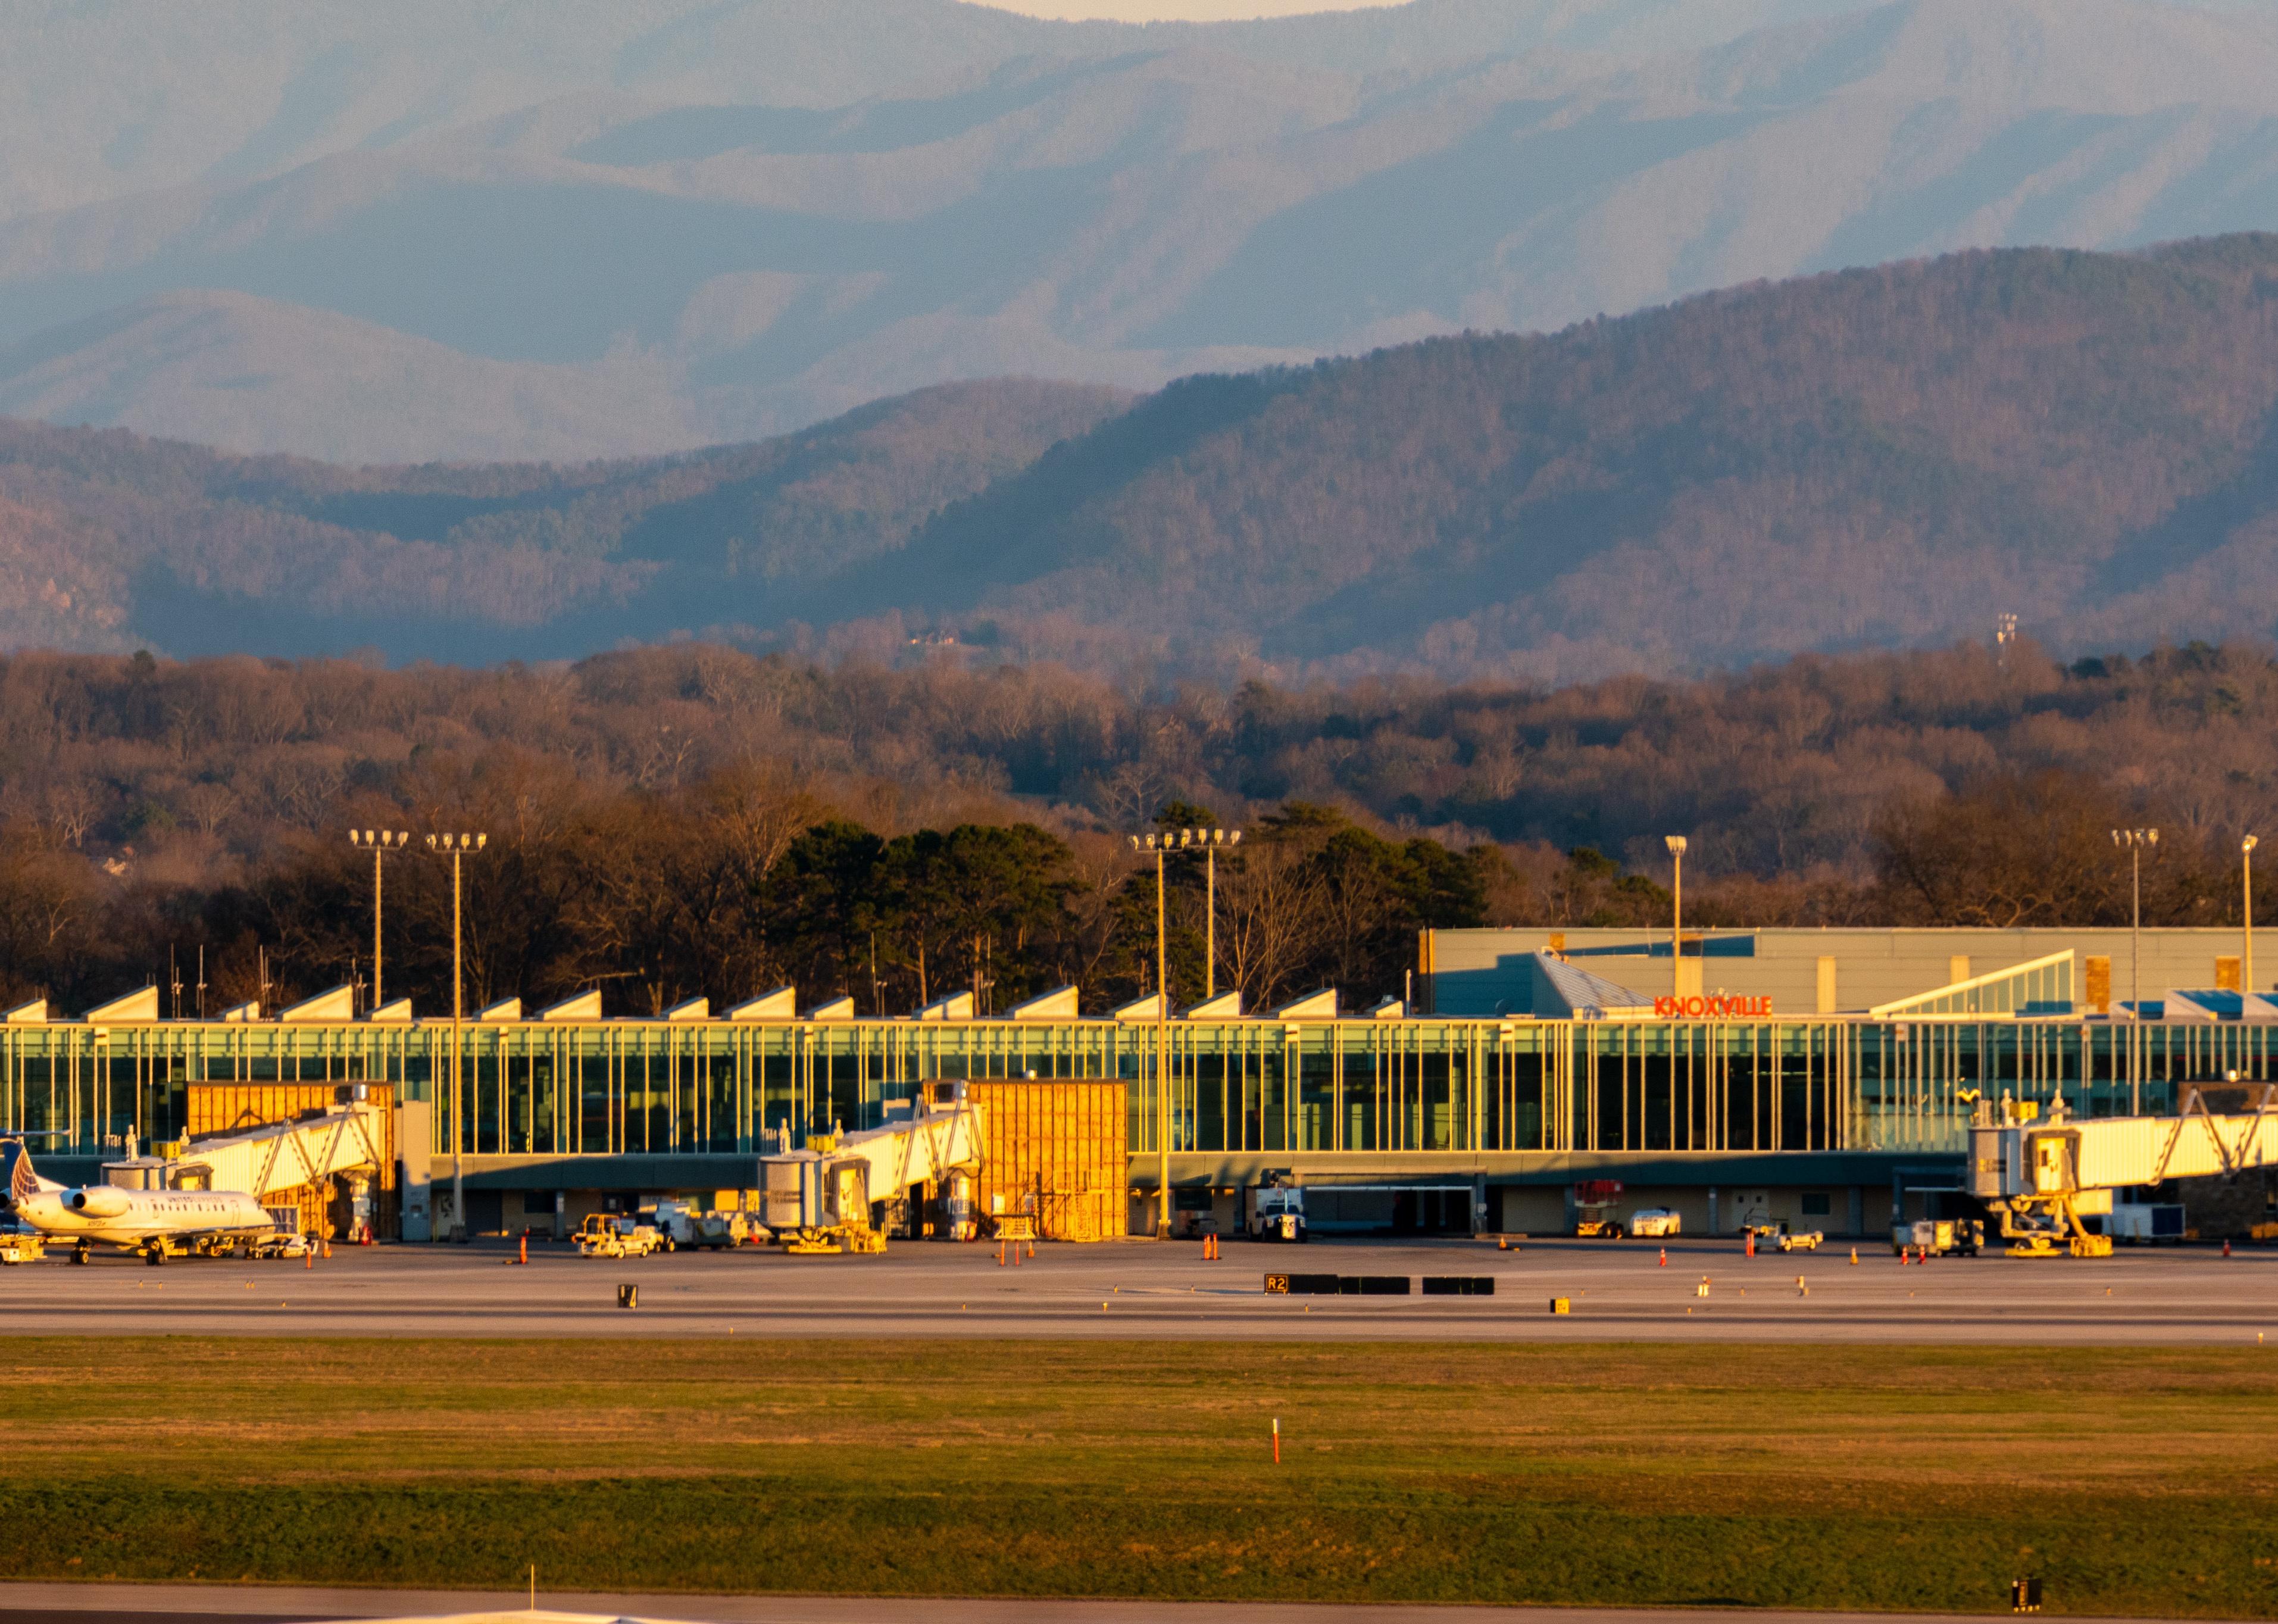
#76. Knoxville, Tennessee: McGhee Tyson
A panoramic view of the outside of McGhee Tyson airport.
– Annual flights (August 2021-July 2022): 13,006
– On-time performance: 75.70%
– Air carrier delay: 7.8%
– Weather delay: 1.0%
– National Aviation System delay: 5.0%
– Security delay: 0.0%
– Aircraft arriving late delay: 8.2%
– Cancelled flights: 2.2%
– Diverted flights: 0.2%
You may also like: Countries most dependent on tourism
Lost_in_the_Midwest // Shutterstock
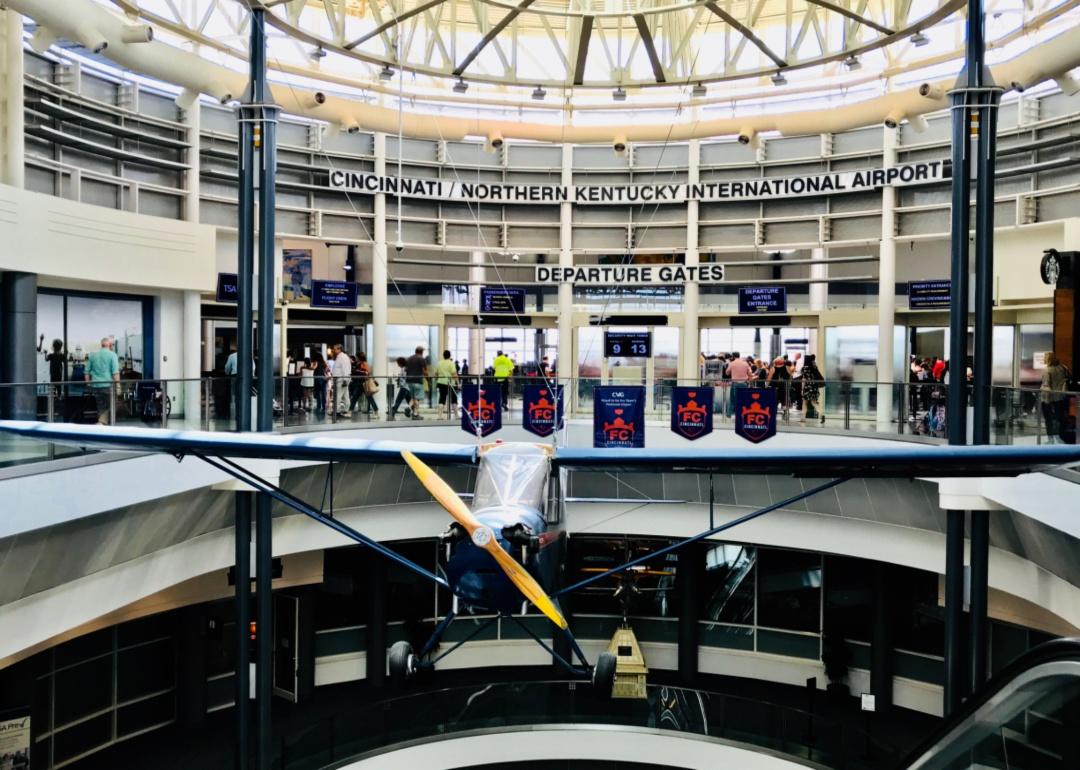
#75. Cincinnati, Ohio: Cincinnati/Northern Kentucky International
An airport atrium with a plane hanging from the ceiling.
– Annual flights (August 2021-July 2022): 36,681
– On-time performance: 75.70%
– Air carrier delay: 7.6%
– Weather delay: 0.7%
– National Aviation System delay: 5.2%
– Security delay: 0.0%
– Aircraft arriving late delay: 8.1%
– Cancelled flights: 2.6%
– Diverted flights: 0.1%
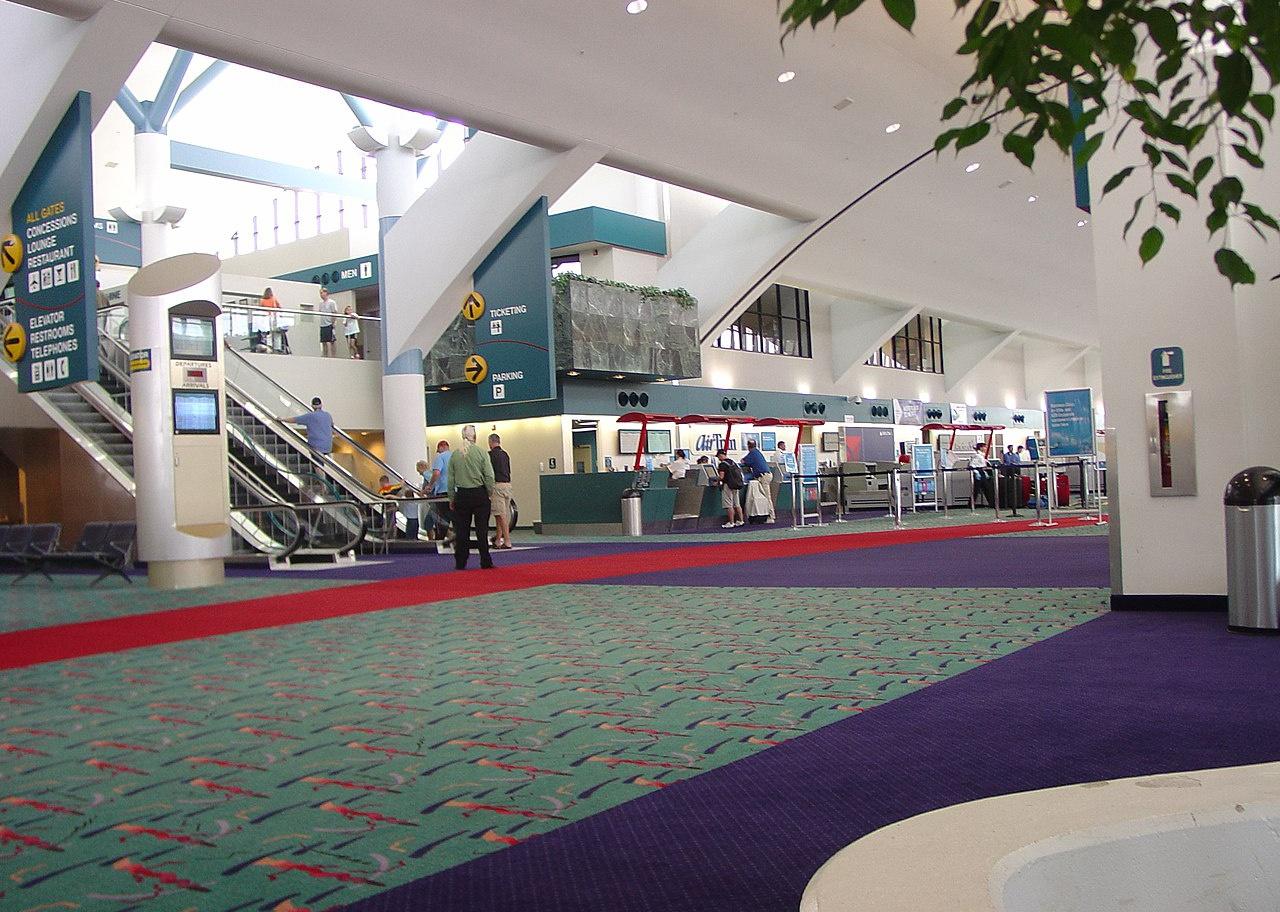
BUI LE MANH HUNG // Shutterstock
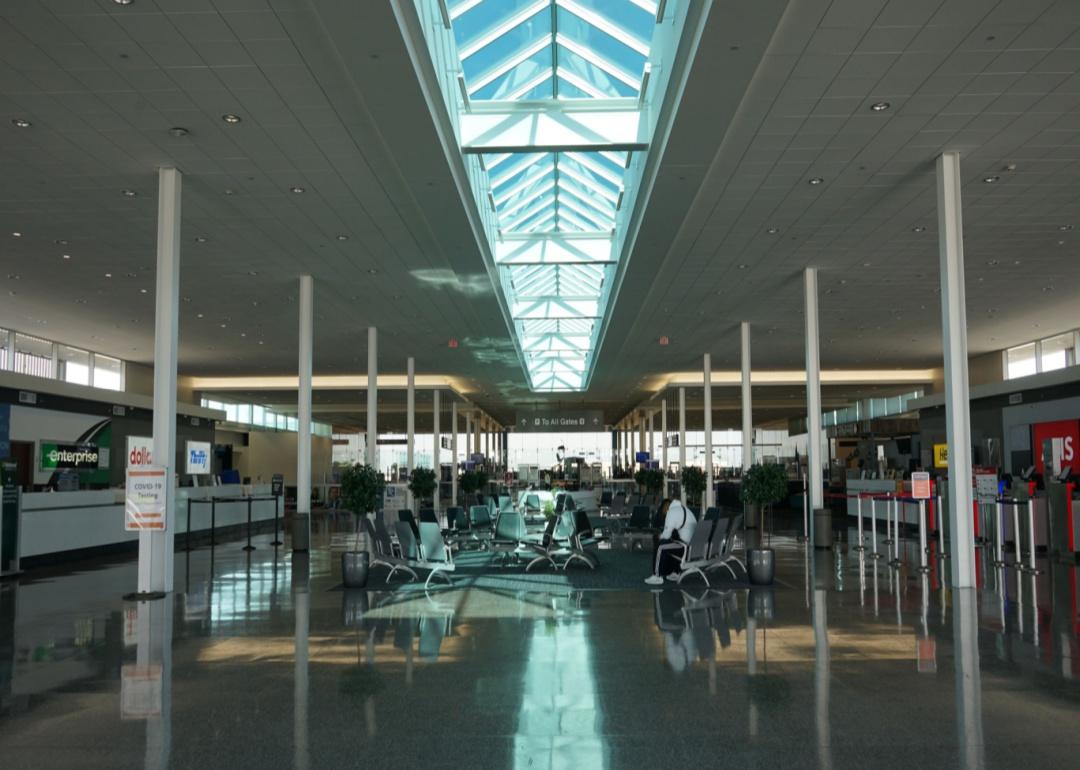
#74. Tulsa, Oklahoma: Tulsa International
The interior of the Tulsa International airport near rental kiosks with a long skylight in the ceiling.
– Annual flights (August 2021-July 2022): 14,618
– On-time performance: 75.69%
– Air carrier delay: 10.6%
– Weather delay: 0.7%
– National Aviation System delay: 2.0%
– Security delay: 0.1%
– Aircraft arriving late delay: 8.3%
– Cancelled flights: 2.5%
– Diverted flights: 0.2%
United States Geological Survey // Wikimedia Commons
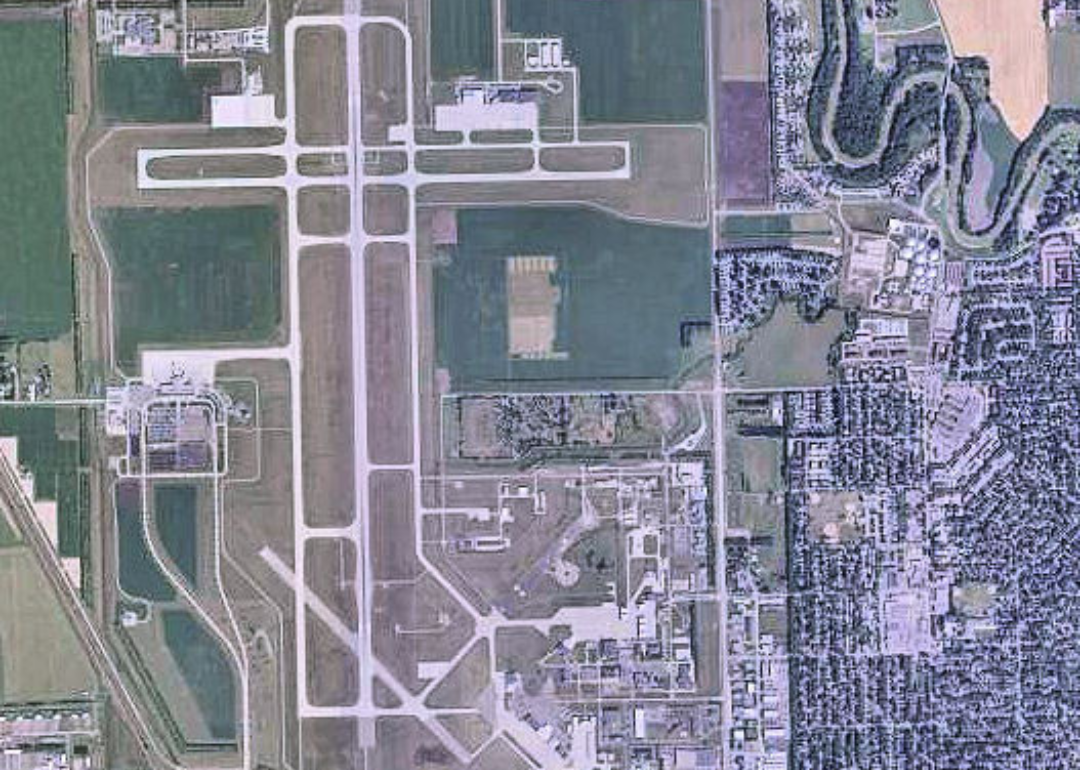
#73. Fargo, North Dakota: Hector International
Digital orthophoto of Hector International.
– Annual flights (August 2021-July 2022): 6,133
– On-time performance: 75.67%
– Air carrier delay: 12.4%
– Weather delay: 1.7%
– National Aviation System delay: 2.5%
– Security delay: 0.1%
– Aircraft arriving late delay: 4.4%
– Cancelled flights: 3.1%
– Diverted flights: 0.2%
RaksyBH // Shutterstock
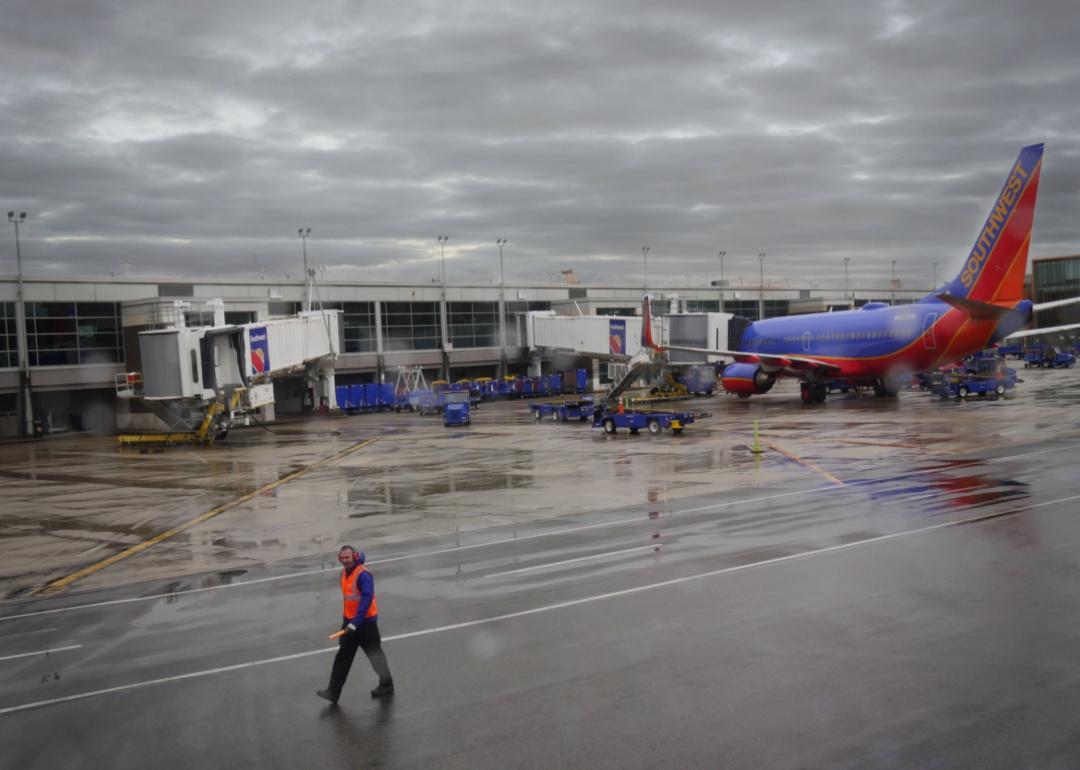
#72. Baltimore, Maryland: Baltimore/Washington International Thurgood Marshall
A rainy day on the tarmac with an airport worker near a Southwest jet.
– Annual flights (August 2021-July 2022): 83,238
– On-time performance: 75.63%
– Air carrier delay: 7.3%
– Weather delay: 0.4%
– National Aviation System delay: 4.4%
– Security delay: 0.1%
– Aircraft arriving late delay: 8.7%
– Cancelled flights: 3.3%
– Diverted flights: 0.1%
Michael Clevenger – Pool // Getty Images
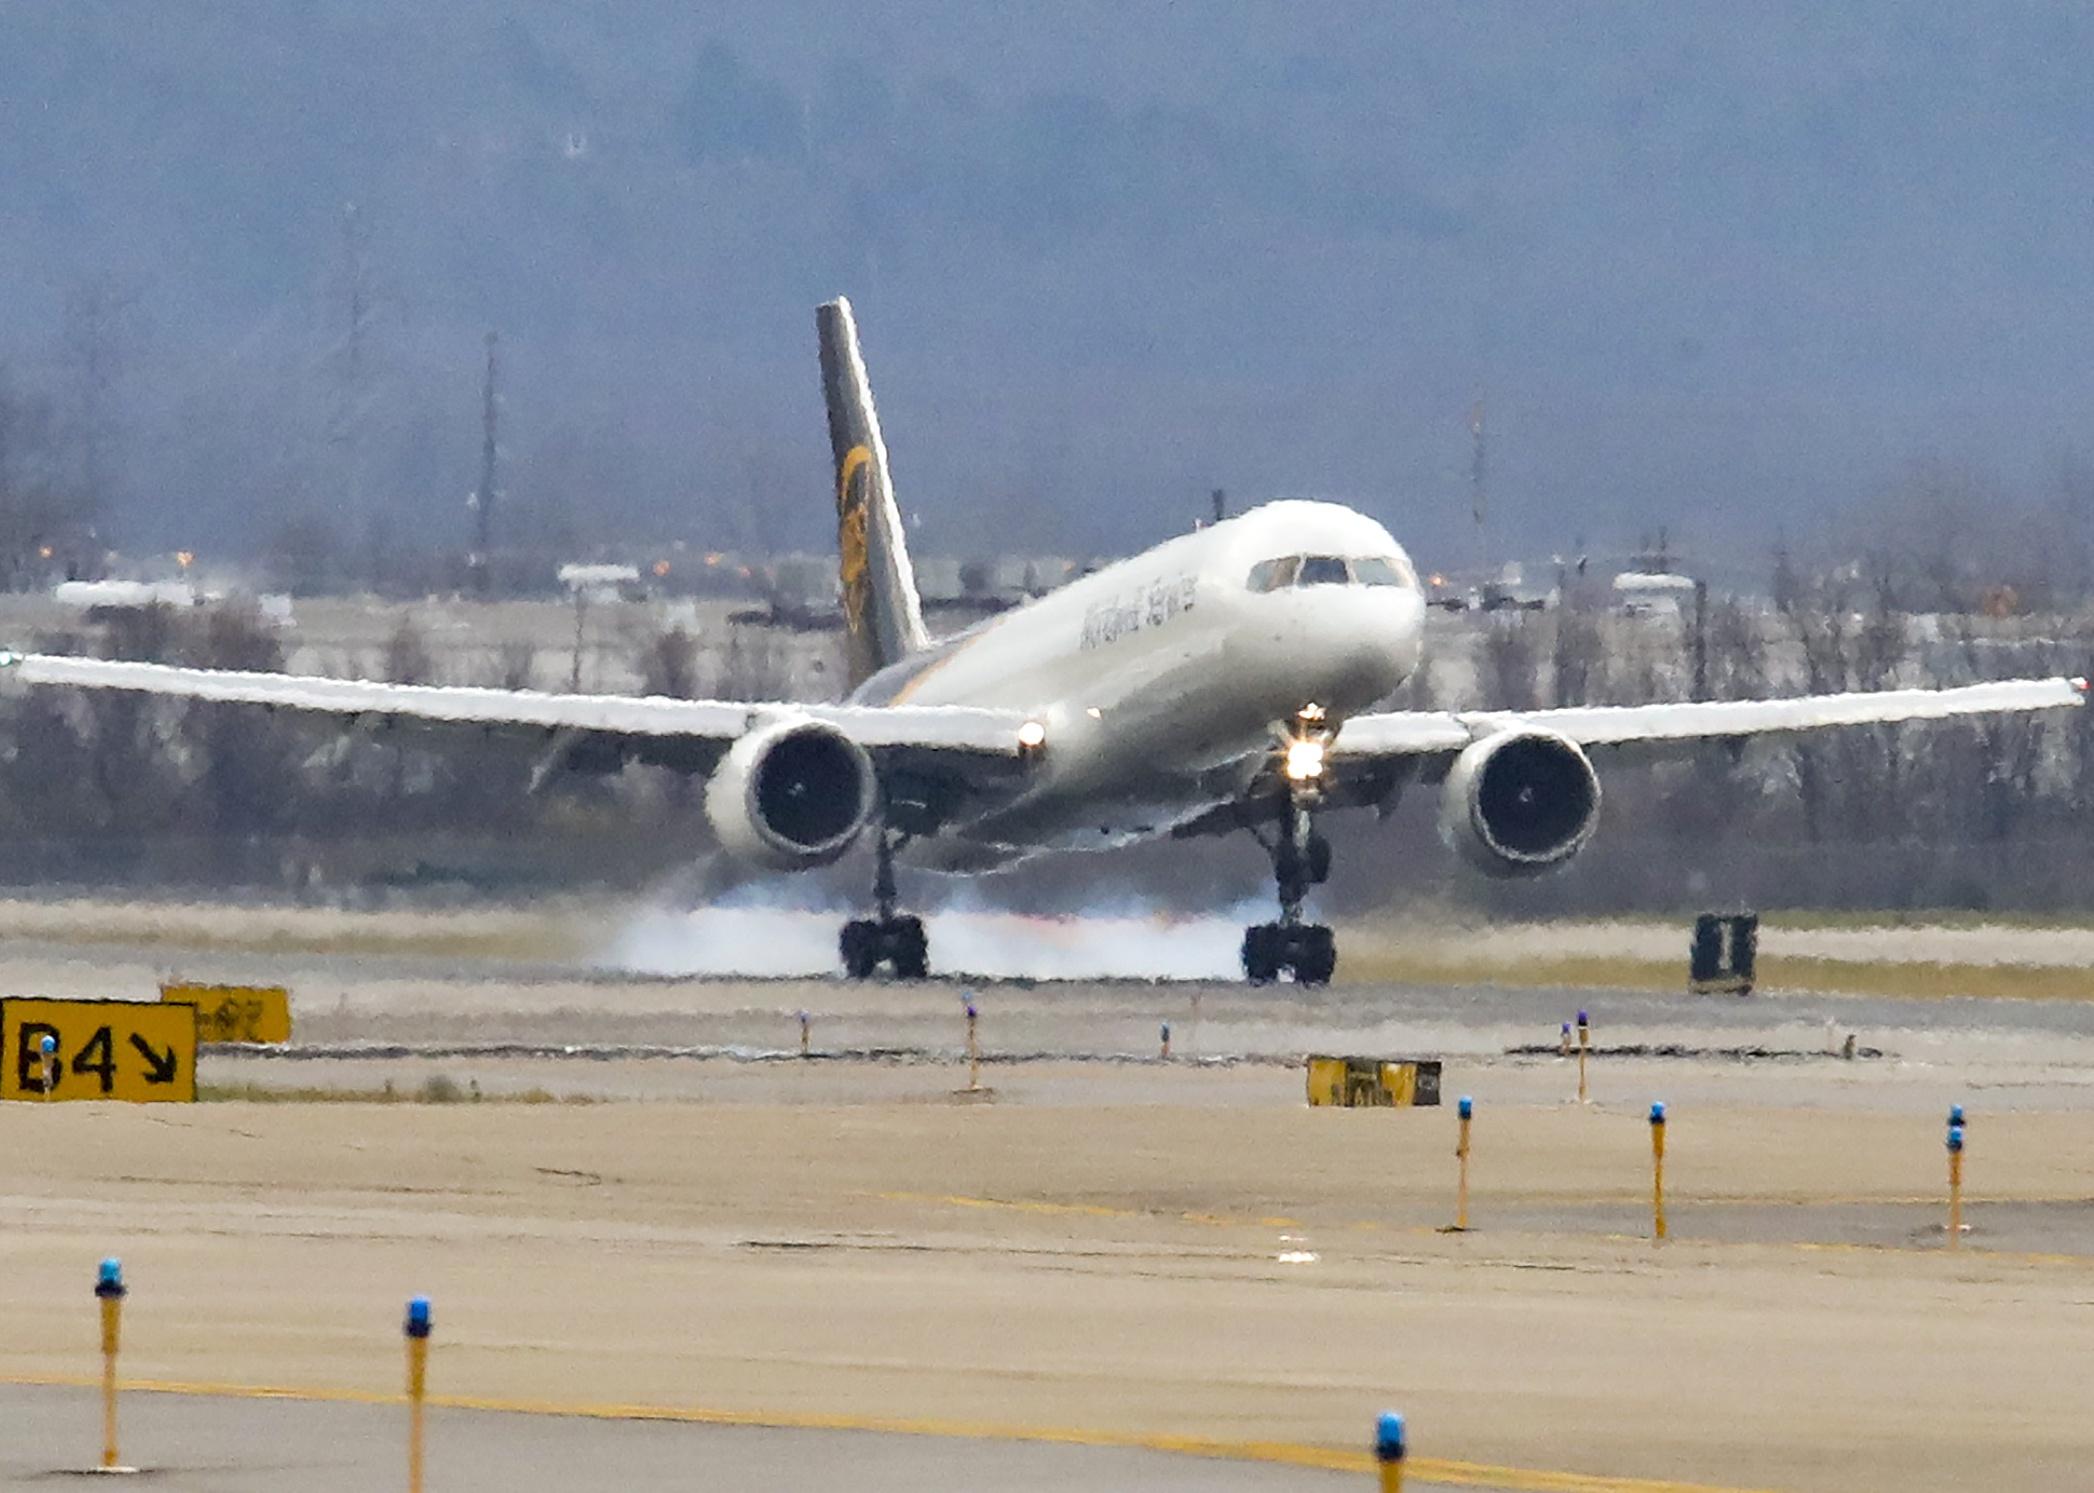
#71. Louisville, Kentucky: Louisville Muhammad Ali International
A plane landing on the runway.
– Annual flights (August 2021-July 2022): 22,072
– On-time performance: 75.61%
– Air carrier delay: 9.6%
– Weather delay: 1.0%
– National Aviation System delay: 4.1%
– Security delay: 0.1%
– Aircraft arriving late delay: 6.7%
– Cancelled flights: 2.9%
– Diverted flights: 0.1%
You may also like: Vintage photos that show the beauty of America’s national parks
Canva
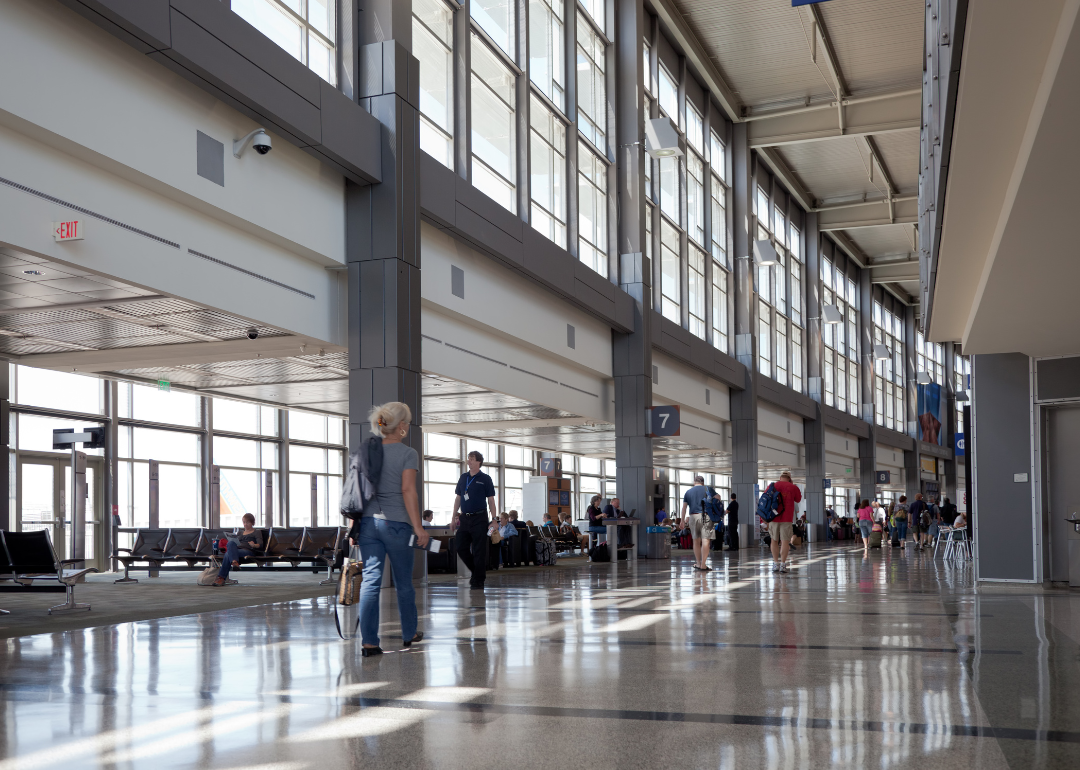
#70. Austin, Texas: Austin – Bergstrom International
People walking through Austin airport with floor to ceiling windows.
– Annual flights (August 2021-July 2022): 84,543
– On-time performance: 75.49%
– Air carrier delay: 8.3%
– Weather delay: 0.5%
– National Aviation System delay: 5.2%
– Security delay: 0.1%
– Aircraft arriving late delay: 7.9%
– Cancelled flights: 2.5%
– Diverted flights: 0.2%
Tdfire at English Wikipedia // Wikimedia Commons
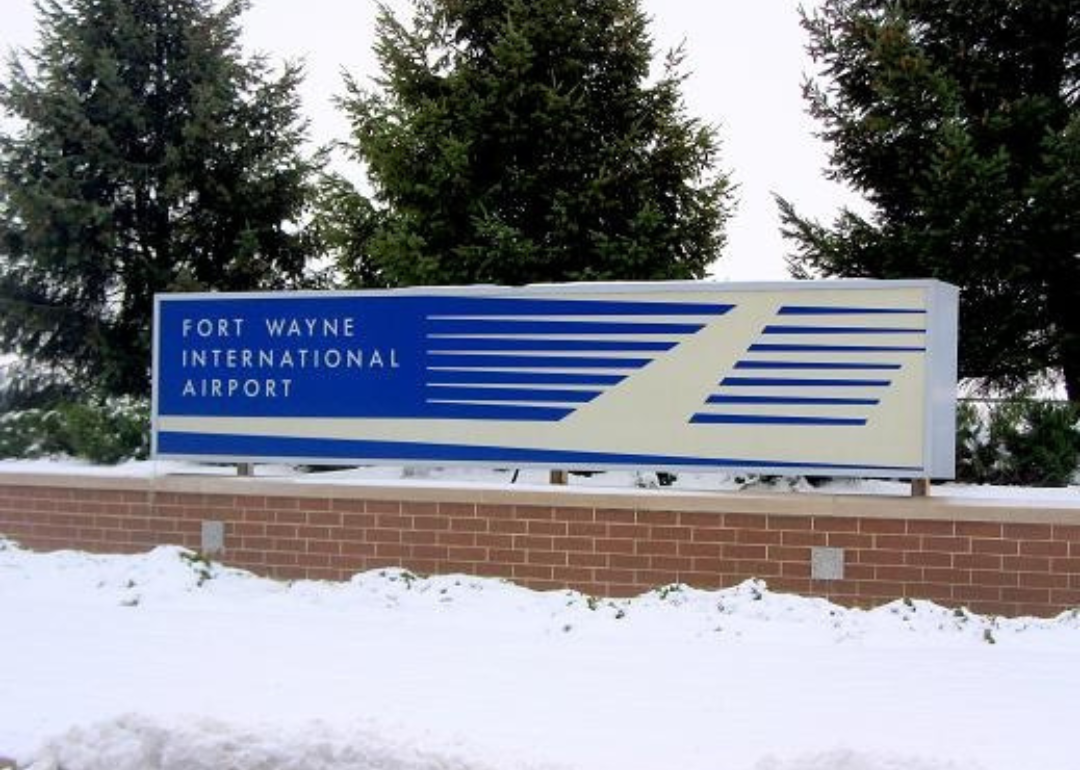
#69. Fort Wayne, Indiana: Fort Wayne International
A blue entrance sign to Fort Wayne International Airport.
– Annual flights (August 2021-July 2022): 5,448
– On-time performance: 75.44%
– Air carrier delay: 11.2%
– Weather delay: 1.8%
– National Aviation System delay: 2.5%
– Security delay: 0.0%
– Aircraft arriving late delay: 6.1%
– Cancelled flights: 2.6%
– Diverted flights: 0.4%
BRENDAN SMIALOWSKI/AFP // Getty Images
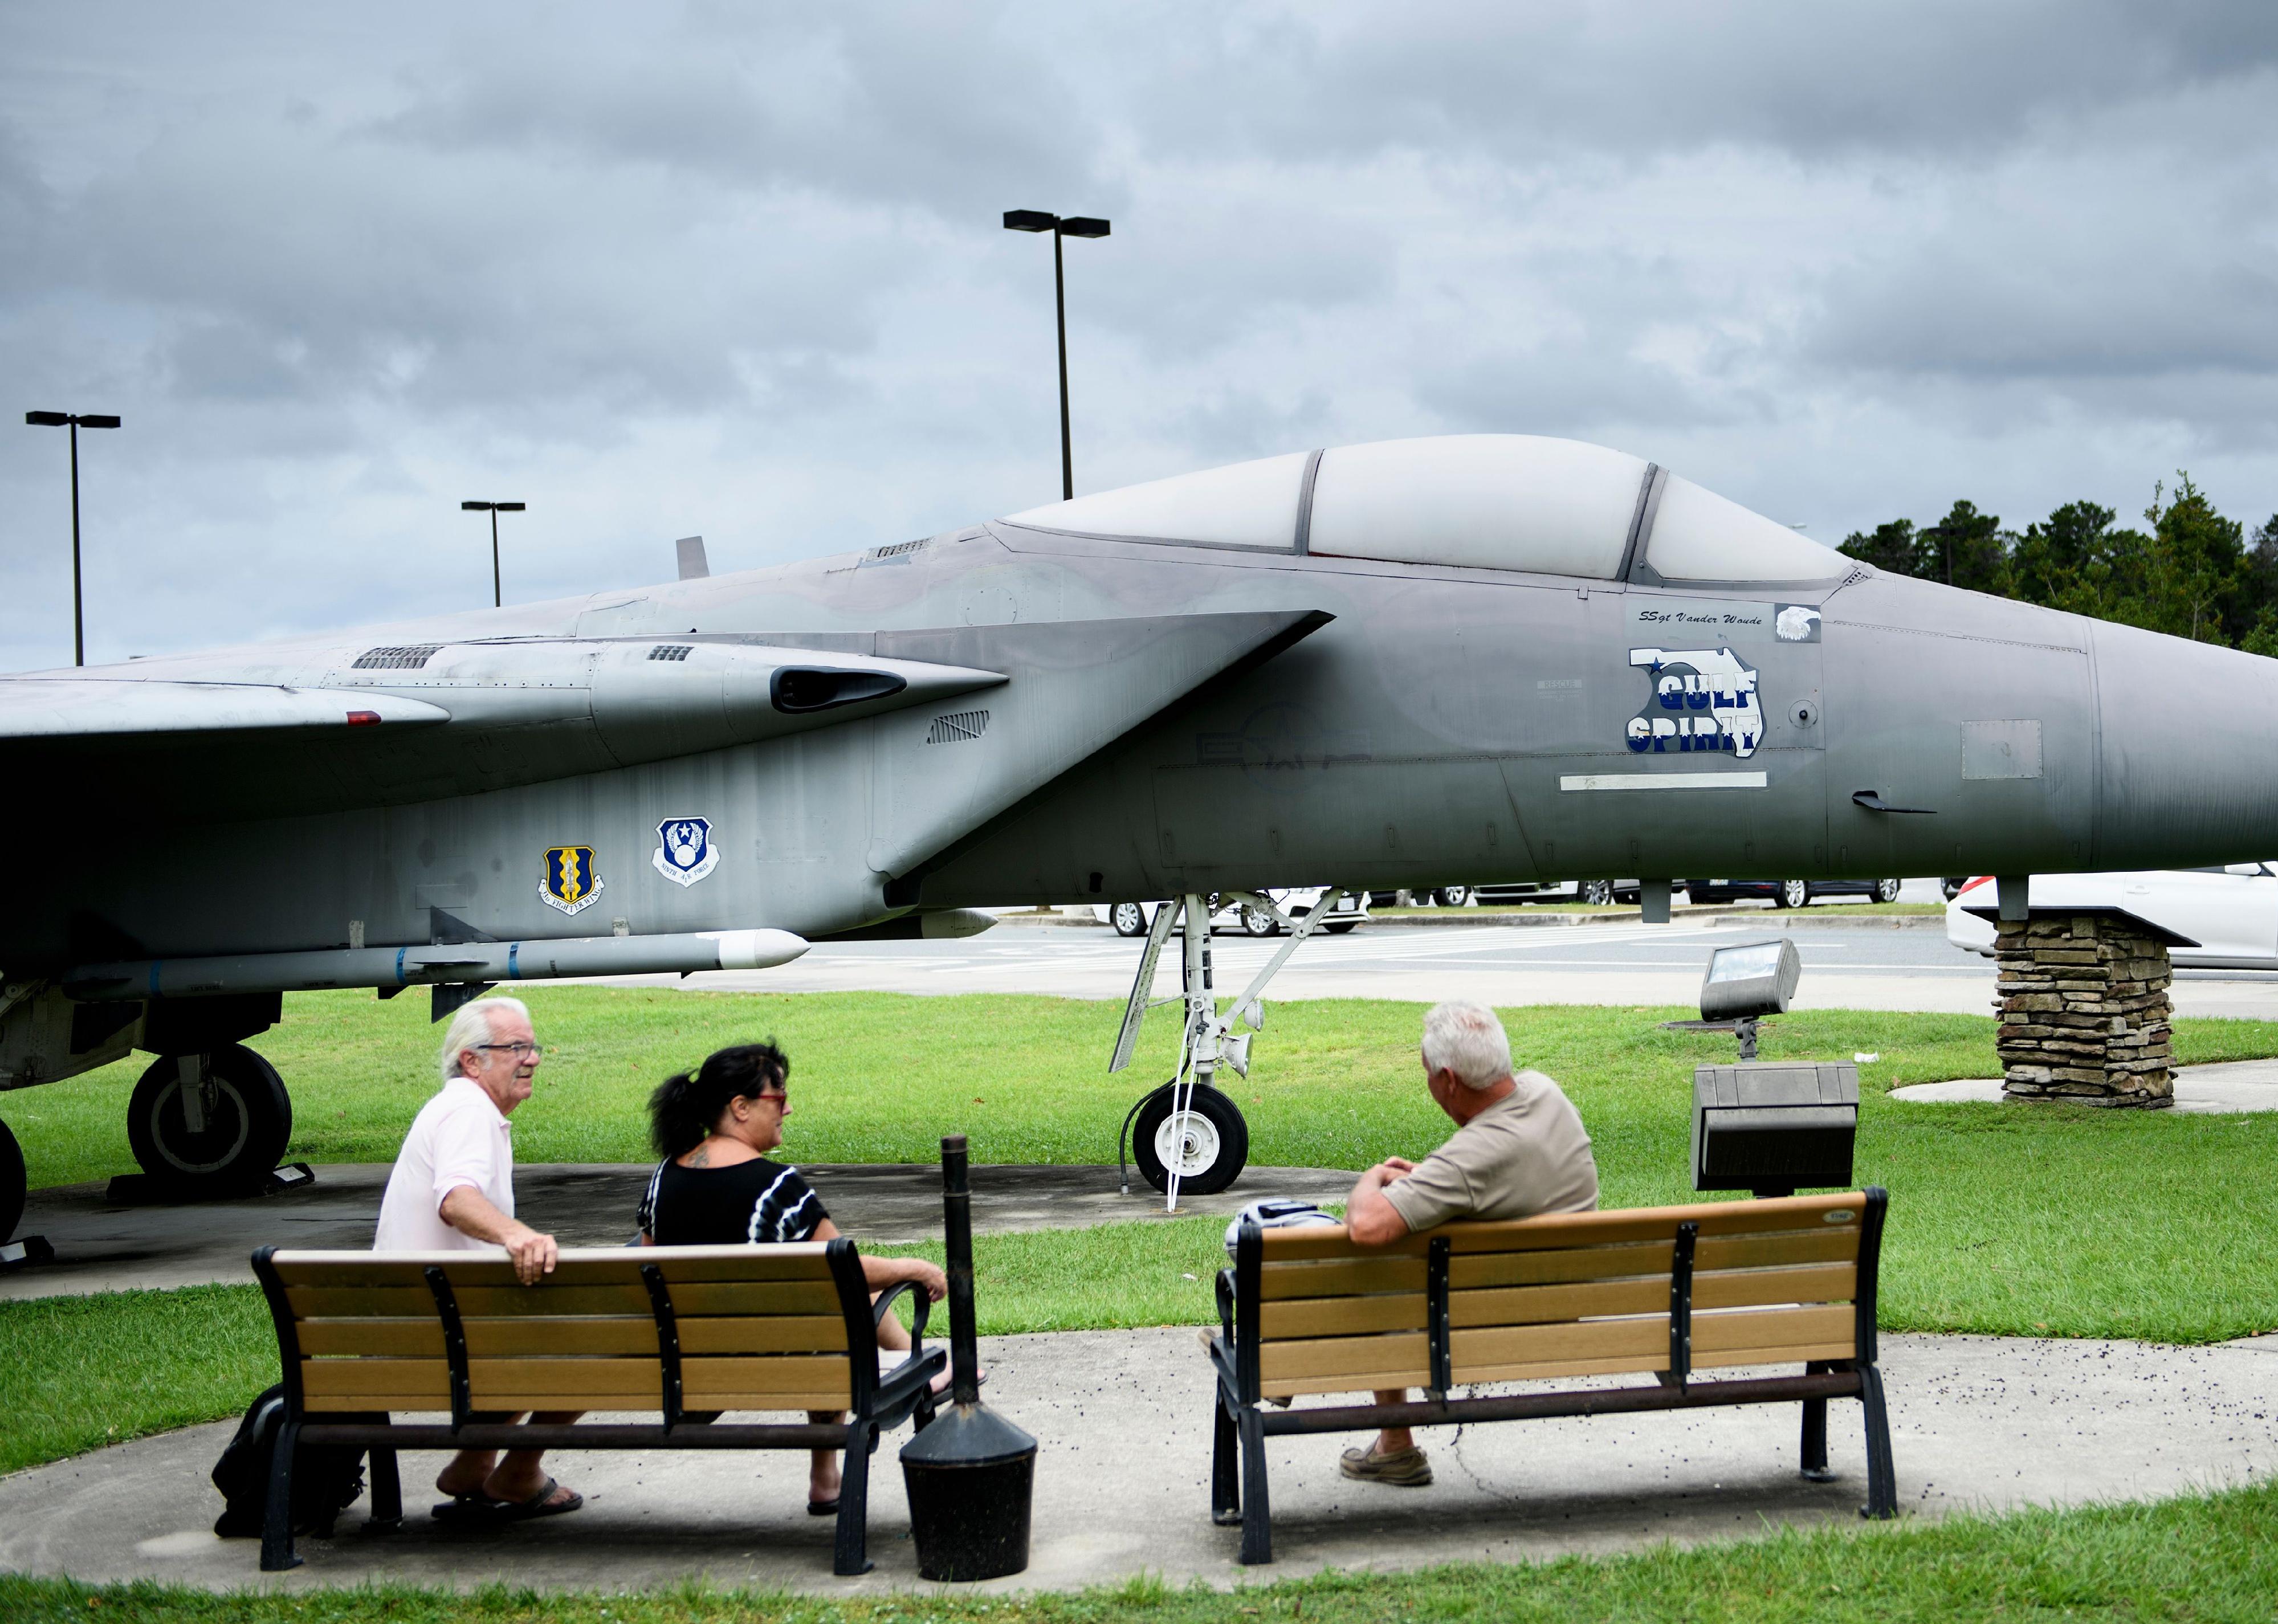
#68. Valparaiso, Florida: Eglin AFB Destin Fort Walton Beach
People sit on park benches in front of a military jet at Fort Walton Beach airport.
– Annual flights (August 2021-July 2022): 9,916
– On-time performance: 75.38%
– Air carrier delay: 7.1%
– Weather delay: 0.9%
– National Aviation System delay: 5.2%
– Security delay: 0.1%
– Aircraft arriving late delay: 8.3%
– Cancelled flights: 2.8%
– Diverted flights: 0.3%
Thitsanu Angkapunyadech // Shutterstock
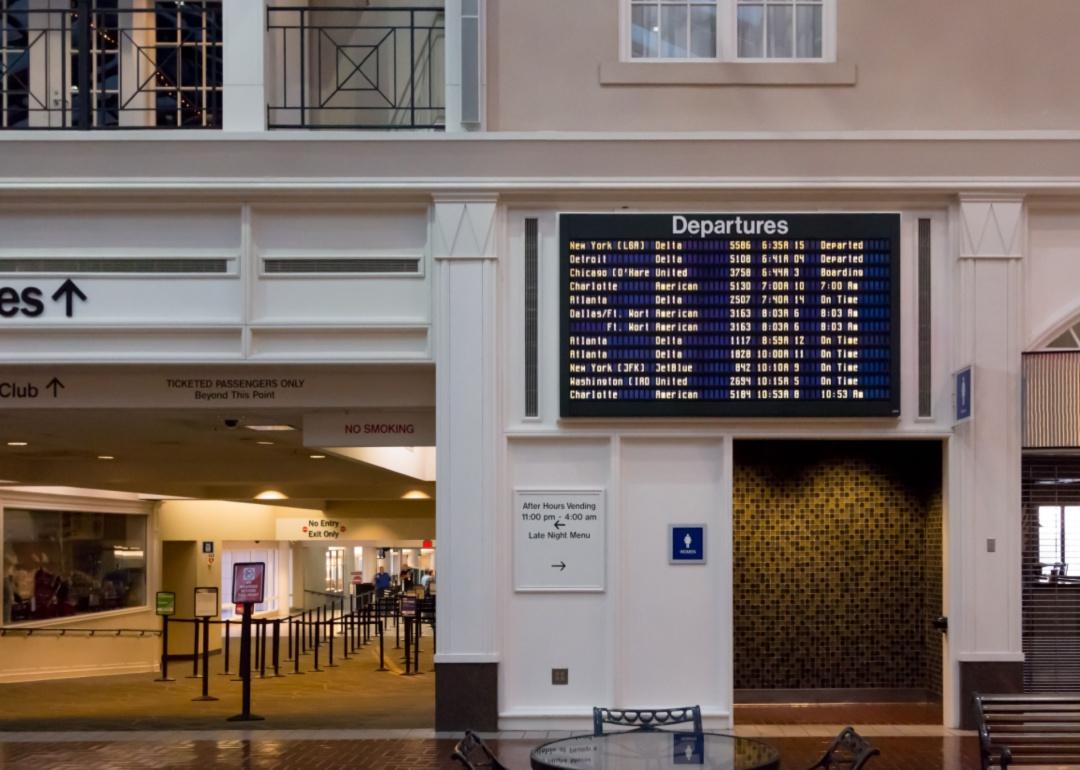
#67. Savannah, Georgia: Savannah/Hilton Head International
A departures sign inside Hilton Head airport.
– Annual flights (August 2021-July 2022): 18,690
– On-time performance: 75.38%
– Air carrier delay: 8.3%
– Weather delay: 0.7%
– National Aviation System delay: 6.0%
– Security delay: 0.0%
– Aircraft arriving late delay: 6.6%
– Cancelled flights: 2.9%
– Diverted flights: 0.2%
Wendy van Overstreet // Shutterstock
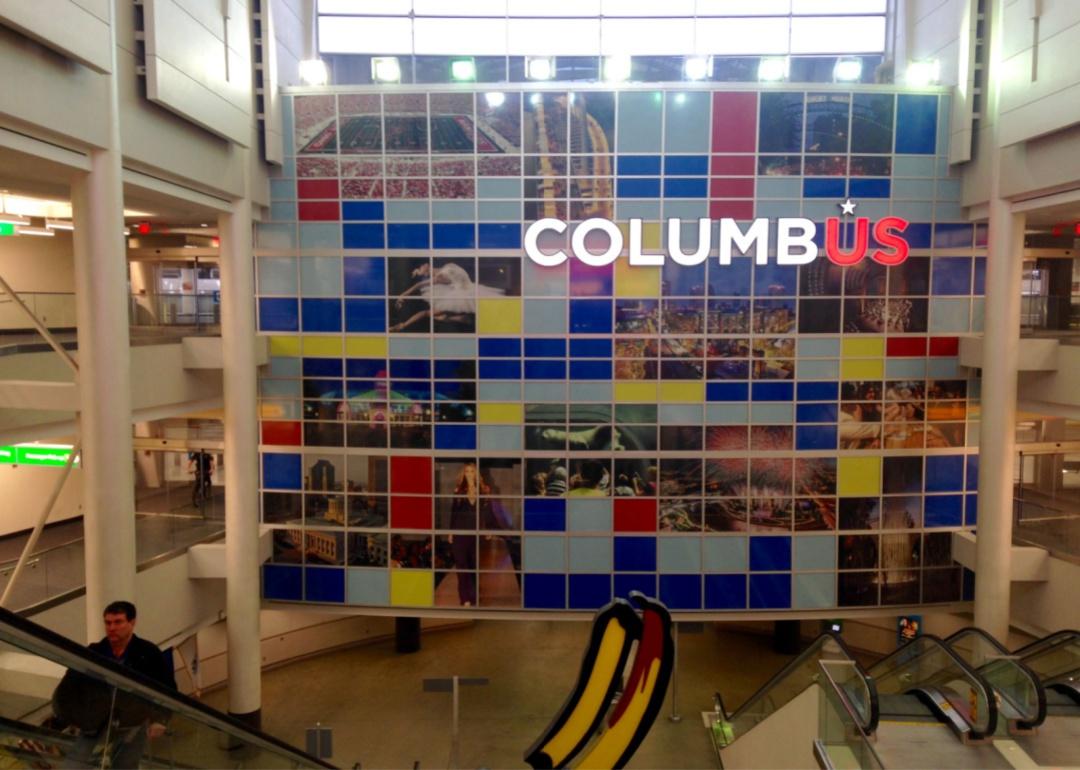
#66. Columbus, Ohio: John Glenn Columbus International
A man riding the escalator up in front of a mural at Columbus airport.
– Annual flights (August 2021-July 2022): 37,733
– On-time performance: 75.31%
– Air carrier delay: 8.8%
– Weather delay: 0.9%
– National Aviation System delay: 4.4%
– Security delay: 0.1%
– Aircraft arriving late delay: 7.4%
– Cancelled flights: 2.9%
– Diverted flights: 0.2%
You may also like: 50 incredible photos of our oceans
Canva
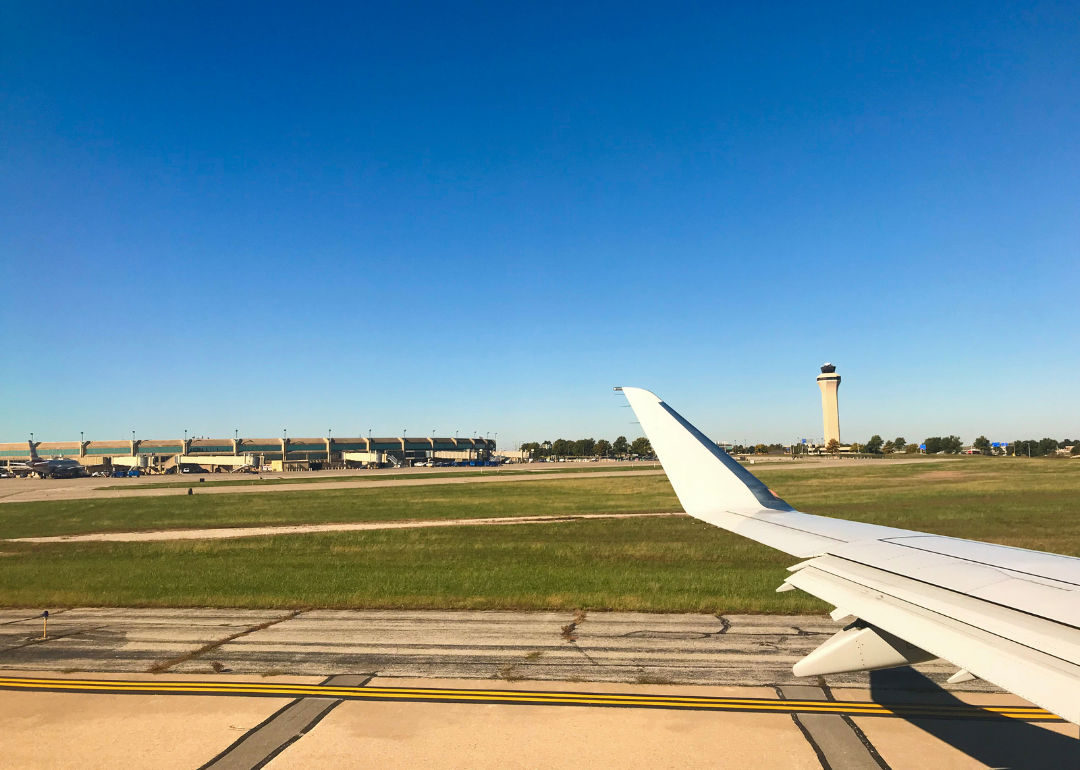
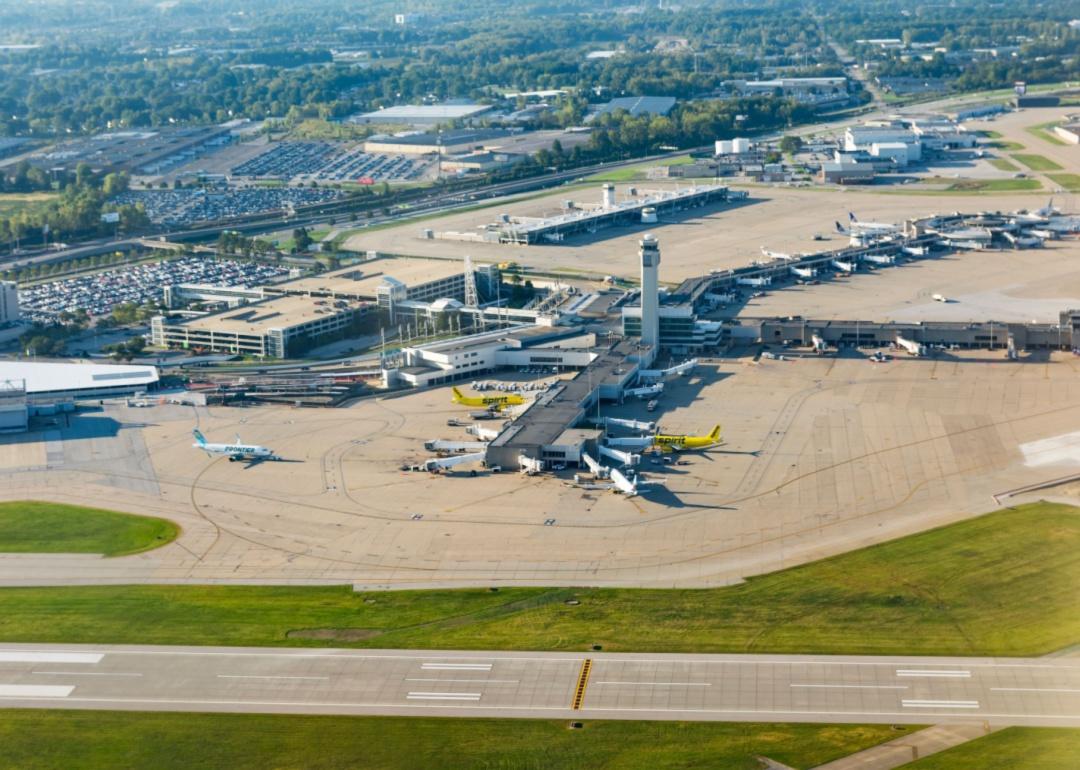
#65. Kansas City, Missouri: Kansas City International
An airplane wing on the runway with the terminal in the background.
– Annual flights (August 2021-July 2022): 43,676
– On-time performance: 75.28%
– Air carrier delay: 9.7%
– Weather delay: 0.7%
– National Aviation System delay: 3.4%
– Security delay: 0.1%
– Aircraft arriving late delay: 8.1%
– Cancelled flights: 2.5%
– Diverted flights: 0.3%
University of College // Shutterstock
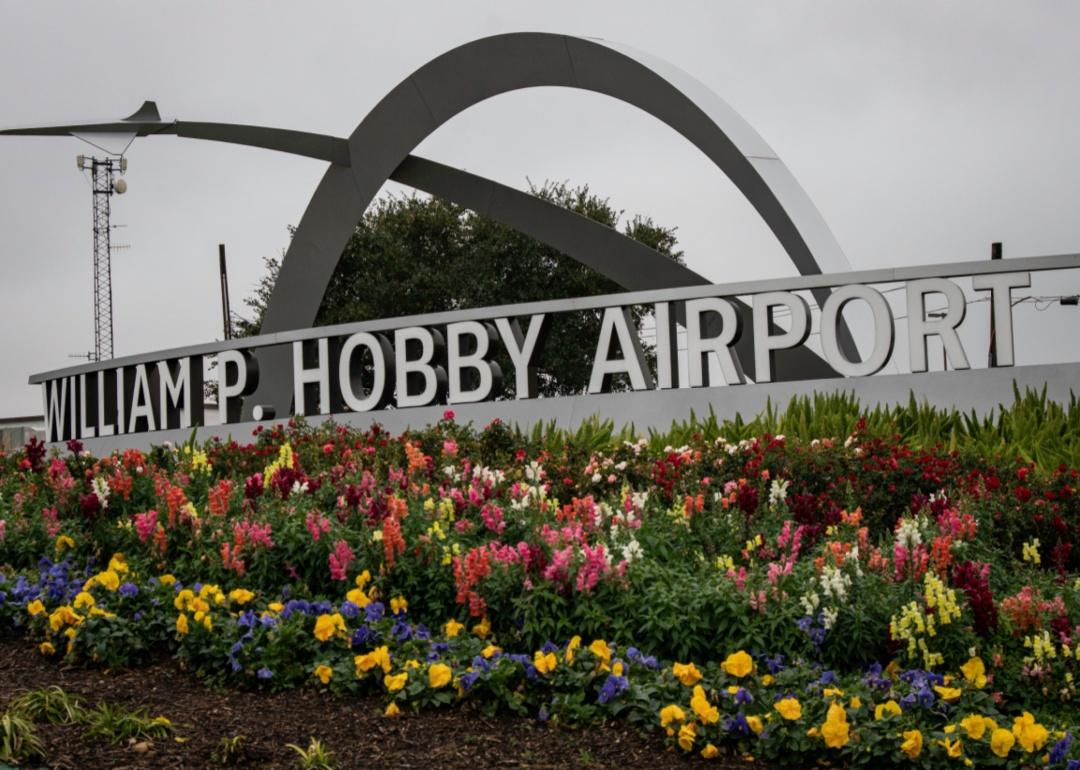
#64. Houston, Texas: William P Hobby
The William P. Hobby airport sign and metal arches in front of a blooming flower bed.
– Annual flights (August 2021-July 2022): 49,945
– On-time performance: 75.23%
– Air carrier delay: 8.0%
– Weather delay: 0.3%
– National Aviation System delay: 3.7%
– Security delay: 0.1%
– Aircraft arriving late delay: 9.8%
– Cancelled flights: 2.6%
– Diverted flights: 0.2%
RaksyBH // Shutterstock
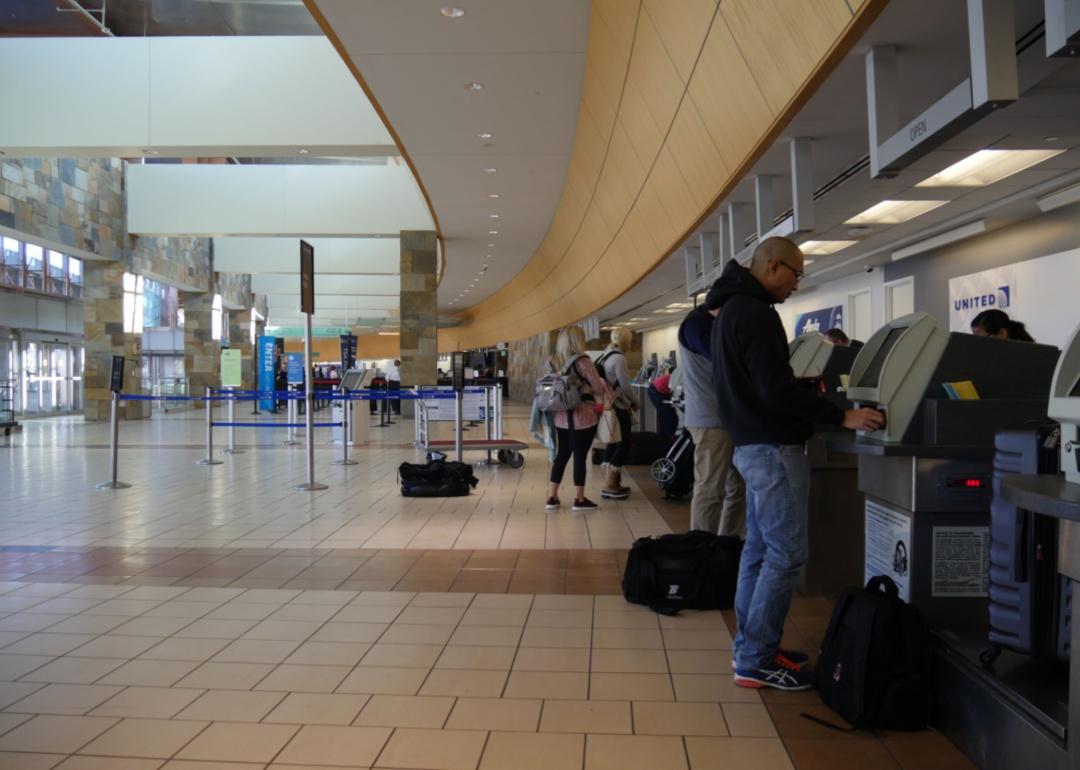
#63. Oklahoma City, Oklahoma: Will Rogers World
Passengers checking into kiosks at Will Rogers World airport.
– Annual flights (August 2021-July 2022): 20,623
– On-time performance: 75.16%
– Air carrier delay: 11.5%
– Weather delay: 0.9%
– National Aviation System delay: 2.4%
– Security delay: 0.0%
– Aircraft arriving late delay: 7.6%
– Cancelled flights: 2.3%
– Diverted flights: 0.2%
EQRoy // Shutterstock
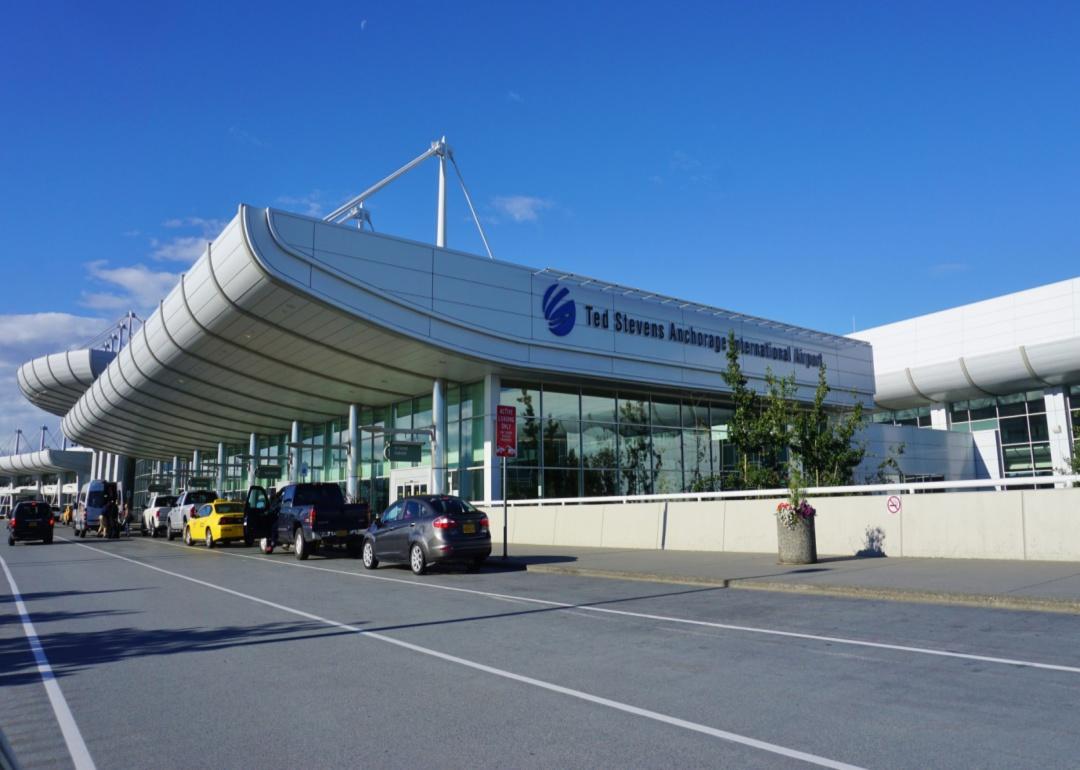
#62. Anchorage, Alaska: Ted Stevens Anchorage International
Cars under a large awning at Ted Stevens airport.
– Annual flights (August 2021-July 2022): 20,537
– On-time performance: 75.16%
– Air carrier delay: 6.9%
– Weather delay: 0.5%
– National Aviation System delay: 7.0%
– Security delay: 1.4%
– Aircraft arriving late delay: 6.2%
– Cancelled flights: 2.7%
– Diverted flights: 0.2%
Pi3.124 // Wikimedia Commons
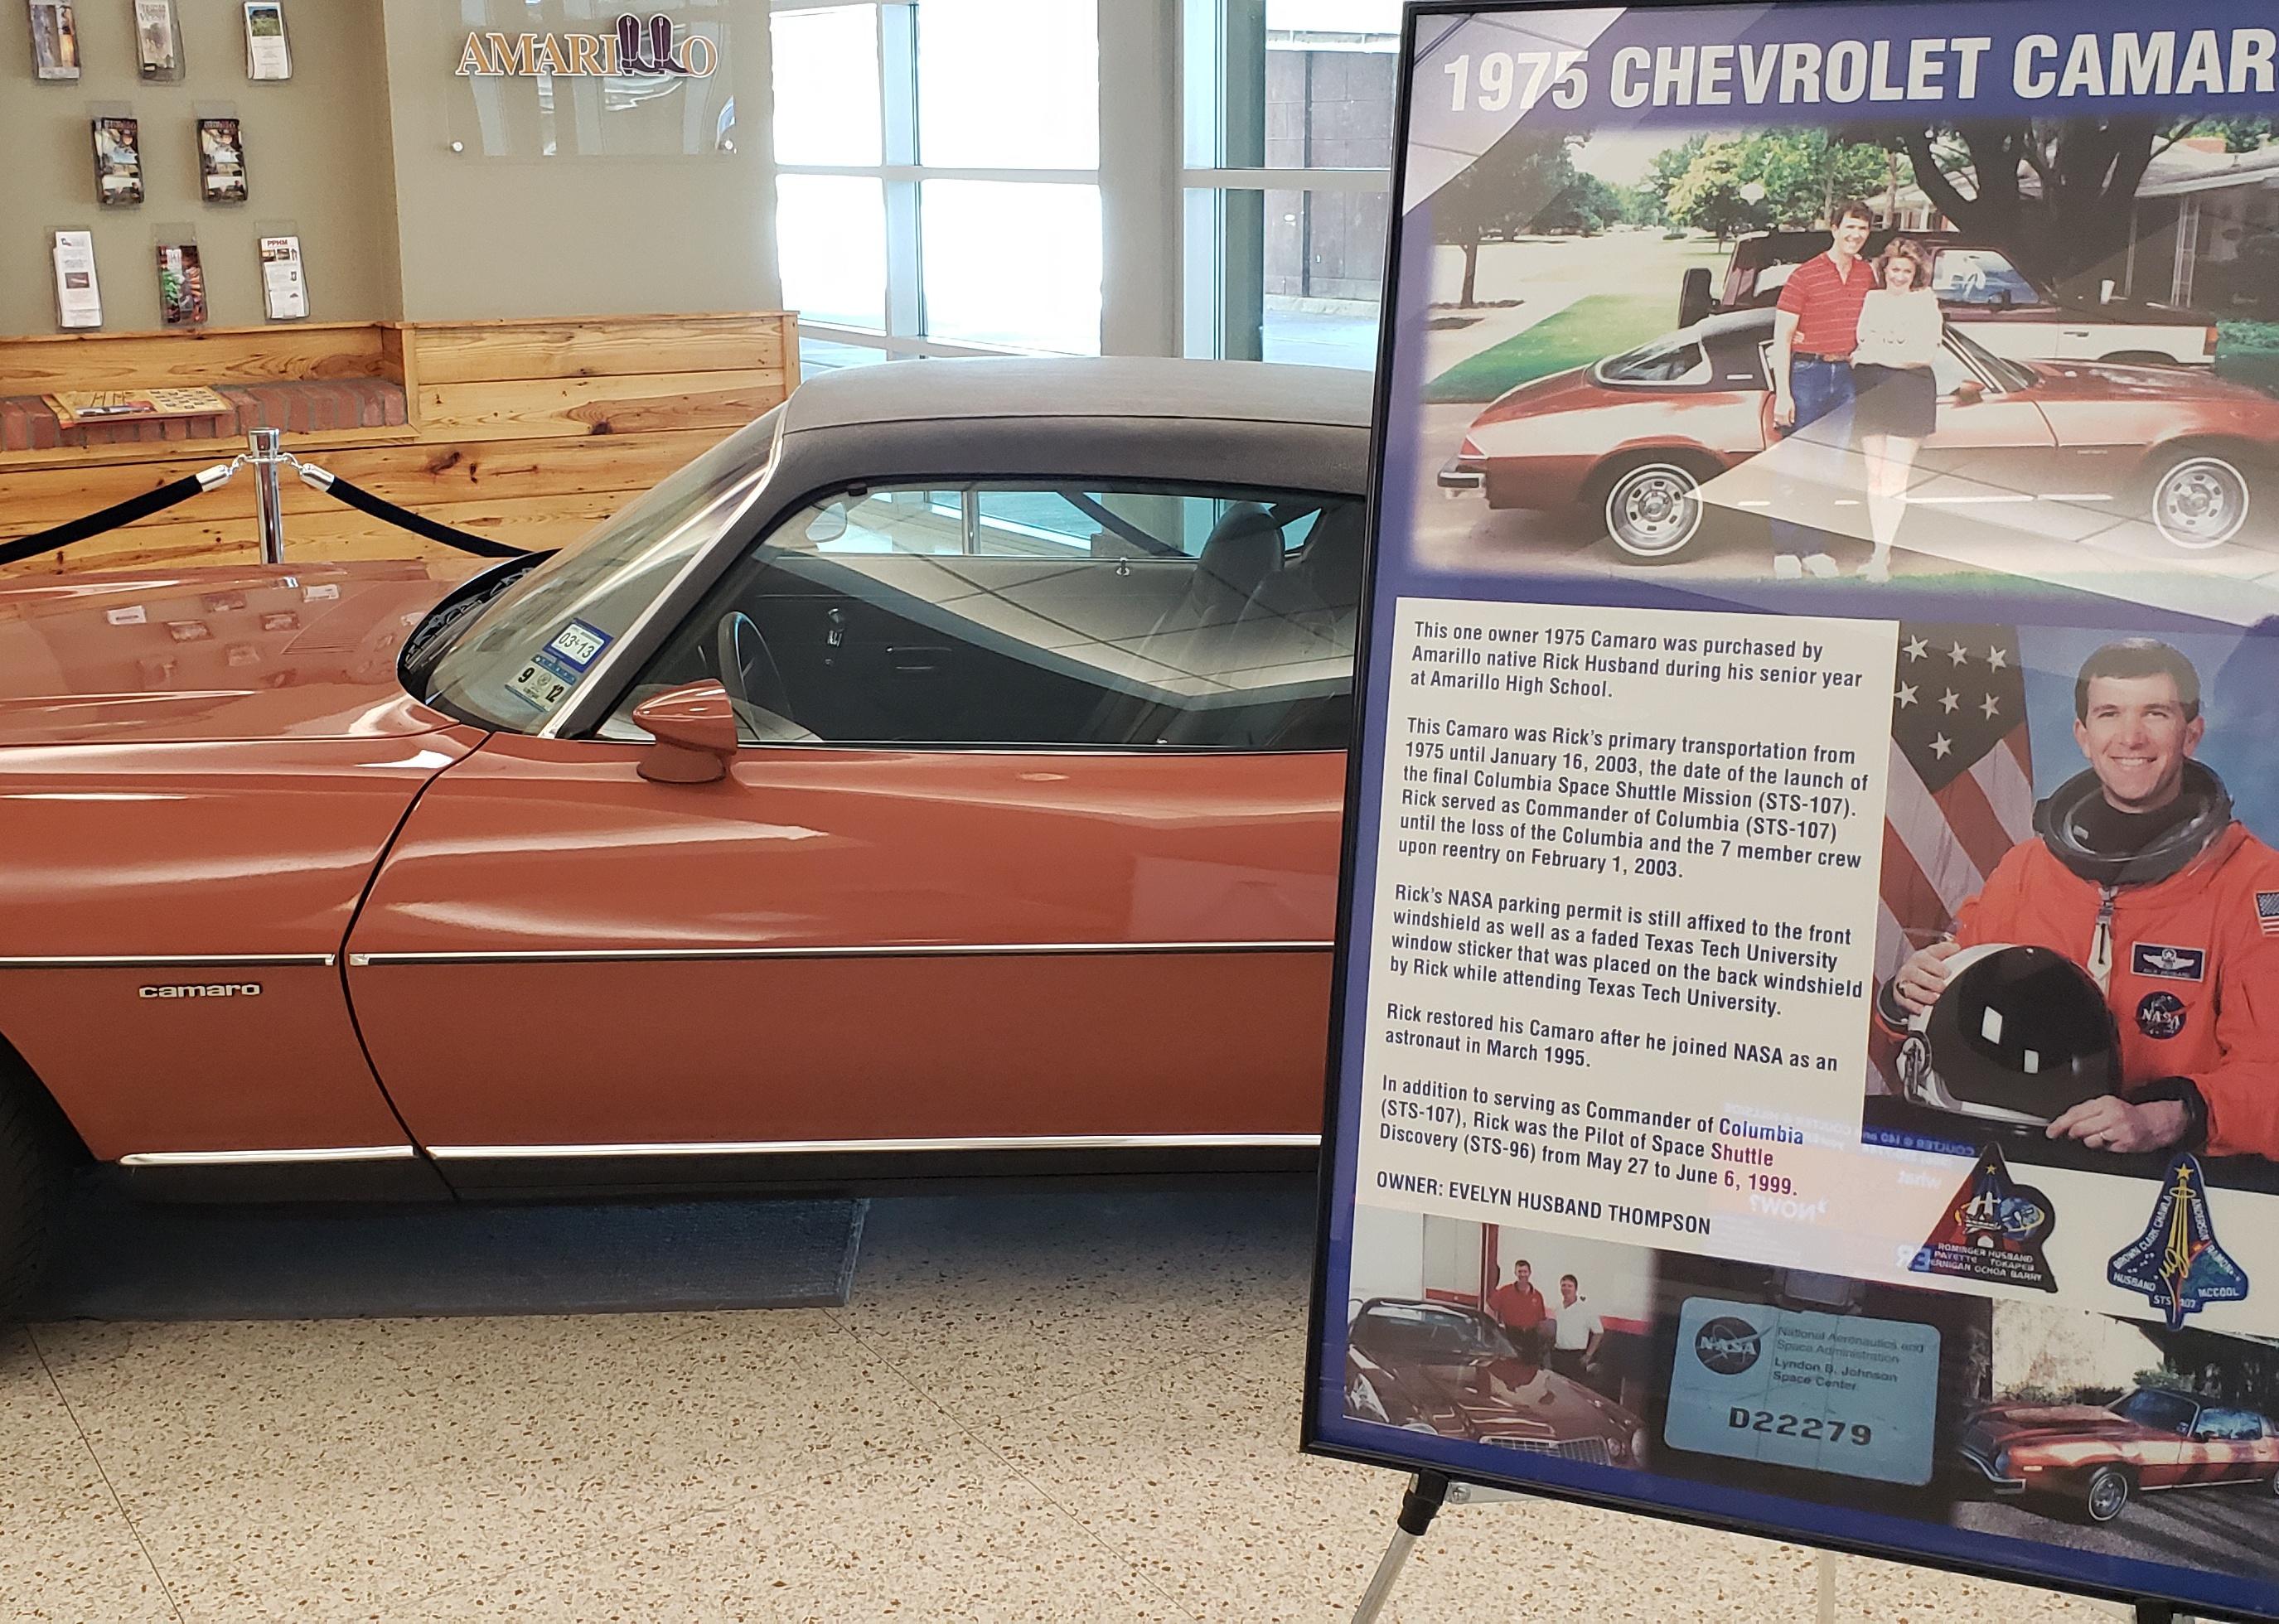
#61. Amarillo, Texas: Rick Husband Amarillo International
Rick Husband’s Camaro on display at Amarillo airport.
– Annual flights (August 2021-July 2022): 4,805
– On-time performance: 75.13%
– Air carrier delay: 10.3%
– Weather delay: 0.6%
– National Aviation System delay: 1.7%
– Security delay: 0.0%
– Aircraft arriving late delay: 9.2%
– Cancelled flights: 3.0%
– Diverted flights: 0.1%
You may also like: Top 100 city destinations in the world
KTrimble // Wikimedia Commons
#60. Peoria, Illinois: General Downing – Peoria International
An aerial view of Peoria airport.
– Annual flights (August 2021-July 2022): 3,226
– On-time performance: 75.11%
– Air carrier delay: 8.1%
– Weather delay: 1.2%
– National Aviation System delay: 5.3%
– Security delay: 0.0%
– Aircraft arriving late delay: 7.0%
– Cancelled flights: 3.2%
– Diverted flights: 0.2%
formulanone // Wikimedia Commons
#59. Bangor, Maine: Bangor International
Bangor International airport in the snow.
– Annual flights (August 2021-July 2022): 4,824
– On-time performance: 74.98%
– Air carrier delay: 7.2%
– Weather delay: 0.8%
– National Aviation System delay: 5.1%
– Security delay: 0.0%
– Aircraft arriving late delay: 7.1%
– Cancelled flights: 4.6%
– Diverted flights: 0.2%
On The Run Photo // Shutterstock
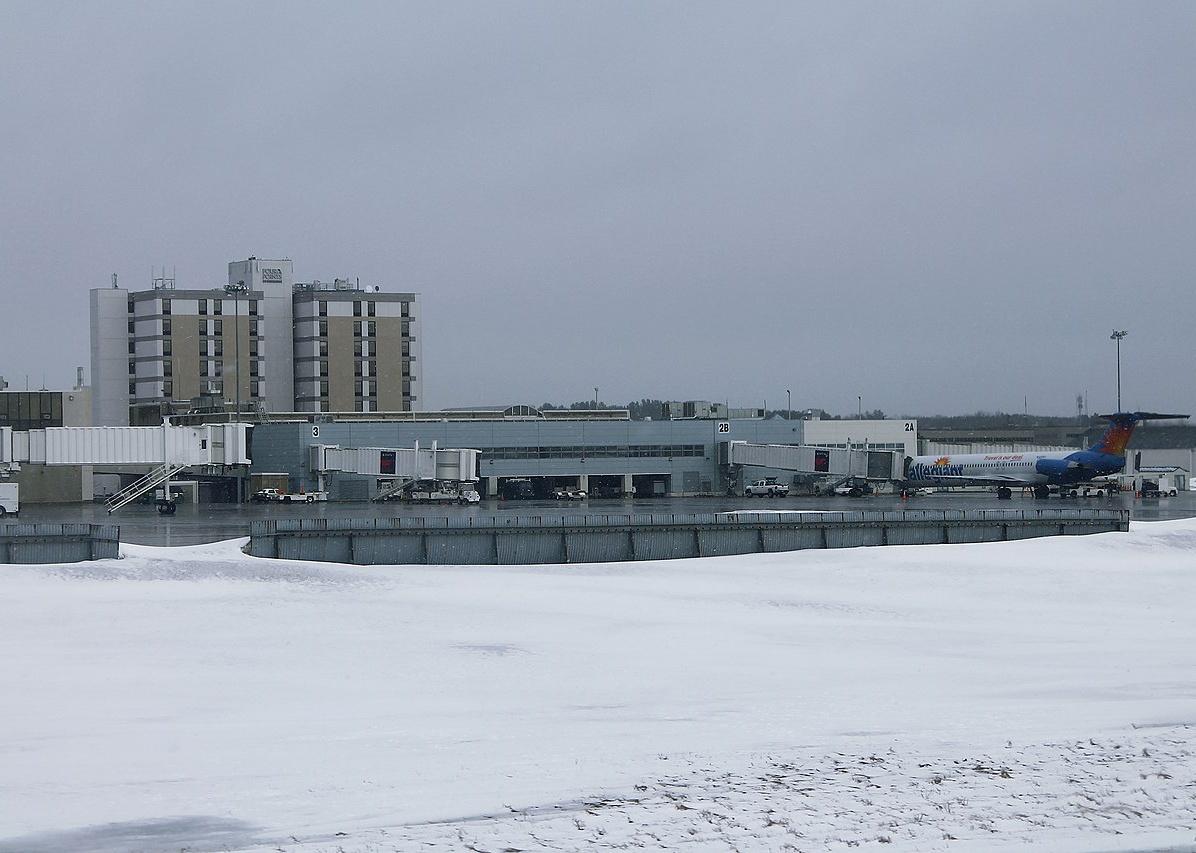
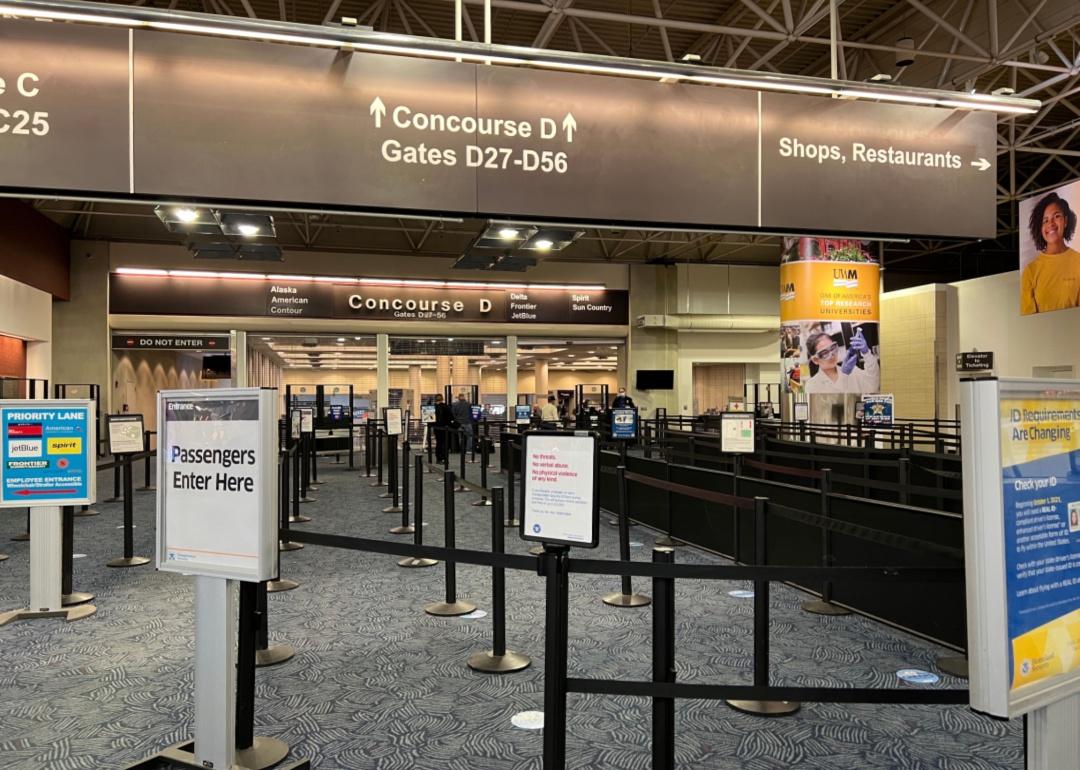
#58. Milwaukee, Wisconsin: General Mitchell International
A security lane at the airport.
– Annual flights (August 2021-July 2022): 25,616
– On-time performance: 74.96%
– Air carrier delay: 10.6%
– Weather delay: 0.9%
– National Aviation System delay: 3.0%
– Security delay: 0.0%
– Aircraft arriving late delay: 7.9%
– Cancelled flights: 2.5%
– Diverted flights: 0.2%
Canva
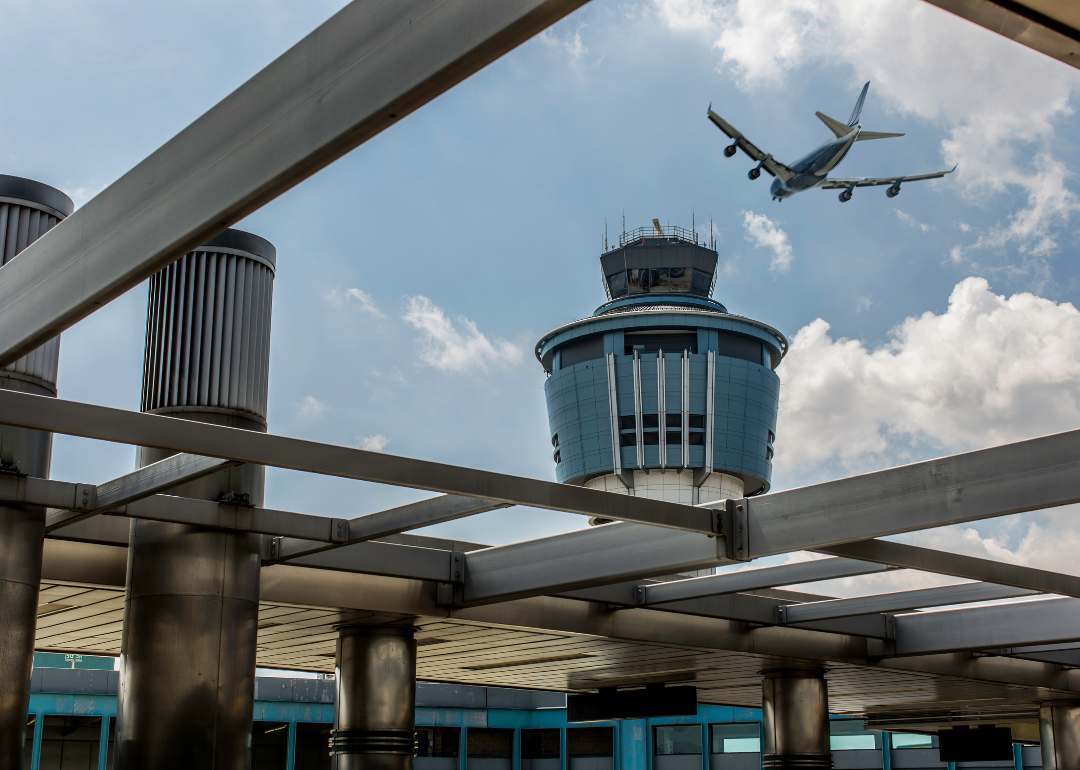
#57. New York, New York: LaGuardia
LaGuardia airport control tower with plane flying over.
– Annual flights (August 2021-July 2022): 150,229
– On-time performance: 74.95%
– Air carrier delay: 5.9%
– Weather delay: 0.8%
– National Aviation System delay: 7.8%
– Security delay: 0.1%
– Aircraft arriving late delay: 5.3%
– Cancelled flights: 4.7%
– Diverted flights: 0.5%
debra millet // Shutterstock
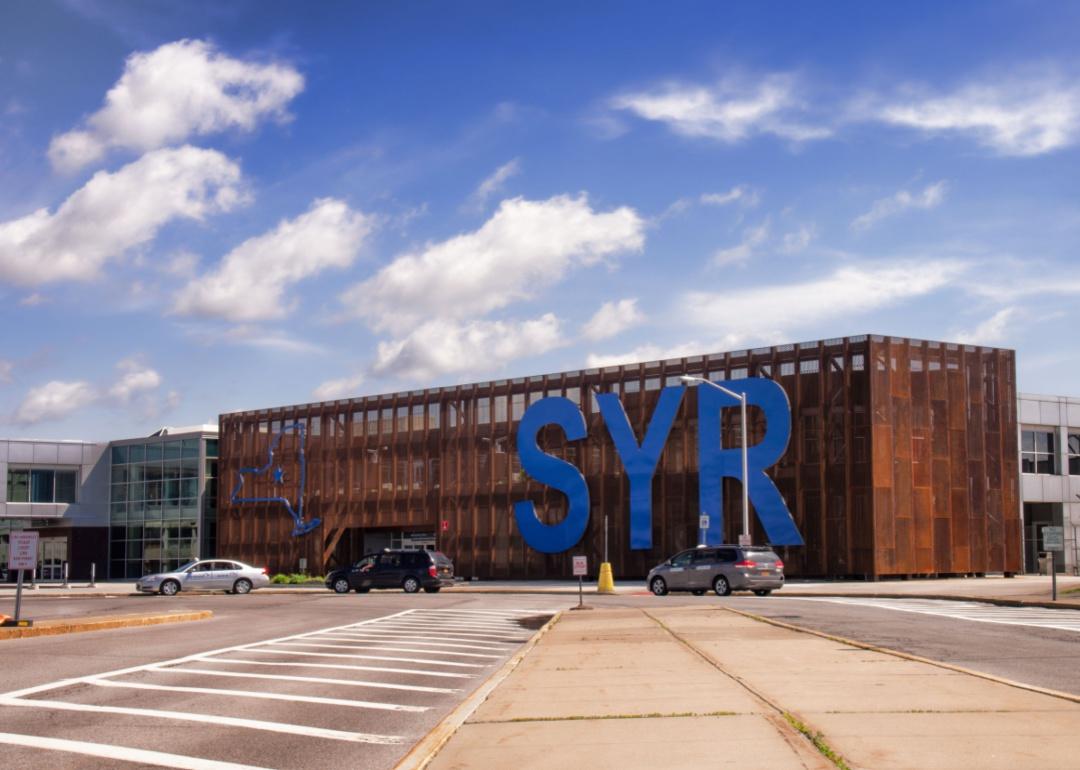
#56. Syracuse, New York: Syracuse Hancock International
The entrance to the Syracuse Hancock airport with large blue SYR letters in blue on a building.
– Annual flights (August 2021-July 2022): 12,273
– On-time performance: 74.79%
– Air carrier delay: 9.8%
– Weather delay: 0.8%
– National Aviation System delay: 4.4%
– Security delay: 0.0%
– Aircraft arriving late delay: 6.9%
– Cancelled flights: 3.3%
– Diverted flights: 0.1%
You may also like: Breathtaking natural wonders for your next vacation
EQRoy // Shutterstock
#55. Indianapolis, Indiana: Indianapolis International
An exterior view of the terminal and a curved building at Indianapolis airport.
– Annual flights (August 2021-July 2022): 41,564
– On-time performance: 74.74%
– Air carrier delay: 8.8%
– Weather delay: 0.7%
– National Aviation System delay: 4.6%
– Security delay: 0.1%
– Aircraft arriving late delay: 8.0%
– Cancelled flights: 3.0%
– Diverted flights: 0.1%
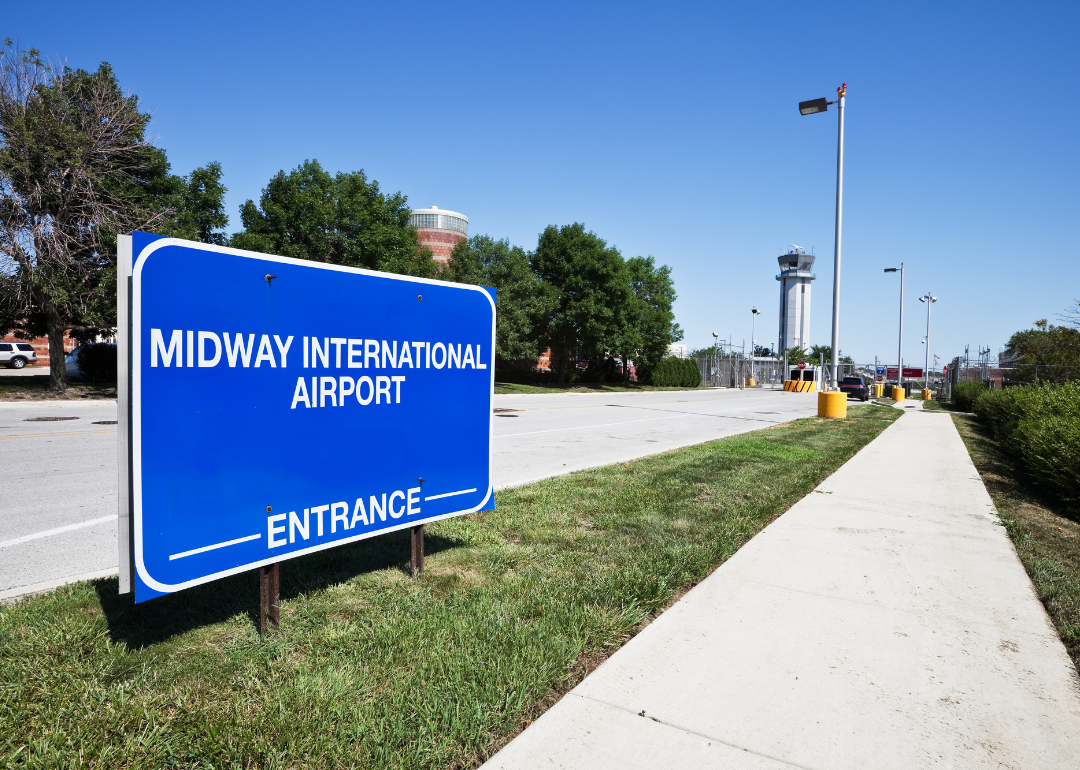
Canva
#54. Chicago, Illinois: Chicago Midway International
A blue sign designating the entrance the the Midway International Airport with the control tower in the background.
– Annual flights (August 2021-July 2022): 70,543
– On-time performance: 74.71%
– Air carrier delay: 8.1%
– Weather delay: 0.3%
– National Aviation System delay: 4.1%
– Security delay: 0.1%
– Aircraft arriving late delay: 9.7%
– Cancelled flights: 2.6%
– Diverted flights: 0.3%
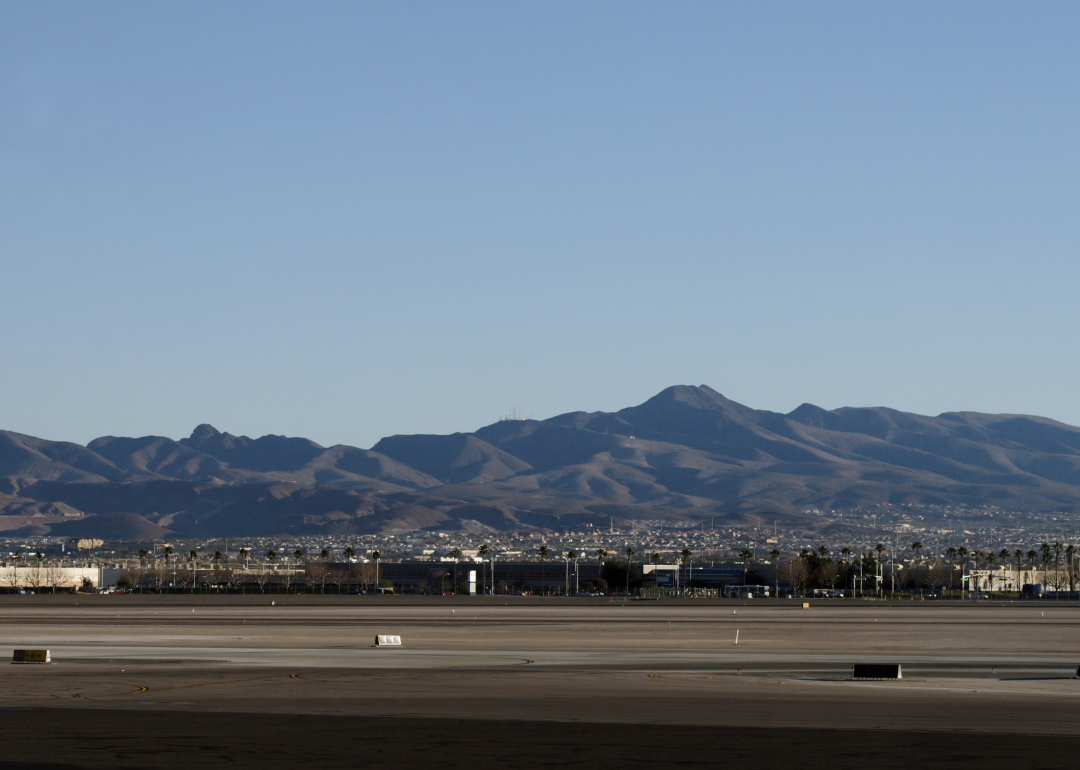
Canva
#53. Las Vegas, Nevada: McCarran International
A runway at McCarran airport with mountains in the background.
– Annual flights (August 2021-July 2022): 165,127
– On-time performance: 74.67%
– Air carrier delay: 7.6%
– Weather delay: 0.5%
– National Aviation System delay: 6.4%
– Security delay: 0.1%
– Aircraft arriving late delay: 8.7%
– Cancelled flights: 2.0%
– Diverted flights: 0.1%
EQRoy // Shutterstock
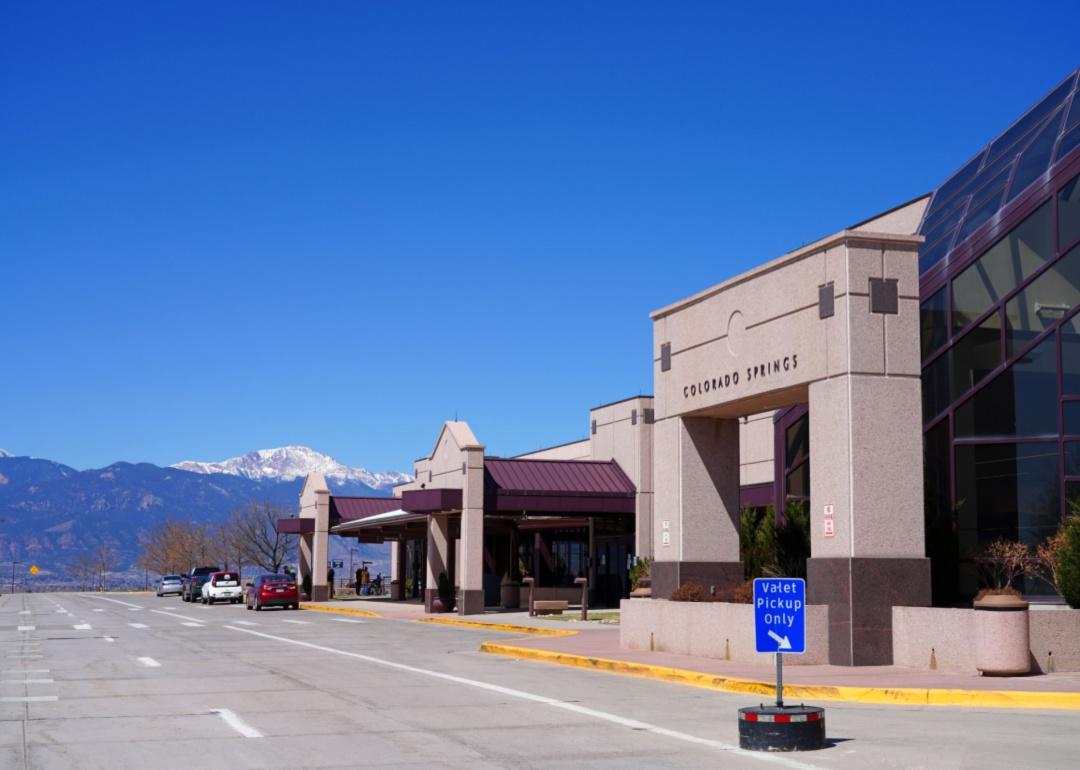
#52. Colorado Springs, Colorado: City of Colorado Springs Municipal
A small Colorado Springs airport building in front of blue sky and mountains.
– Annual flights (August 2021-July 2022): 12,242
– On-time performance: 74.46%
– Air carrier delay: 11.8%
– Weather delay: 0.7%
– National Aviation System delay: 1.7%
– Security delay: 0.0%
– Aircraft arriving late delay: 8.9%
– Cancelled flights: 2.2%
– Diverted flights: 0.2%
Mikhalis Makarov // Shutterstock
#51. Cleveland, Ohio: Cleveland-Hopkins International
An aerial view of Cleveland-Hopkins International airport.
– Annual flights (August 2021-July 2022): 39,885
– On-time performance: 74.45%
– Air carrier delay: 9.0%
– Weather delay: 0.8%
– National Aviation System delay: 5.3%
– Security delay: 0.1%
– Aircraft arriving late delay: 7.2%
– Cancelled flights: 3.1%
– Diverted flights: 0.1%
You may also like: Oldest Disneyland rides from 1955 to today
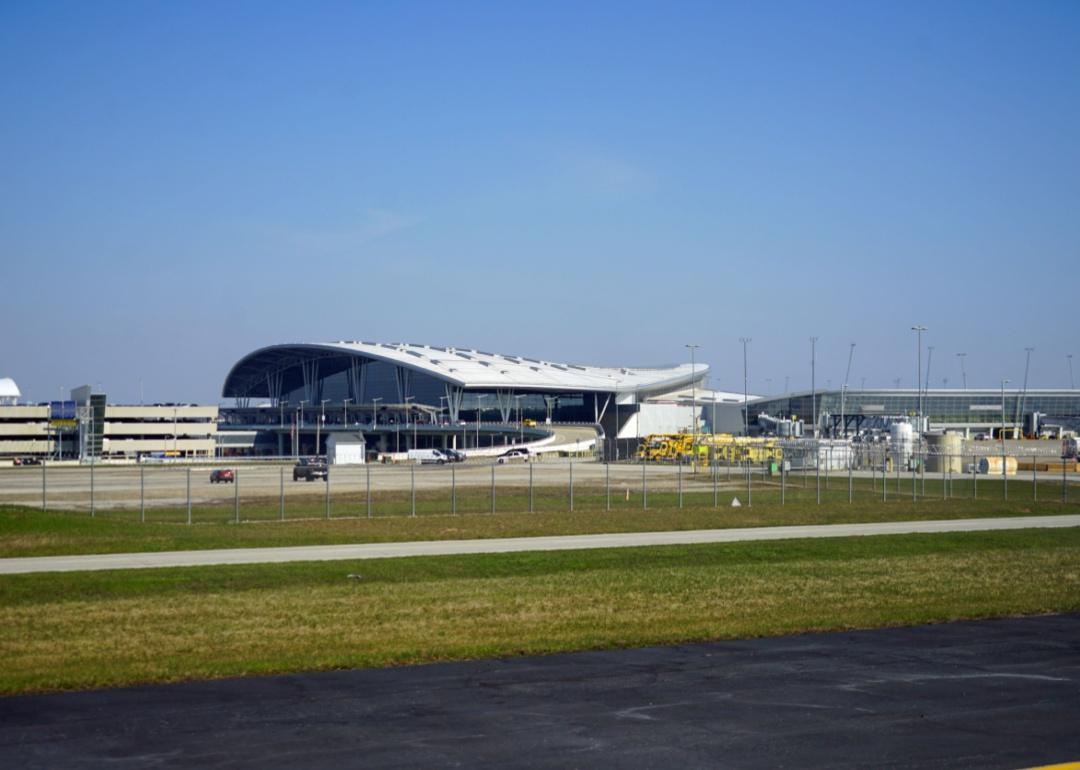
JKruggel at English Wikipedia // Wikimedia Commons
#50. Rochester, New York: Greater Rochester International
An aerial view of Greater Rochester International airport.
– Annual flights (August 2021-July 2022): 11,769
– On-time performance: 74.39%
– Air carrier delay: 10.2%
– Weather delay: 0.8%
– National Aviation System delay: 3.6%
– Security delay: 0.1%
– Aircraft arriving late delay: 7.2%
– Cancelled flights: 3.5%
– Diverted flights: 0.1%
Jeff Schultes // Shutterstock
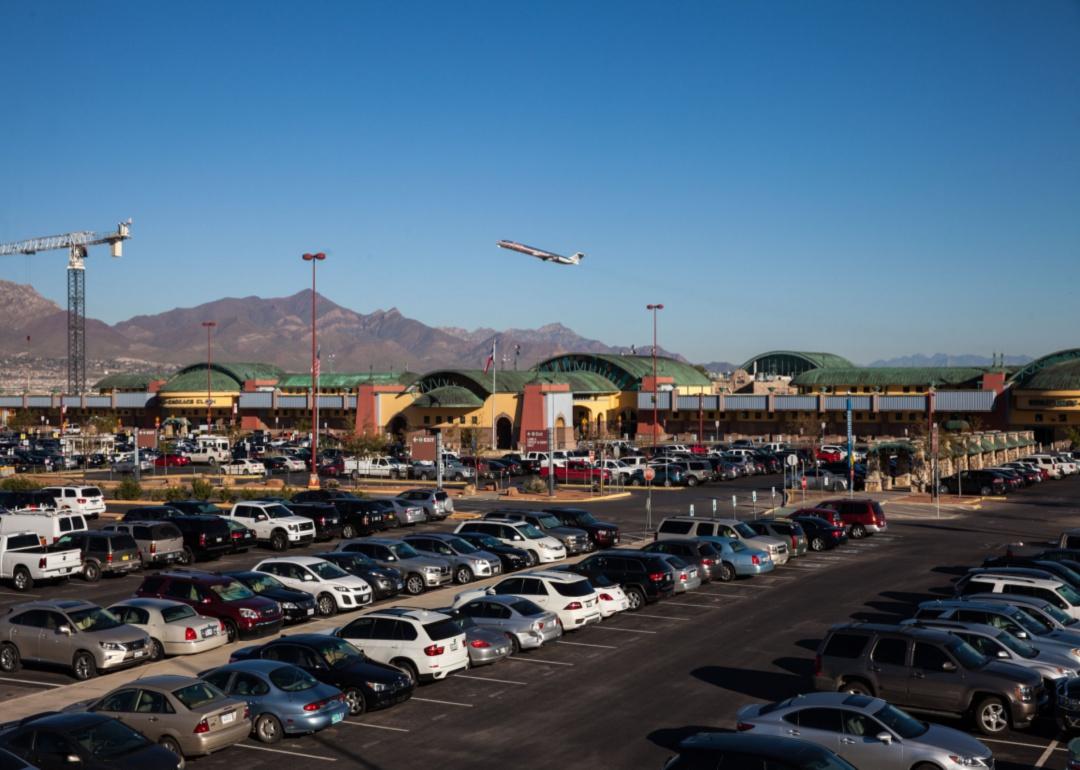
#49. El Paso, Texas: El Paso International
An airplane taking off over mountains behind the car-filled parking lot of El Paso airport.
– Annual flights (August 2021-July 2022): 16,517
– On-time performance: 74.37%
– Air carrier delay: 10.7%
– Weather delay: 0.5%
– National Aviation System delay: 2.1%
– Security delay: 0.0%
– Aircraft arriving late delay: 9.9%
– Cancelled flights: 2.2%
– Diverted flights: 0.1%
Edward Russell // Wikimedia Commons
#48. Asheville, North Carolina: Asheville Regional
An airplane pulls up to a jetbridge at Asheville Regional.
– Annual flights (August 2021-July 2022): 8,339
– On-time performance: 74.28%
– Air carrier delay: 7.0%
– Weather delay: 0.9%
– National Aviation System delay: 5.6%
– Security delay: 0.0%
– Aircraft arriving late delay: 9.0%
– Cancelled flights: 3.0%
– Diverted flights: 0.2%
Canva
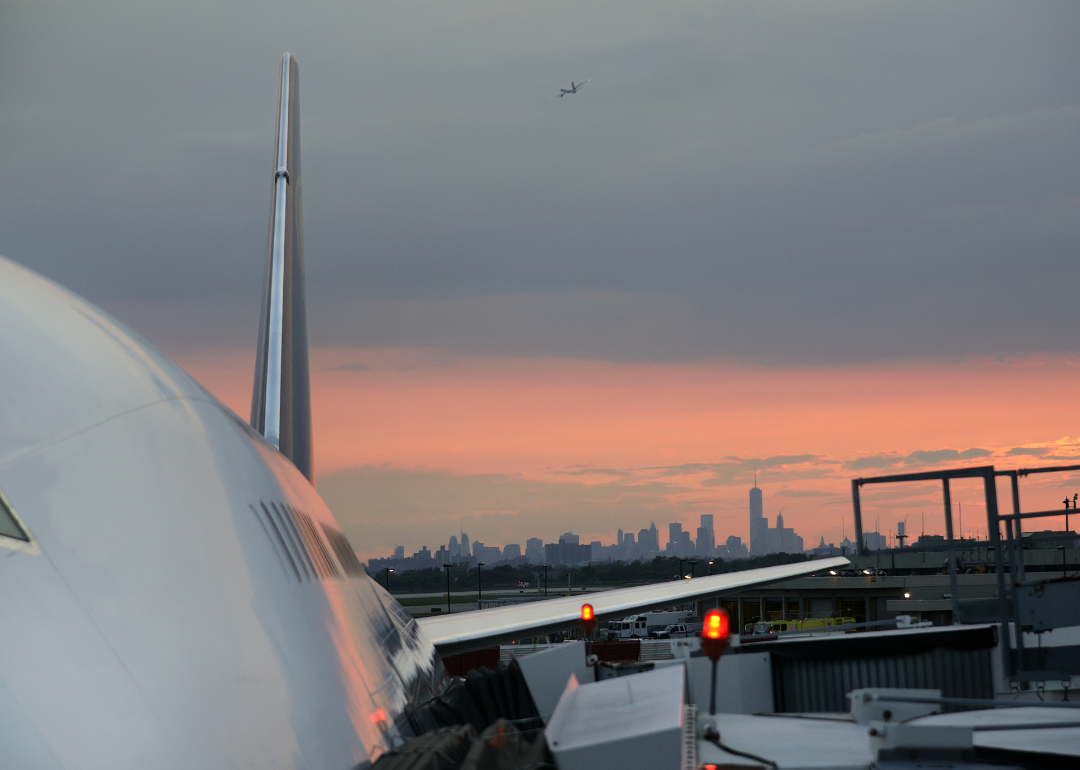
#47. New York, New York: John F. Kennedy International
The side of an aircraft parked with the NY skyline and sunset in the background.
– Annual flights (August 2021-July 2022): 122,765
– On-time performance: 73.82%
– Air carrier delay: 7.8%
– Weather delay: 0.5%
– National Aviation System delay: 6.9%
– Security delay: 0.1%
– Aircraft arriving late delay: 7.0%
– Cancelled flights: 3.6%
– Diverted flights: 0.3%
University of College // Shutterstock
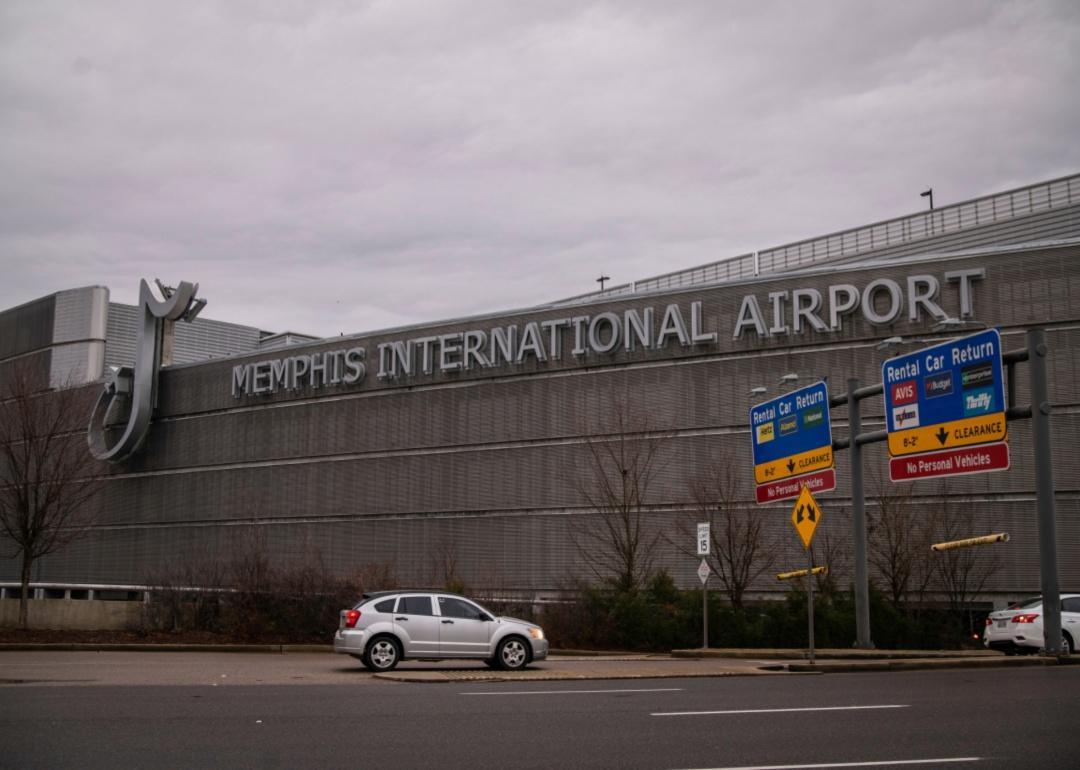
#46. Memphis, Tennessee: Memphis International
The Memphis International Airport sign on the side of a rounded building.
– Annual flights (August 2021-July 2022): 21,038
– On-time performance: 73.81%
– Air carrier delay: 11.0%
– Weather delay: 1.1%
– National Aviation System delay: 3.7%
– Security delay: 0.1%
– Aircraft arriving late delay: 7.3%
– Cancelled flights: 2.9%
– Diverted flights: 0.1%
You may also like: Main Street of America: Route 66 attractions state by state
PICTOR PICTURES // Shutterstock
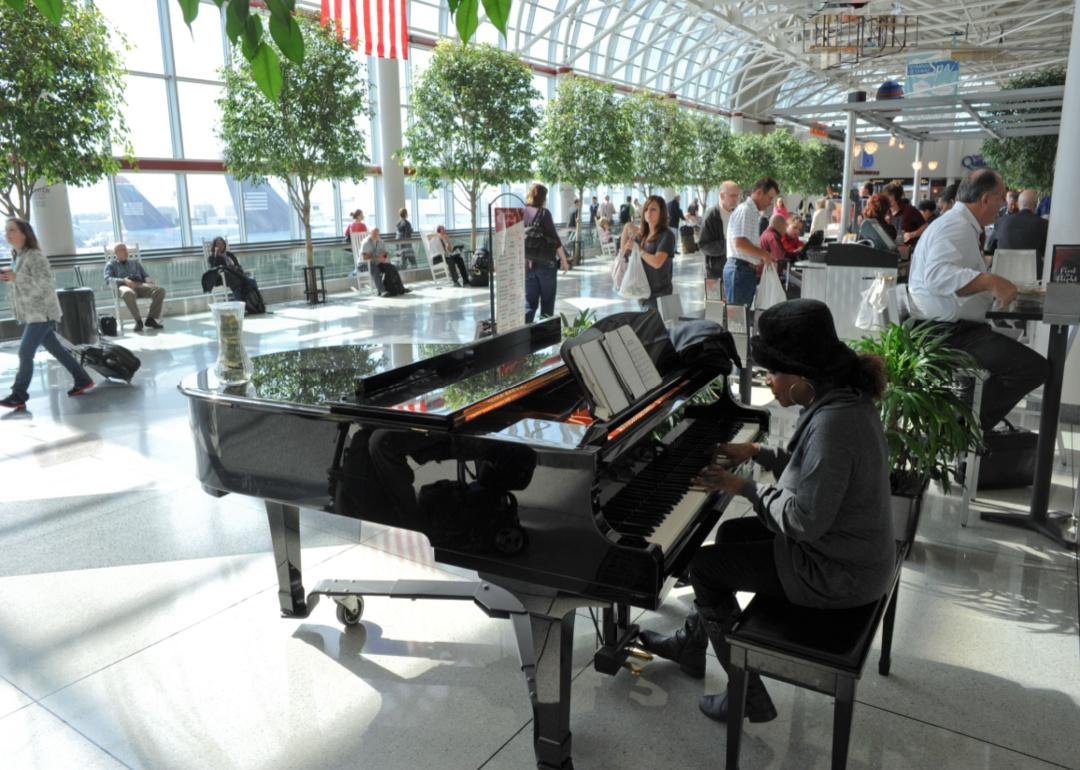
#45. Charleston, South Carolina: Charleston AFB/International
A bright atrium in the Charleston airport full of passengers in rocking chairs listening to a pianist.
– Annual flights (August 2021-July 2022): 25,615
– On-time performance: 73.77%
– Air carrier delay: 9.5%
– Weather delay: 0.6%
– National Aviation System delay: 6.0%
– Security delay: 0.1%
– Aircraft arriving late delay: 7.0%
– Cancelled flights: 2.9%
– Diverted flights: 0.2%
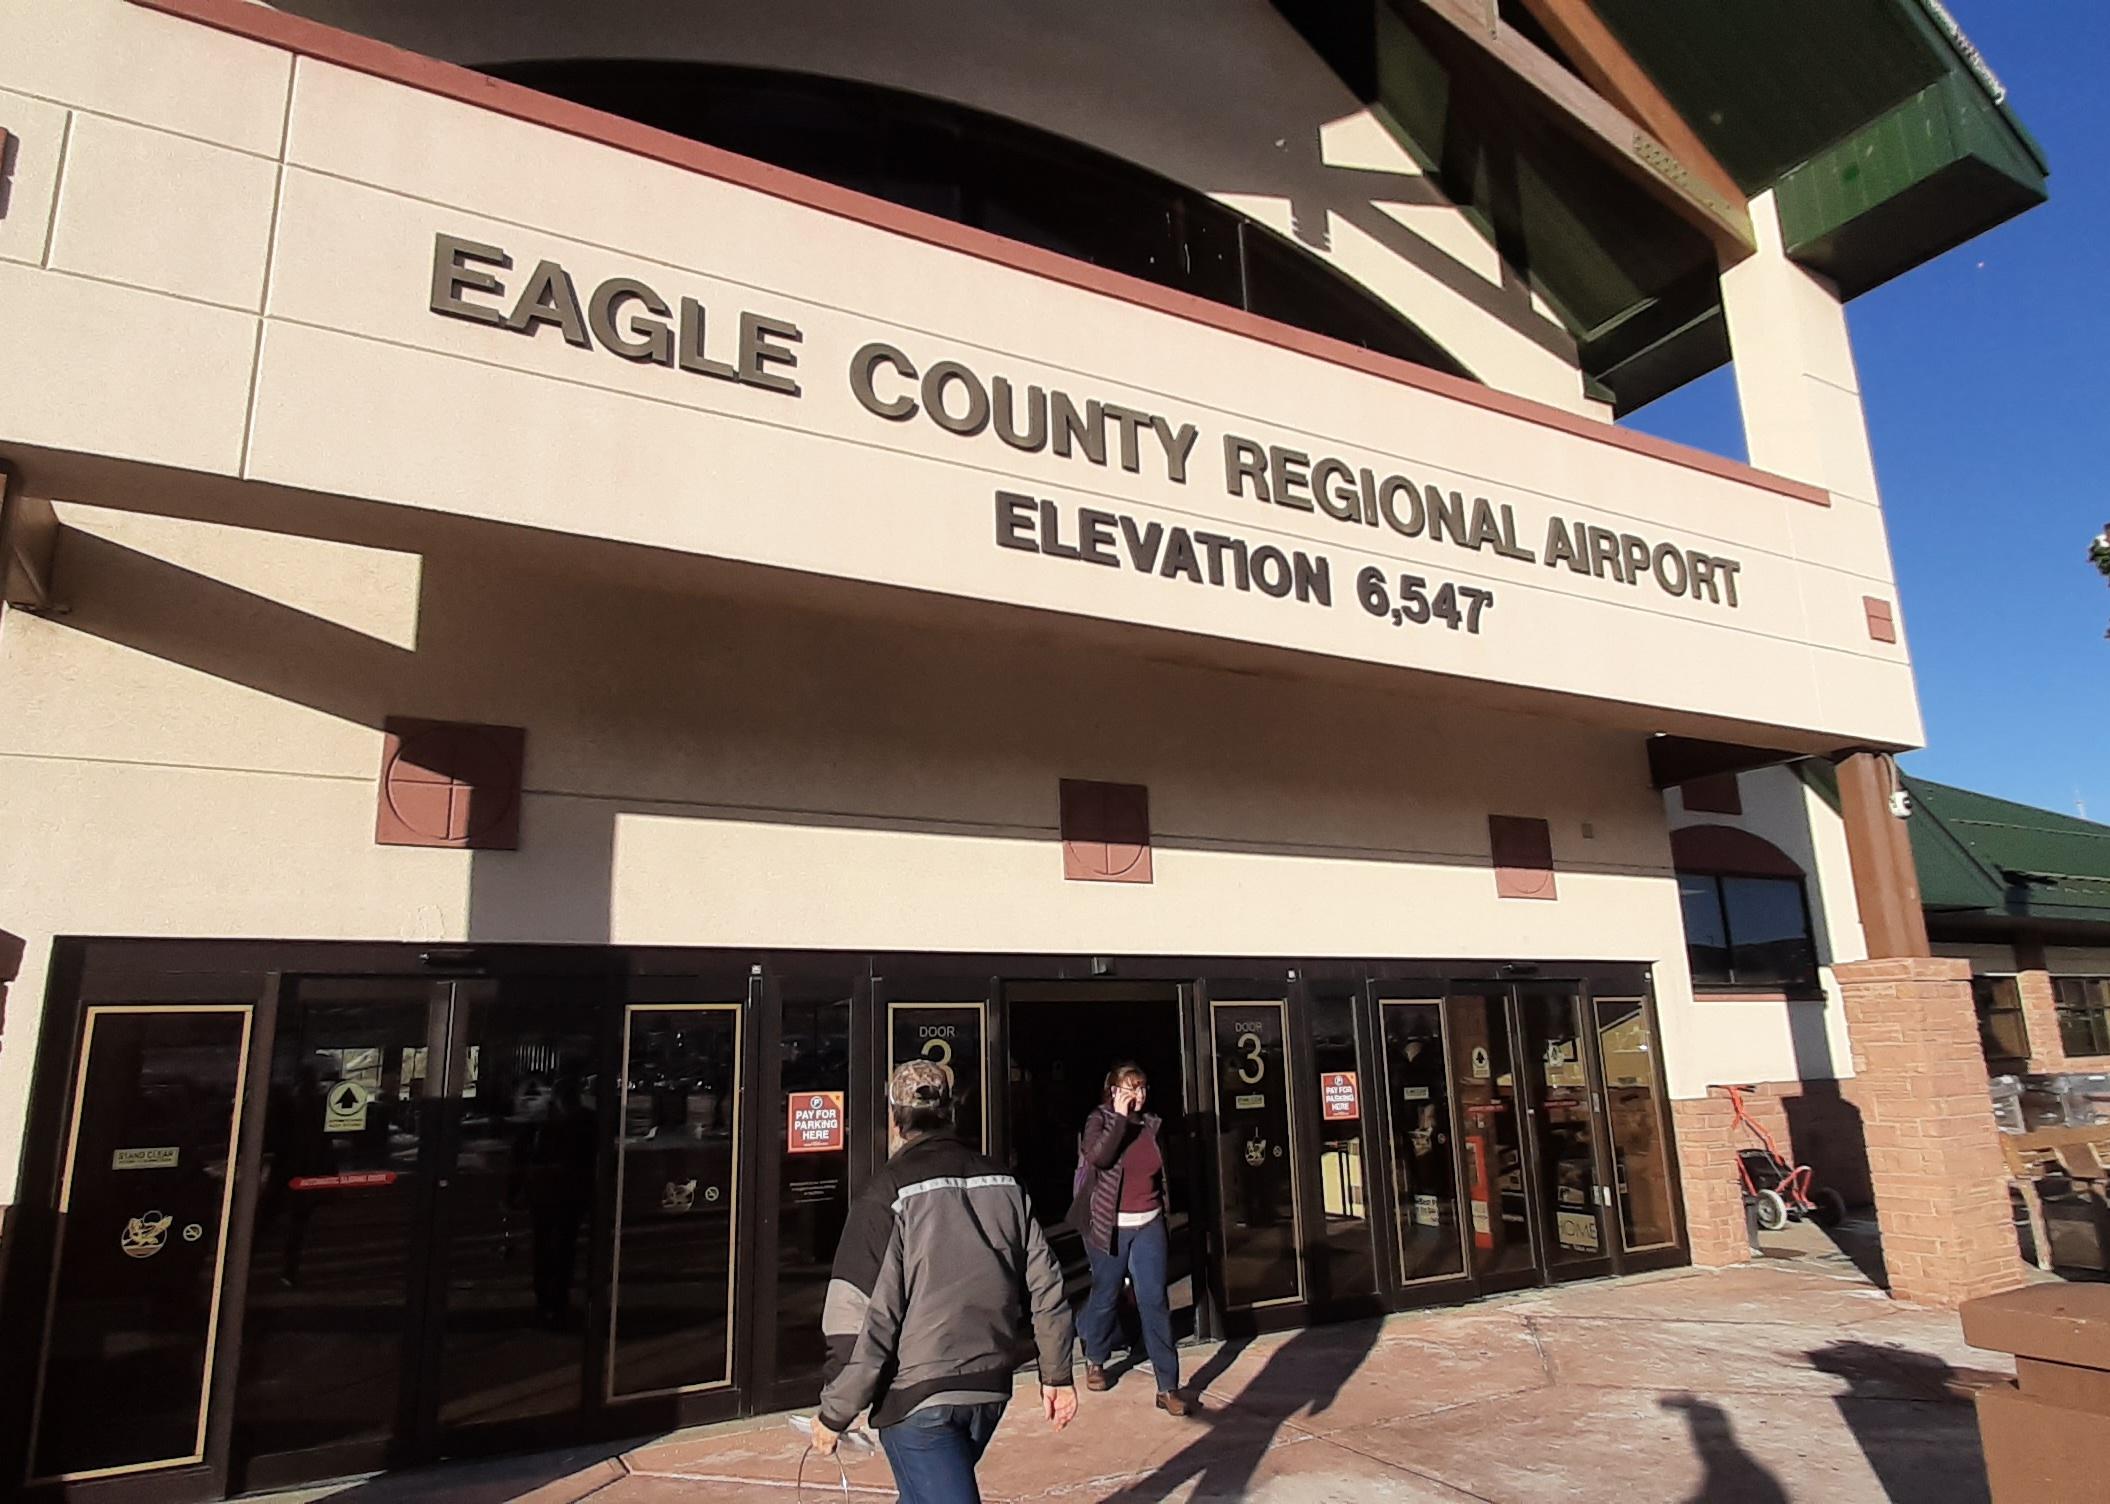
photo-denver // Shutterstock
#44. Eagle, Colorado: Eagle County Regional
The entrance to the Eagle County Regional airport building.
– Annual flights (August 2021-July 2022): 2,877
– On-time performance: 73.72%
– Air carrier delay: 10.4%
– Weather delay: 1.0%
– National Aviation System delay: 4.8%
– Security delay: 0.0%
– Aircraft arriving late delay: 4.2%
– Cancelled flights: 4.9%
– Diverted flights: 1.0%
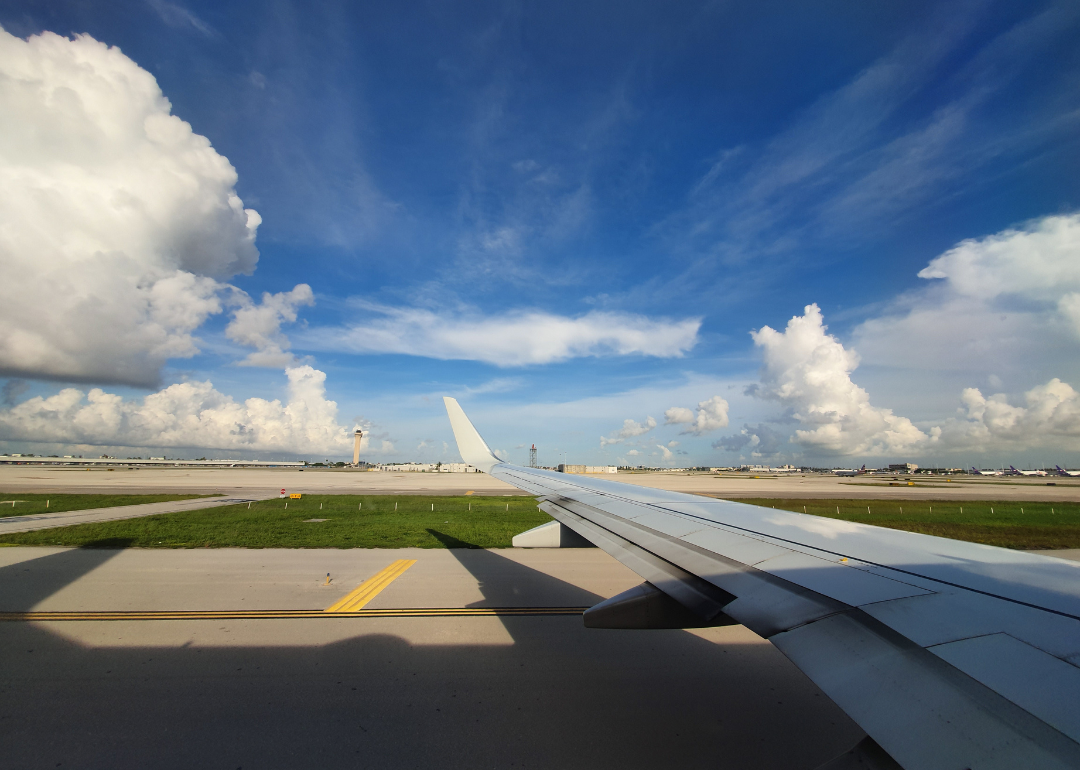
Canva
#43. Miami, Florida: Miami International
The wing of an airplane on a runway against a blue sky with clouds.
– Annual flights (August 2021-July 2022): 108,993
– On-time performance: 73.71%
– Air carrier delay: 7.9%
– Weather delay: 0.7%
– National Aviation System delay: 7.8%
– Security delay: 0.1%
– Aircraft arriving late delay: 6.7%
– Cancelled flights: 2.8%
– Diverted flights: 0.3%
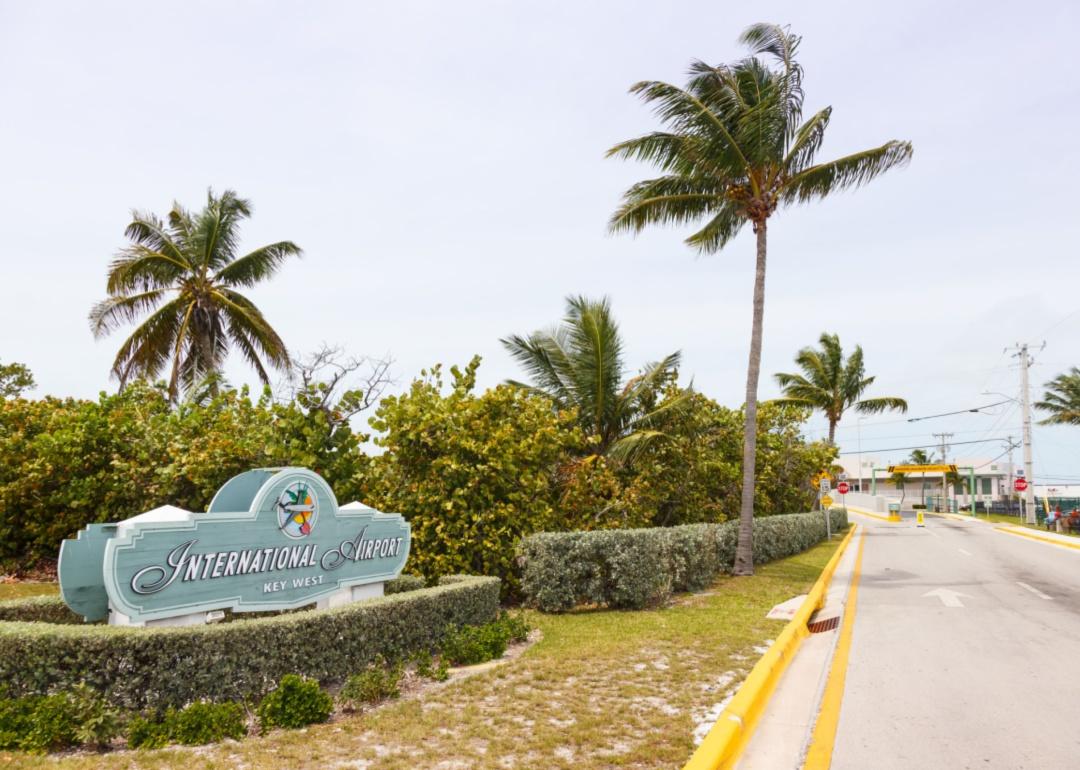
Markus Mainka // Shutterstock
#42. Key West, Florida: Key West International
Key West airport entrance sign with palm trees lining the road.
– Annual flights (August 2021-July 2022): 8,906
– On-time performance: 73.64%
– Air carrier delay: 6.4%
– Weather delay: 0.8%
– National Aviation System delay: 11.5%
– Security delay: 0.0%
– Aircraft arriving late delay: 3.8%
– Cancelled flights: 3.2%
– Diverted flights: 0.7%
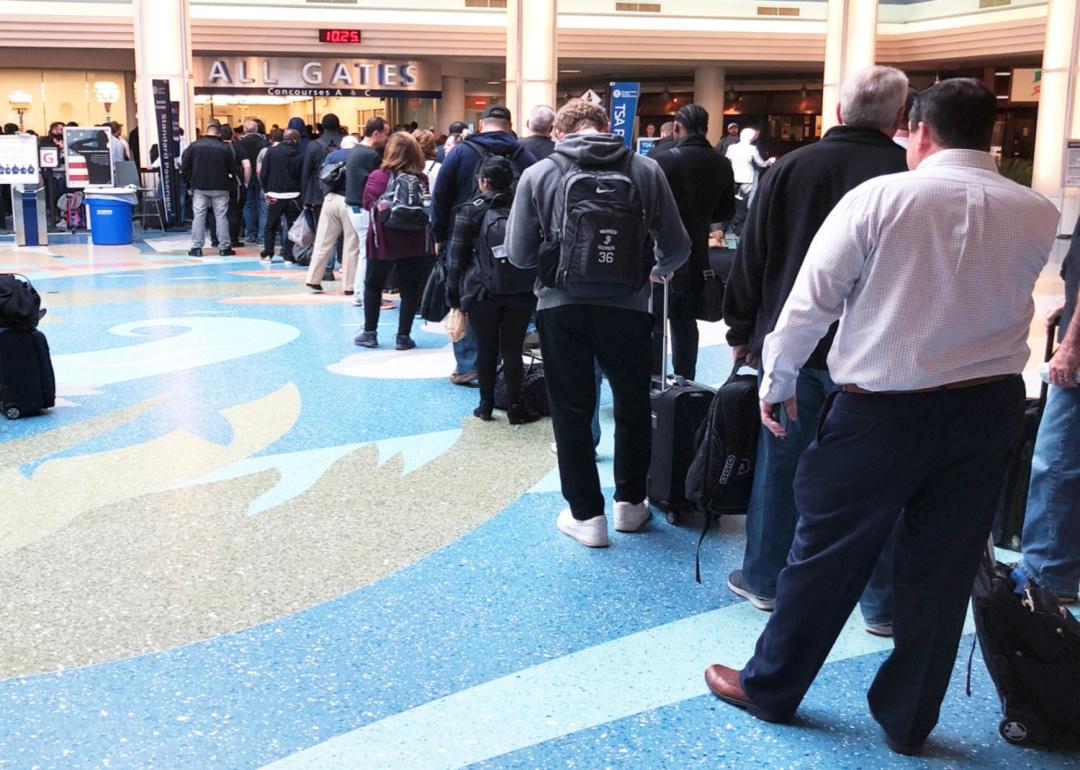
James R. Martin // Shutterstock
#41. Jacksonville, Florida: Jacksonville International
Long security lines at Jacksonville airport.
– Annual flights (August 2021-July 2022): 28,768
– On-time performance: 73.60%
– Air carrier delay: 10.6%
– Weather delay: 0.7%
– National Aviation System delay: 5.3%
– Security delay: 0.1%
– Aircraft arriving late delay: 7.0%
– Cancelled flights: 2.5%
– Diverted flights: 0.3%
You may also like: What 50 top tourist destinations looked like 50 years ago
Kate Scott // Shutterstock
#40. Norfolk, Virginia: Norfolk International
An airplane connected to a jet bridge at Norfolk airport.
– Annual flights (August 2021-July 2022): 21,329
– On-time performance: 73.59%
– Air carrier delay: 9.3%
– Weather delay: 1.0%
– National Aviation System delay: 5.0%
– Security delay: 0.0%
– Aircraft arriving late delay: 7.6%
– Cancelled flights: 3.3%
– Diverted flights: 0.3%
University of College // Shutterstock
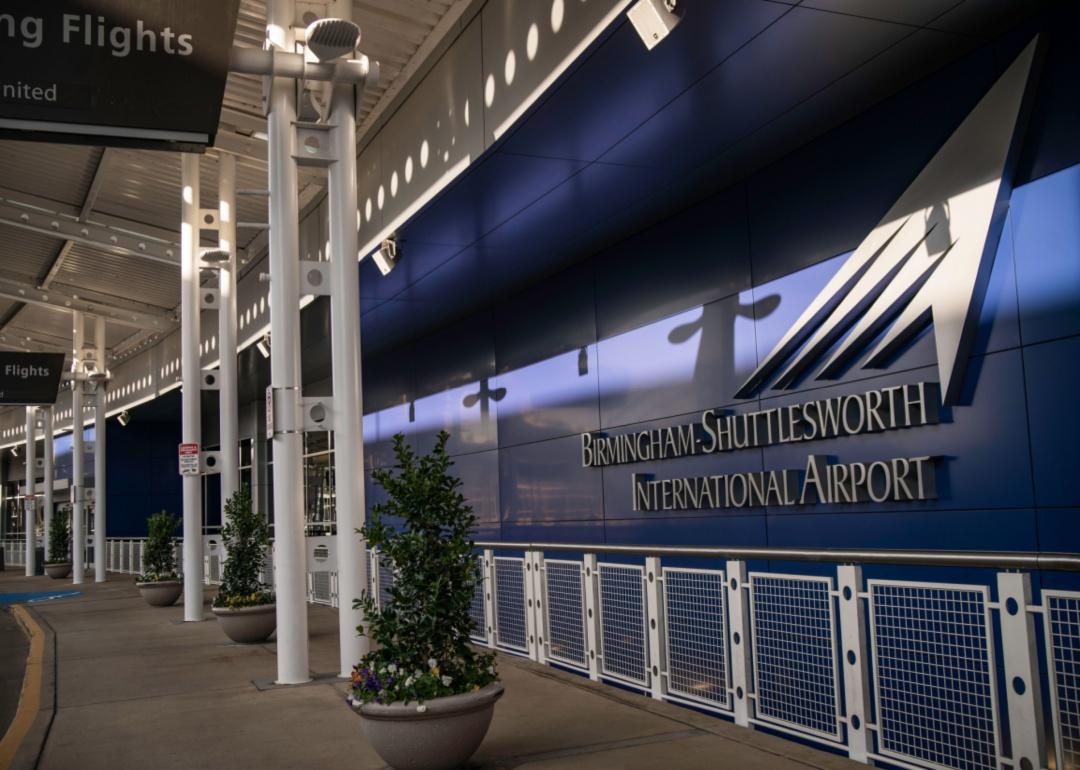
#39. Birmingham, Alabama: Birmingham-Shuttlesworth International
The blue building and entrance to Birmingham airport.
– Annual flights (August 2021-July 2022): 14,397
– On-time performance: 73.59%
– Air carrier delay: 10.5%
– Weather delay: 1.0%
– National Aviation System delay: 4.7%
– Security delay: 0.0%
– Aircraft arriving late delay: 7.8%
– Cancelled flights: 2.0%
– Diverted flights: 0.3%
Popova Valeriya // Shutterstock
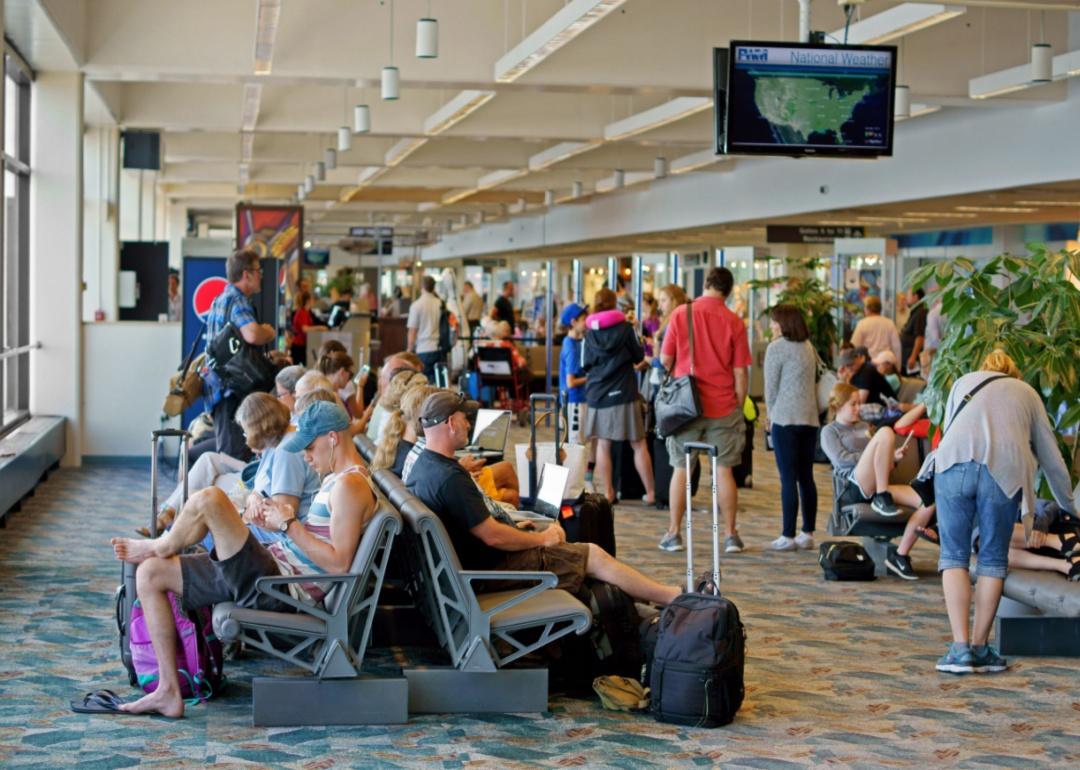
#38. Portland, Maine: Portland International Jetport
People seated at a gate and waiting in line for flights.
– Annual flights (August 2021-July 2022): 10,523
– On-time performance: 73.31%
– Air carrier delay: 8.8%
– Weather delay: 0.6%
– National Aviation System delay: 5.1%
– Security delay: 0.0%
– Aircraft arriving late delay: 7.1%
– Cancelled flights: 4.6%
– Diverted flights: 0.6%
Thomas Barrat // Shutterstock
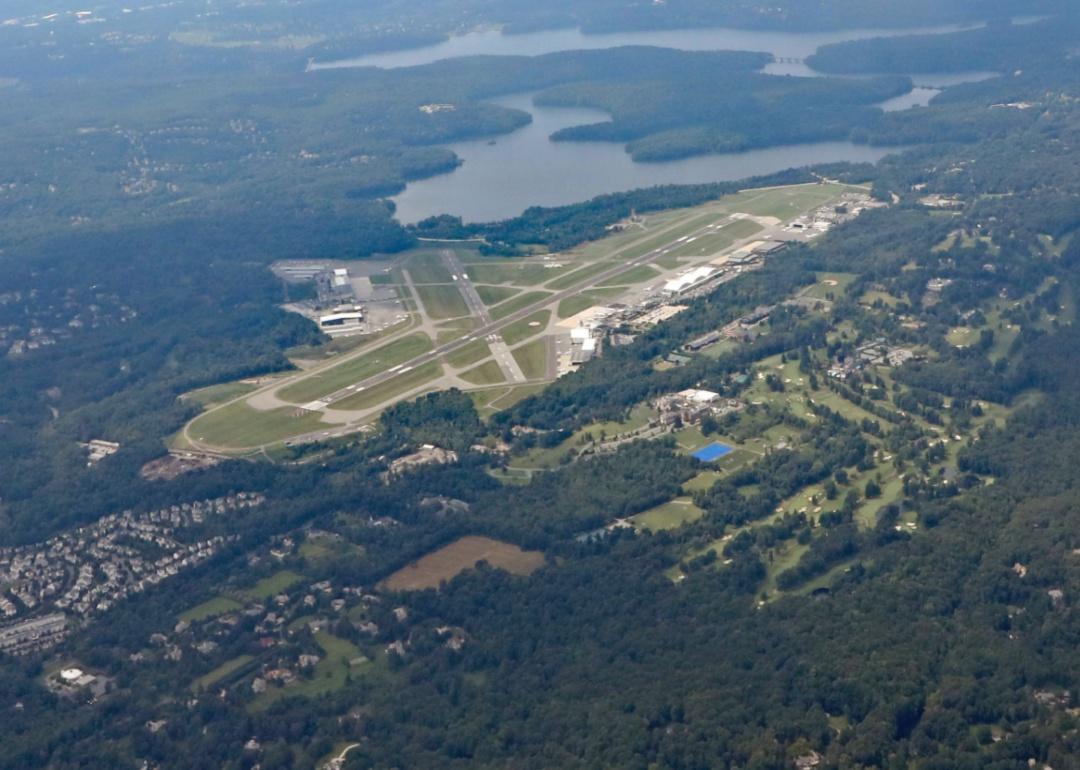
#37. White Plains, New York: Westchester County
Aerial view of the Westchester County airport surrounded by trees and lakes.
– Annual flights (August 2021-July 2022): 10,207
– On-time performance: 73.28%
– Air carrier delay: 9.2%
– Weather delay: 1.0%
– National Aviation System delay: 4.5%
– Security delay: 0.1%
– Aircraft arriving late delay: 7.2%
– Cancelled flights: 3.7%
– Diverted flights: 1.0%
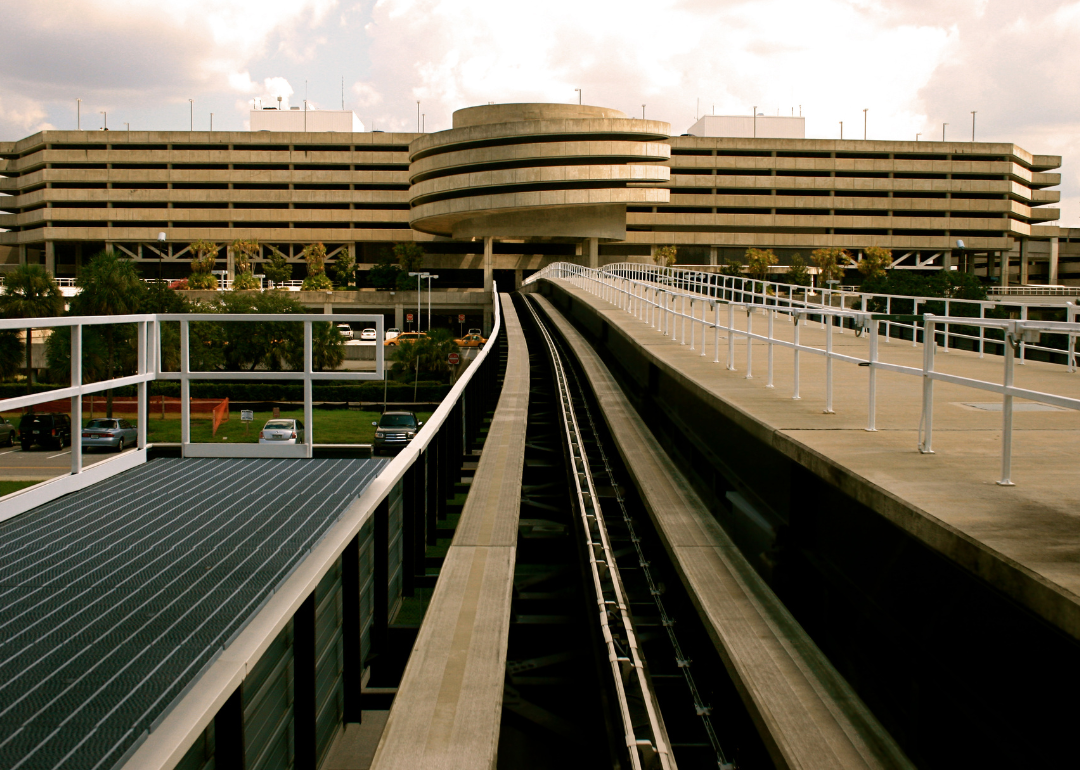
Canva
#36. Tampa, Florida: Tampa International
The subway tracks leading to a concrete building at Tampa airport.
– Annual flights (August 2021-July 2022): 73,897
– On-time performance: 73.12%
– Air carrier delay: 9.2%
– Weather delay: 0.5%
– National Aviation System delay: 6.1%
– Security delay: 0.1%
– Aircraft arriving late delay: 7.9%
– Cancelled flights: 2.7%
– Diverted flights: 0.3%
You may also like: Stunning, historic hotels from every state and the stories behind them
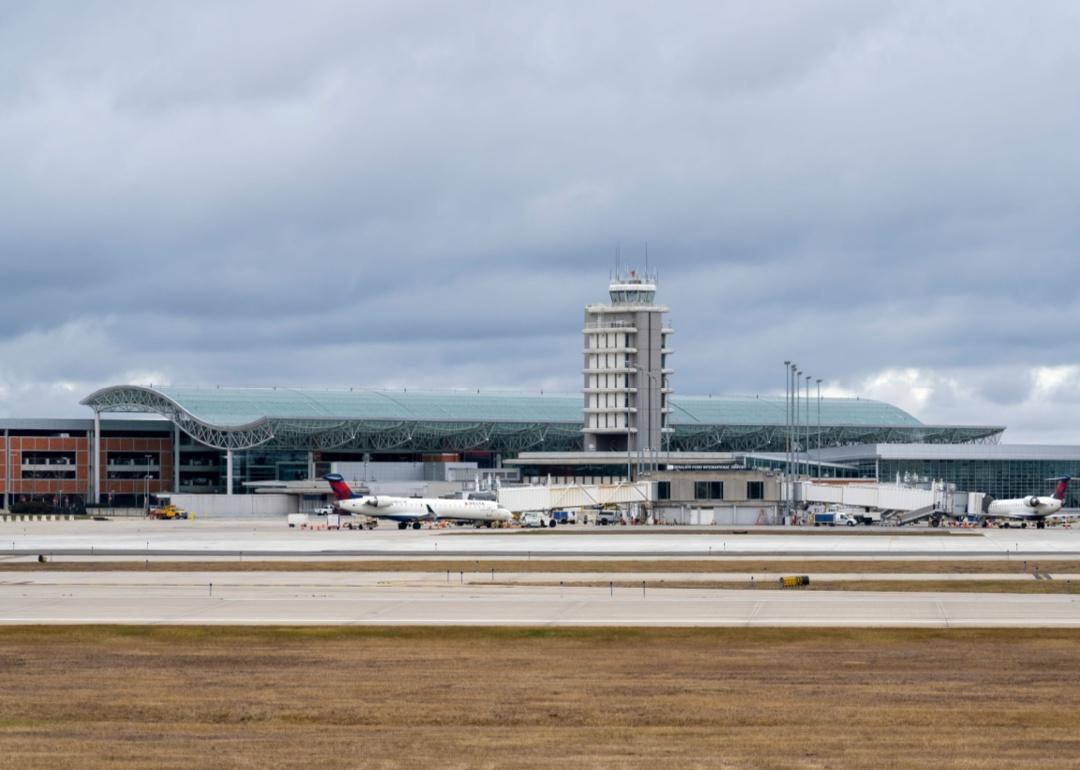
Ayman Haykal // Shutterstock
#35. Grand Rapids, Michigan: Gerald R. Ford International
Outside the Gerald R. Ford airport with a curved glass awning over the building.
– Annual flights (August 2021-July 2022): 16,051
– On-time performance: 73.01%
– Air carrier delay: 10.6%
– Weather delay: 1.3%
– National Aviation System delay: 4.0%
– Security delay: 0.1%
– Aircraft arriving late delay: 7.9%
– Cancelled flights: 3.0%
– Diverted flights: 0.1%
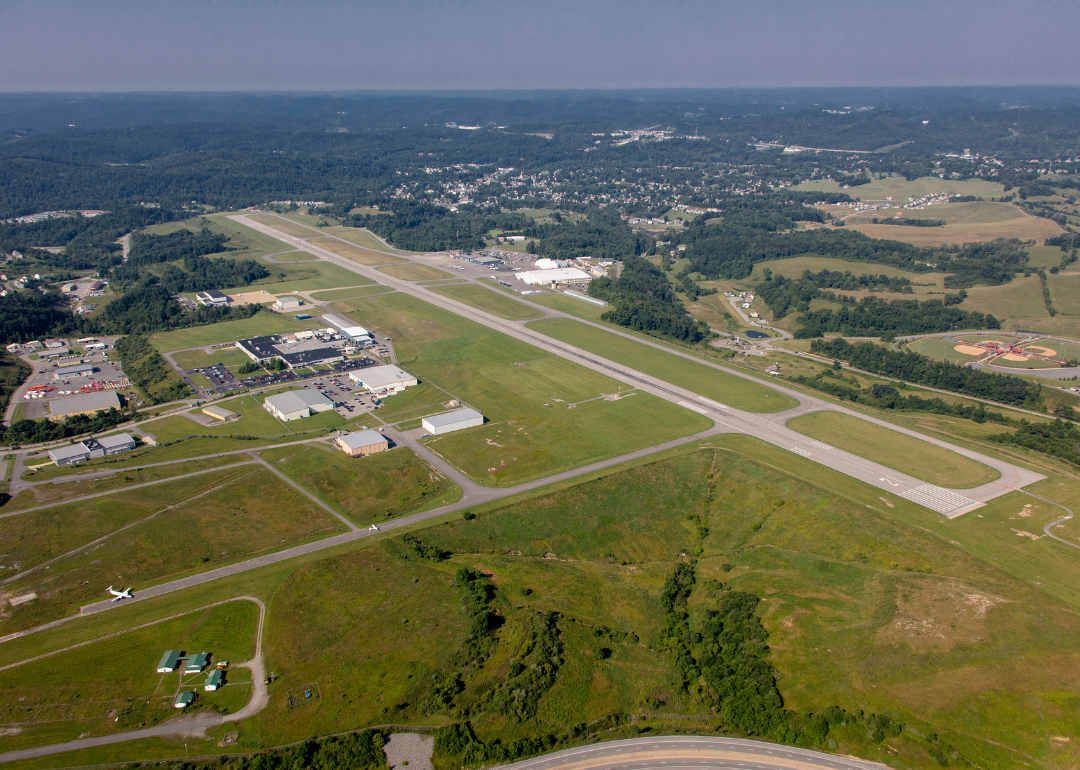
Canva
#34. Clarksburg/Fairmont, West Virginia: North Central West Virginia
An aerial view of North Central West Virginia.
– Annual flights (August 2021-July 2022): 1,025
– On-time performance: 72.88%
– Air carrier delay: 13.3%
– Weather delay: 1.7%
– National Aviation System delay: 1.7%
– Security delay: 0.0%
– Aircraft arriving late delay: 5.6%
– Cancelled flights: 4.3%
– Diverted flights: 0.6%
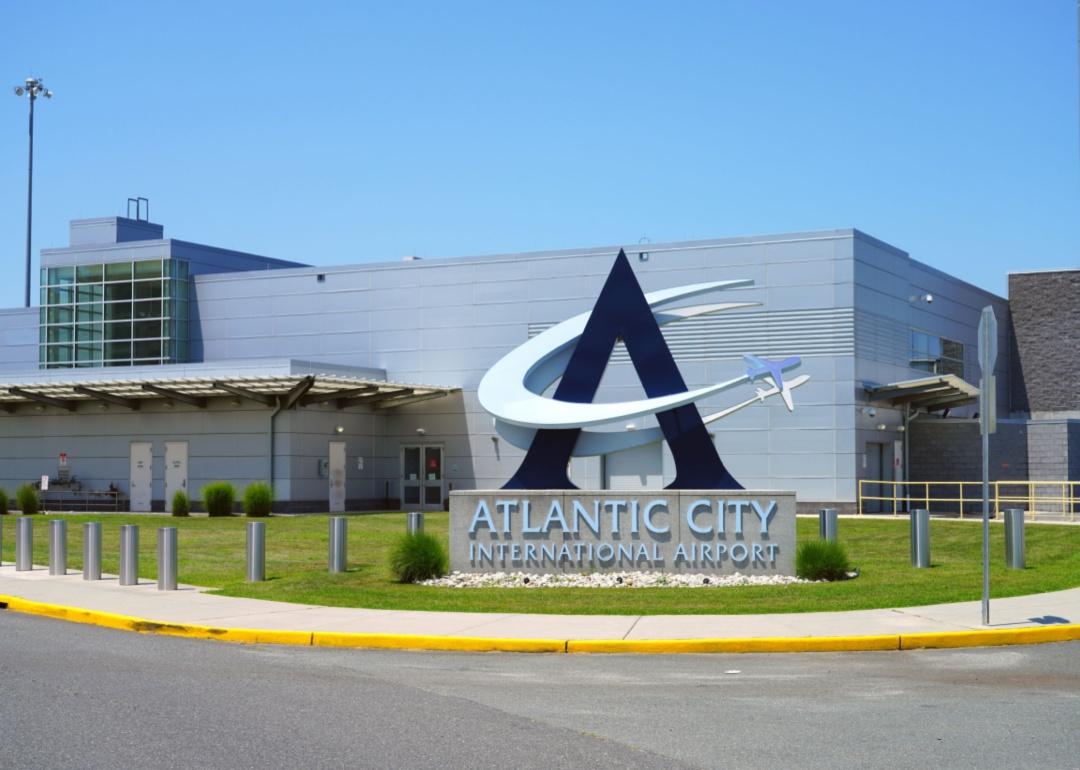
EQRoy // Shutterstock
#33. Atlantic City, New Jersey: Atlantic City International
The sign in front of the Antlantic City International airport.
– Annual flights (August 2021-July 2022): 3,306
– On-time performance: 72.87%
– Air carrier delay: 7.3%
– Weather delay: 0.9%
– National Aviation System delay: 7.7%
– Security delay: 0.7%
– Aircraft arriving late delay: 6.1%
– Cancelled flights: 4.4%
– Diverted flights: 0.1%
Elliott Cowand Jr. // Shutterstock
#32. New Orleans, Louisiana: Louis Armstrong New Orleans International
A busy security checkpoint.
– Annual flights (August 2021-July 2022): 45,004
– On-time performance: 72.70%
– Air carrier delay: 8.9%
– Weather delay: 0.6%
– National Aviation System delay: 4.2%
– Security delay: 0.1%
– Aircraft arriving late delay: 7.9%
– Cancelled flights: 5.2%
– Diverted flights: 0.3%
Creative Commons // Wikimedia Commons
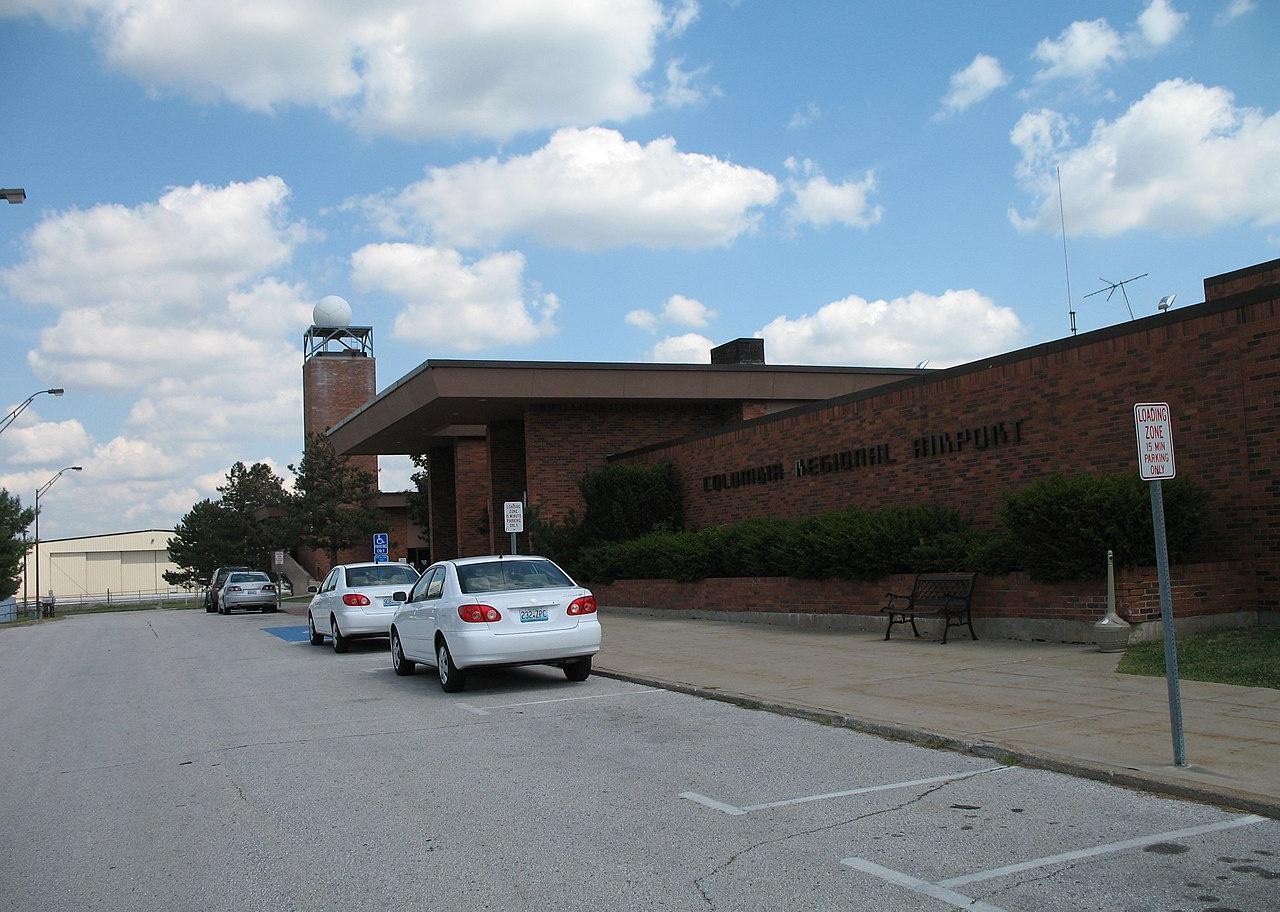
#31. Columbia, Missouri: Columbia Regional
The small brick building entrance to Columbia Regional.
– Annual flights (August 2021-July 2022): 1,594
– On-time performance: 72.65%
– Air carrier delay: 7.6%
– Weather delay: 1.9%
– National Aviation System delay: 0.6%
– Security delay: 0.1%
– Aircraft arriving late delay: 10.9%
– Cancelled flights: 5.6%
– Diverted flights: 0.6%
You may also like: 30 incredible photos that show the true power of nature
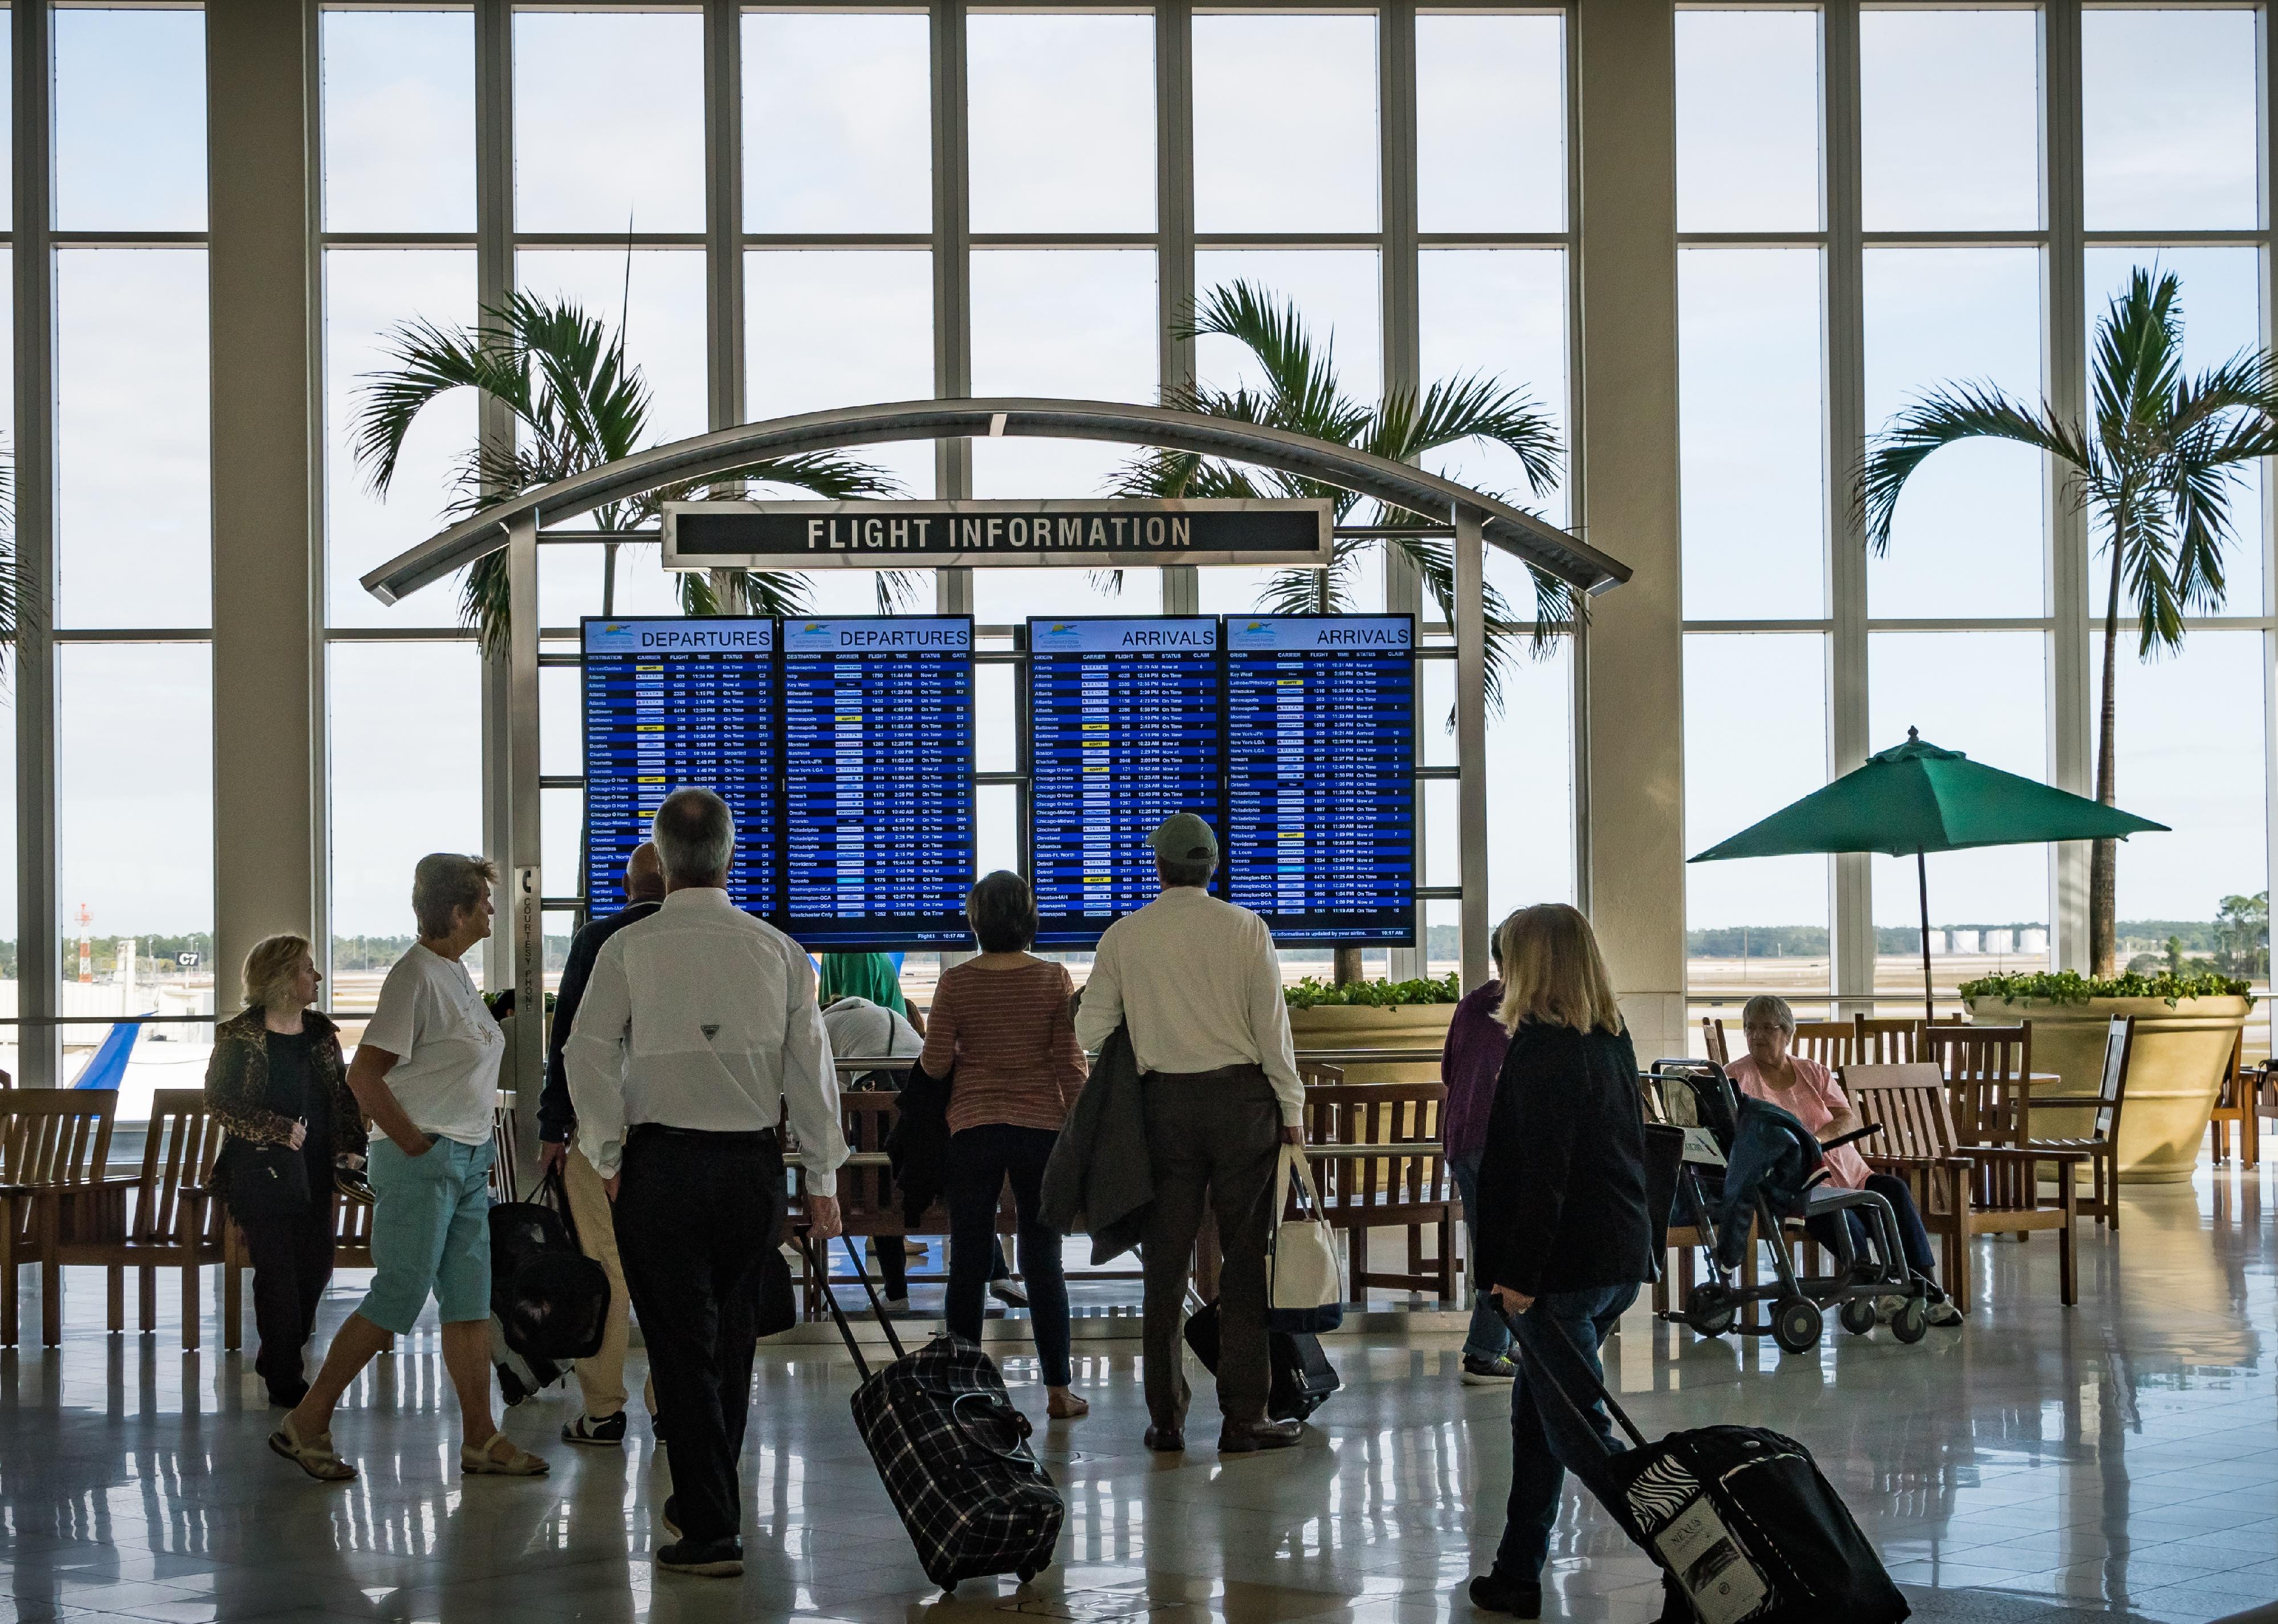
jo Crebbin // Shutterstock
#30. Fort Myers, Florida: Southwest Florida International
An open atrium with tall floor to ceiling windows and palm trees outside.
– Annual flights (August 2021-July 2022): 40,109
– On-time performance: 72.57%
– Air carrier delay: 9.1%
– Weather delay: 0.5%
– National Aviation System delay: 7.5%
– Security delay: 0.1%
– Aircraft arriving late delay: 7.0%
– Cancelled flights: 3.0%
– Diverted flights: 0.4%
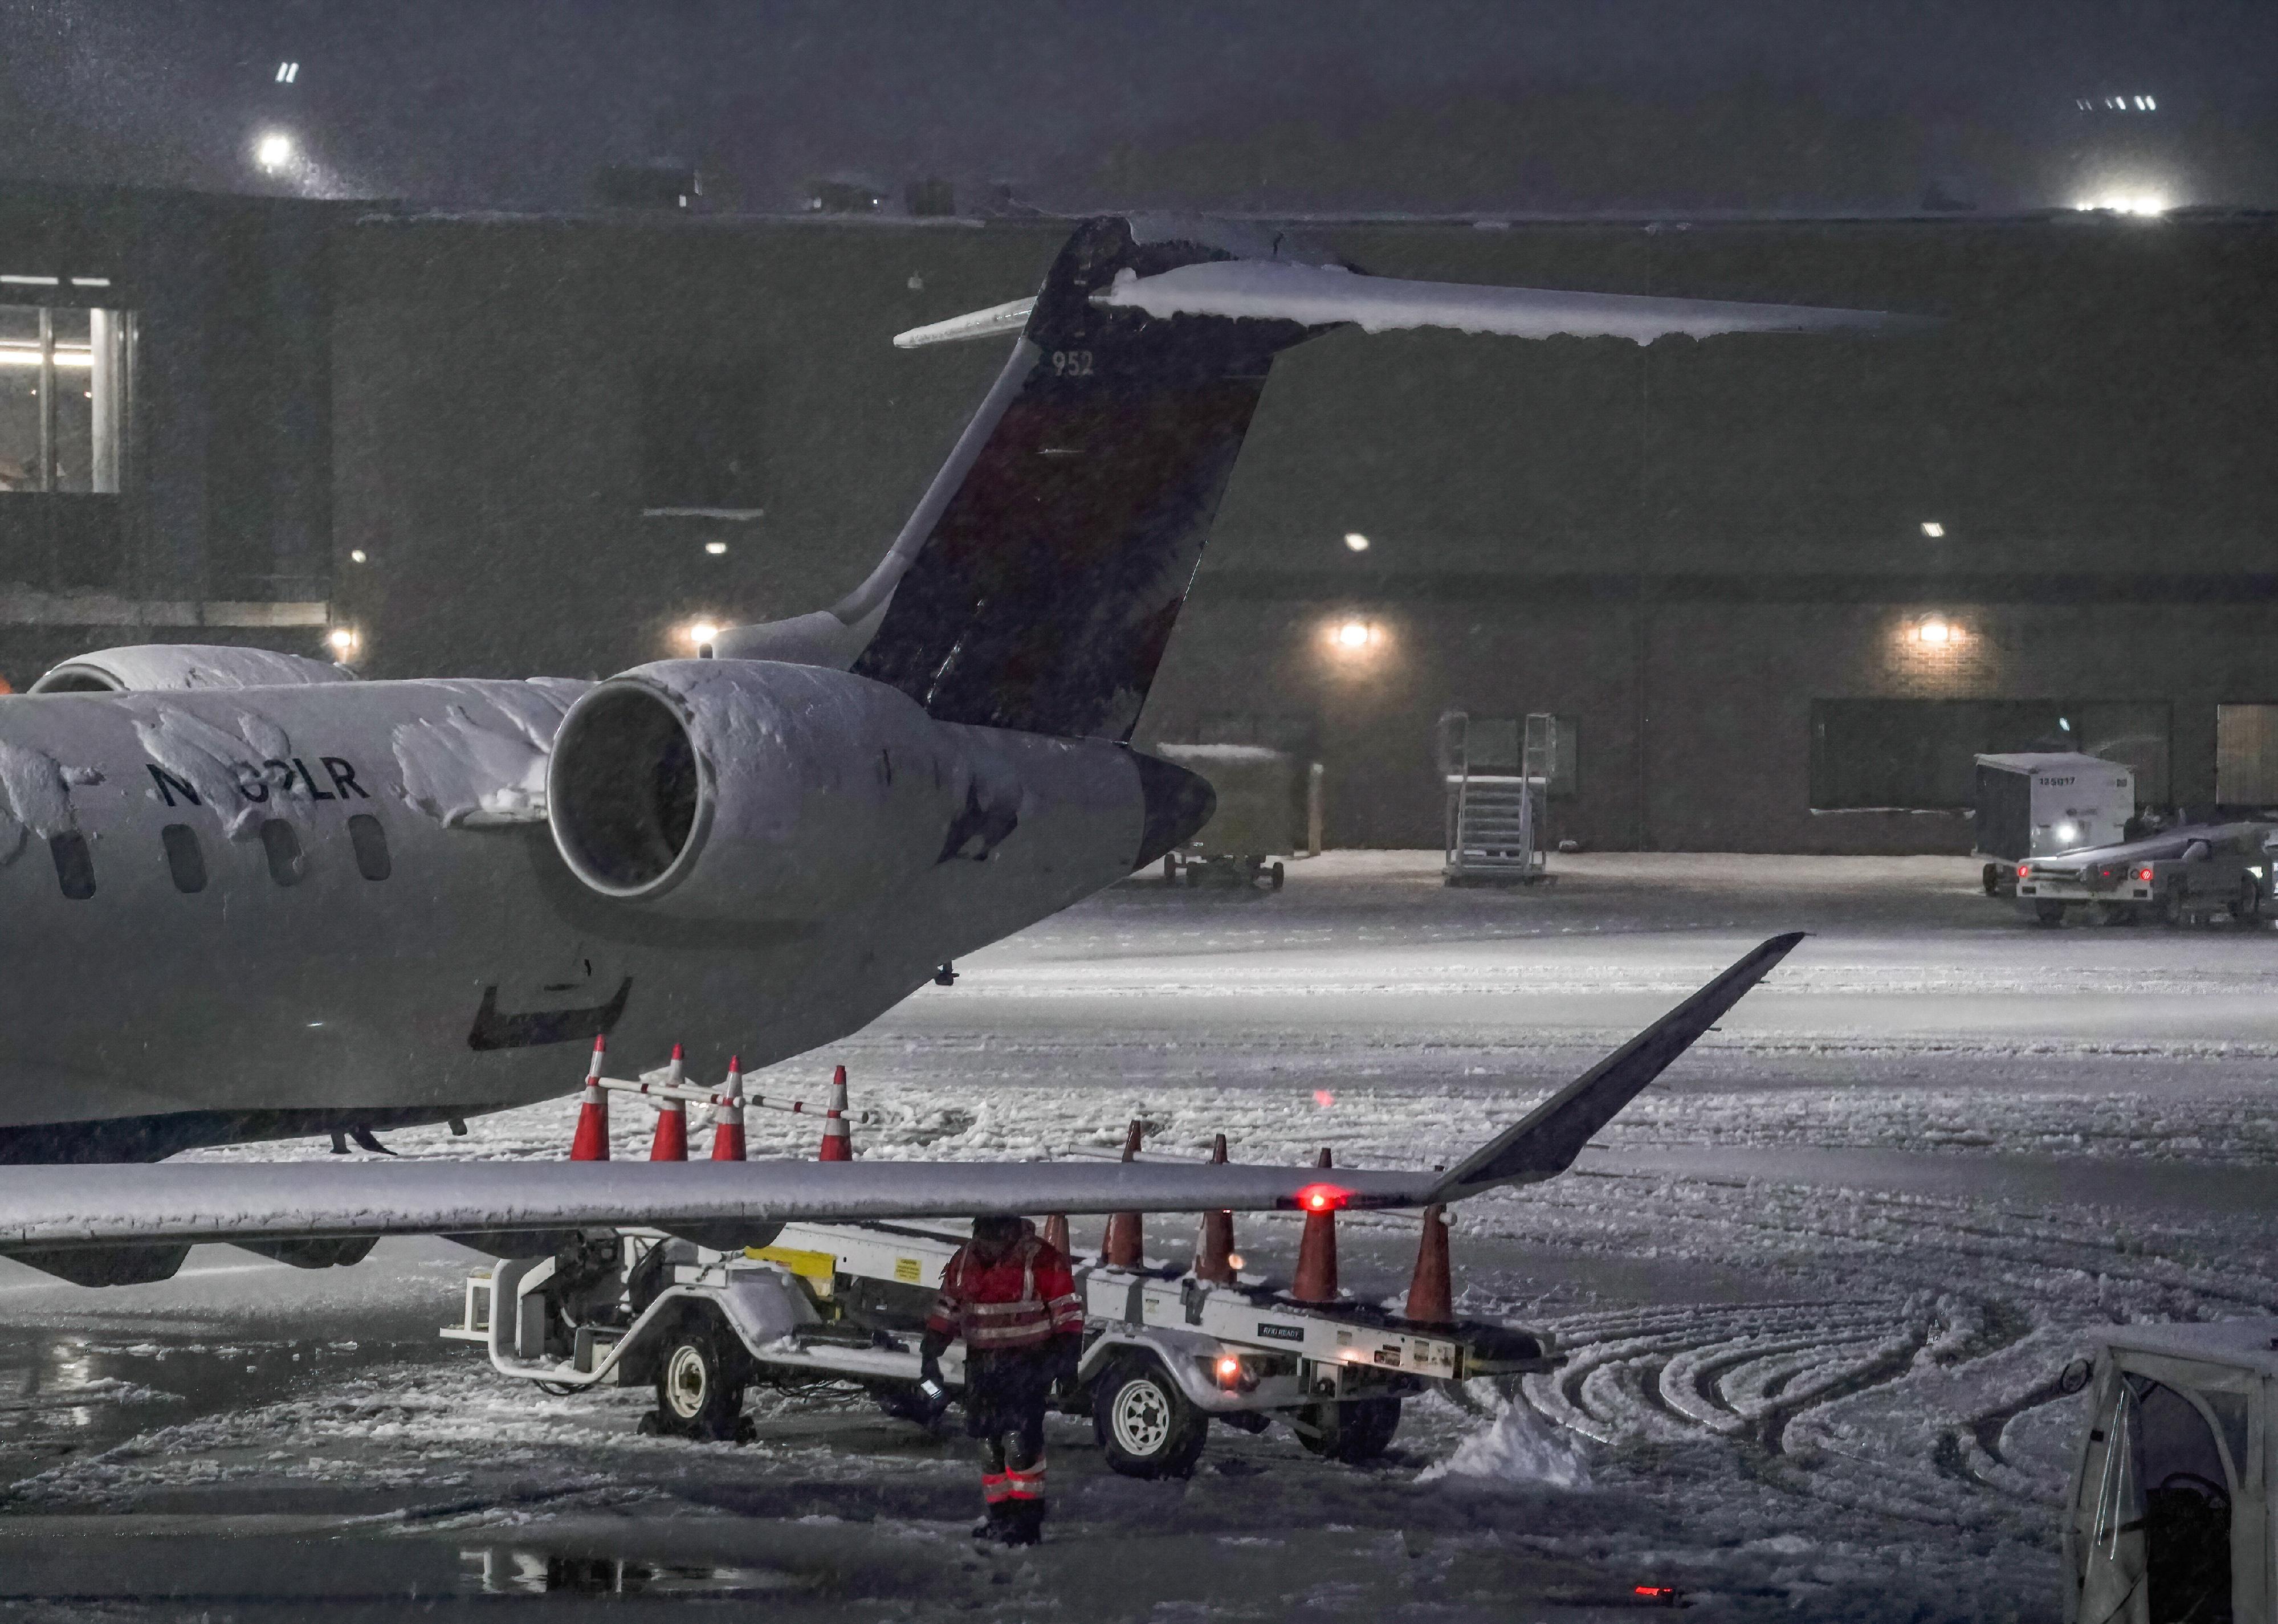
Camilo Freedman/SOPA Images/LightRocket // Getty Images
#29. Albany, New York: Albany International
An airport employee working in a snowstorm next to an airplane.
– Annual flights (August 2021-July 2022): 11,261
– On-time performance: 72.47%
– Air carrier delay: 11.6%
– Weather delay: 0.9%
– National Aviation System delay: 3.8%
– Security delay: 0.1%
– Aircraft arriving late delay: 7.7%
– Cancelled flights: 3.2%
– Diverted flights: 0.2%
EEJCC // Wikimedia Commons
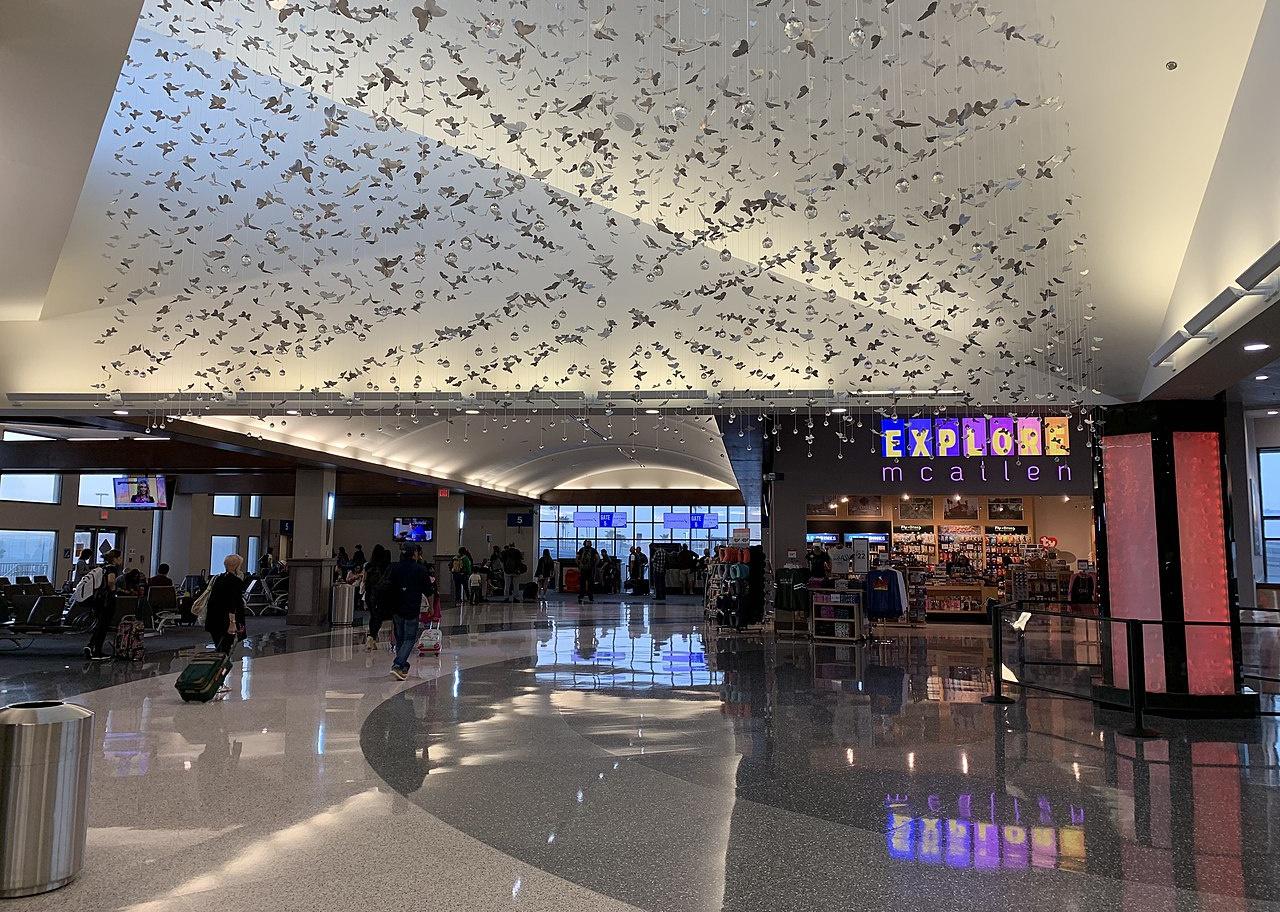
#28. Mission/McAllen/Edinburg, Texas: McAllen Miller International
Interior of the McAllen airport with butterflies hanging from the ceiling.
– Annual flights (August 2021-July 2022): 4,028
– On-time performance: 72.42%
– Air carrier delay: 10.4%
– Weather delay: 1.0%
– National Aviation System delay: 3.2%
– Security delay: 0.1%
– Aircraft arriving late delay: 9.6%
– Cancelled flights: 3.3%
– Diverted flights: 0.0%
JHVEPhoto // Shutterstock
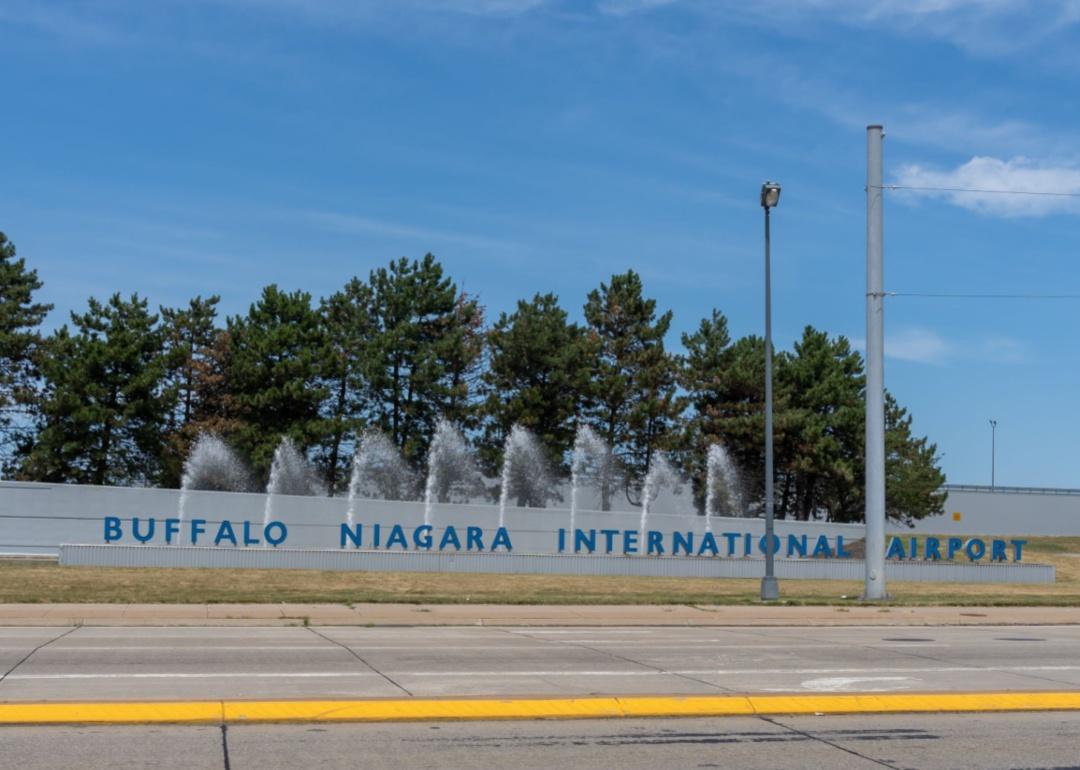
#27. Buffalo, New York: Buffalo Niagara International
The entrance sign to Buffalo Niagara airport with a water fountain.
– Annual flights (August 2021-July 2022): 18,717
– On-time performance: 72.24%
– Air carrier delay: 10.9%
– Weather delay: 0.7%
– National Aviation System delay: 4.5%
– Security delay: 0.1%
– Aircraft arriving late delay: 7.9%
– Cancelled flights: 3.5%
– Diverted flights: 0.1%
The Hartford Guy // Wikimedia Commons
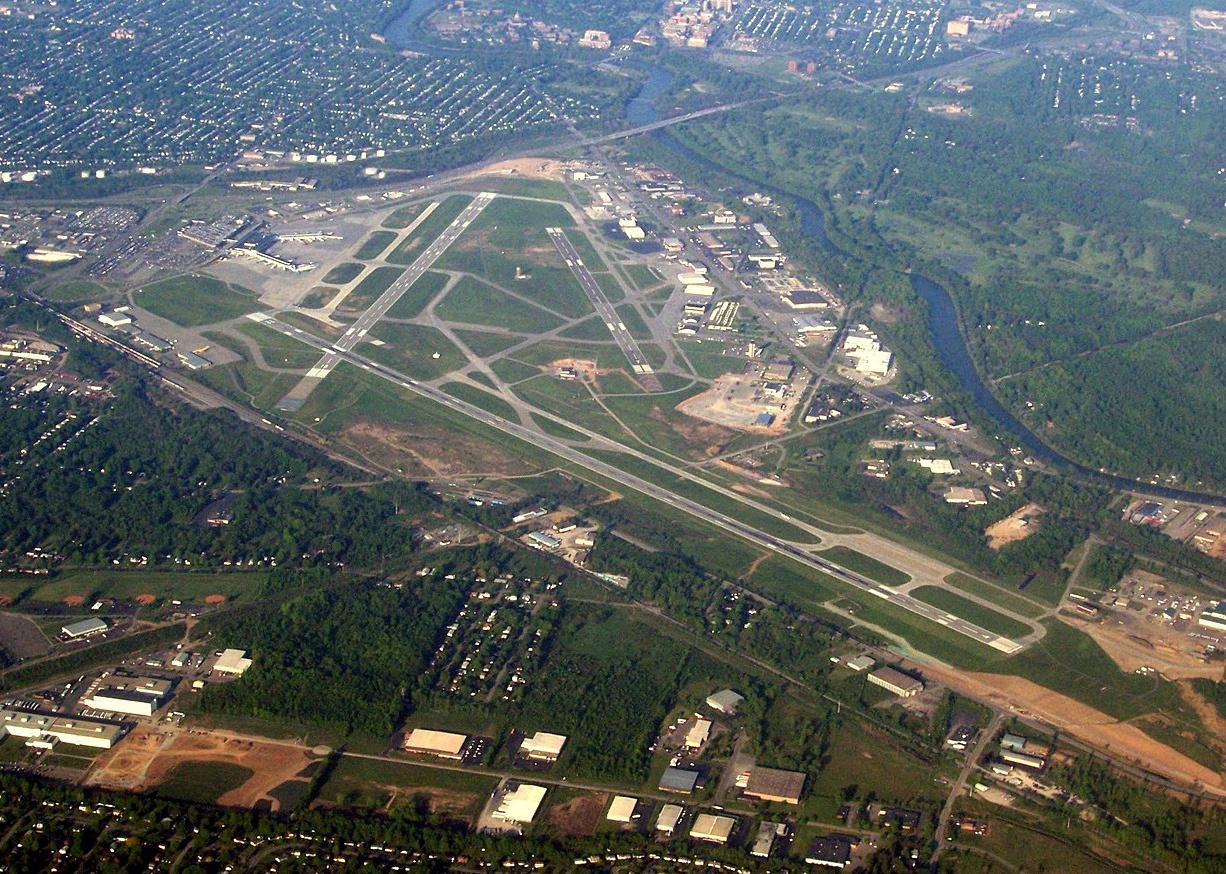
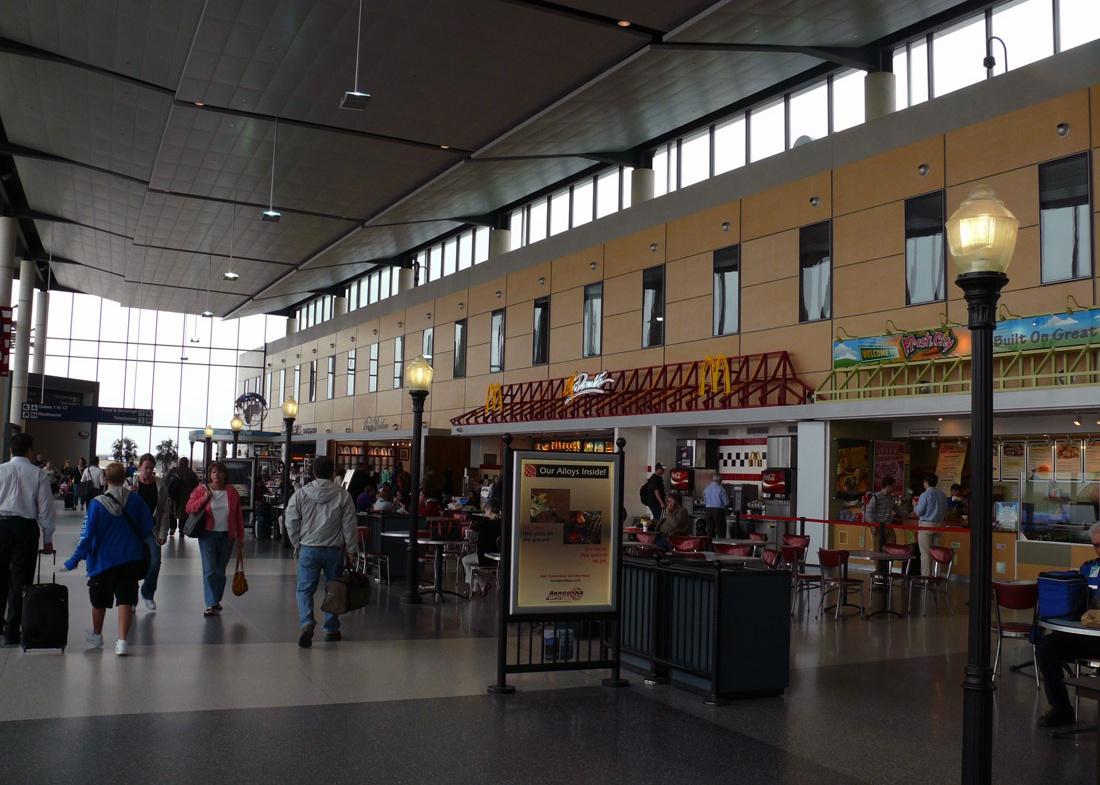
#26. Hartford, Connecticut: Bradley International
People walking past restaurants in Bradley Airport.
– Annual flights (August 2021-July 2022): 23,161
– On-time performance: 72.16%
– Air carrier delay: 10.8%
– Weather delay: 0.8%
– National Aviation System delay: 4.8%
– Security delay: 0.1%
– Aircraft arriving late delay: 7.9%
– Cancelled flights: 3.4%
– Diverted flights: 0.1%
You may also like: Airlines most likely to lose or damage your luggage
Roman Tigal // Shutterstock
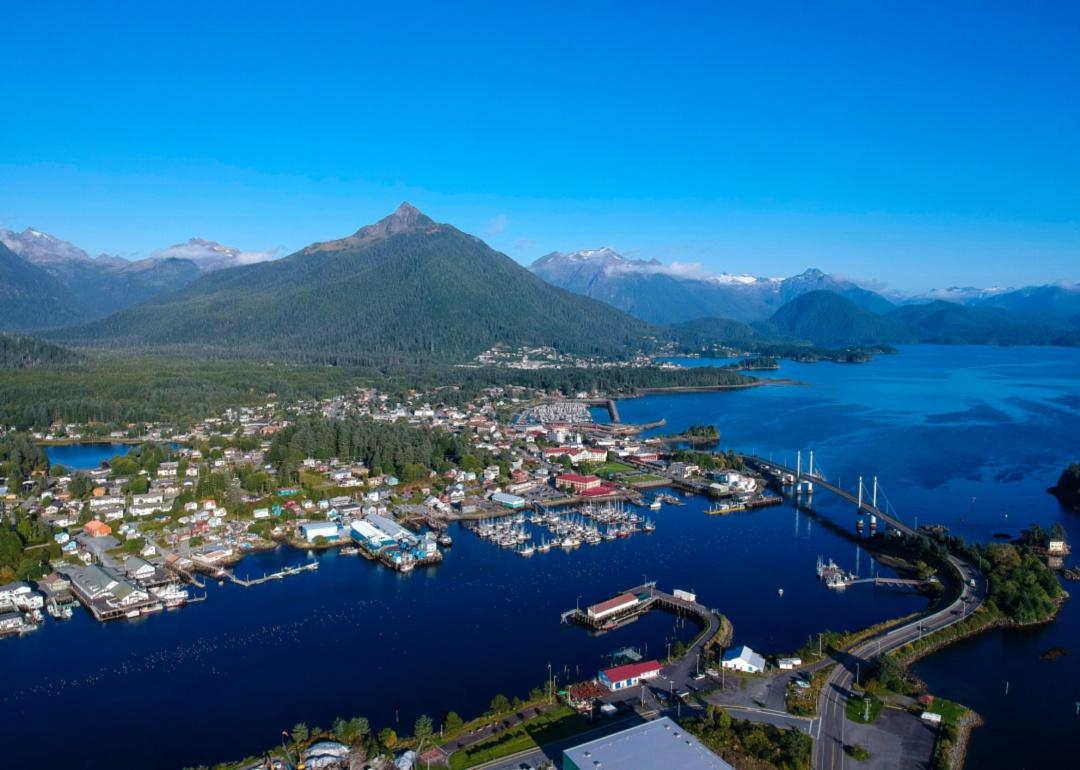
#25. Sitka, Alaska: Sitka Rocky Gutierrez
An aerial view of Sitka, Alaska on the water in the mountains.
– Annual flights (August 2021-July 2022): 1,414
– On-time performance: 72.14%
– Air carrier delay: 6.0%
– Weather delay: 0.8%
– National Aviation System delay: 5.8%
– Security delay: 0.0%
– Aircraft arriving late delay: 11.2%
– Cancelled flights: 3.0%
– Diverted flights: 1.1%
Ken Lund // Wikimedia Commons
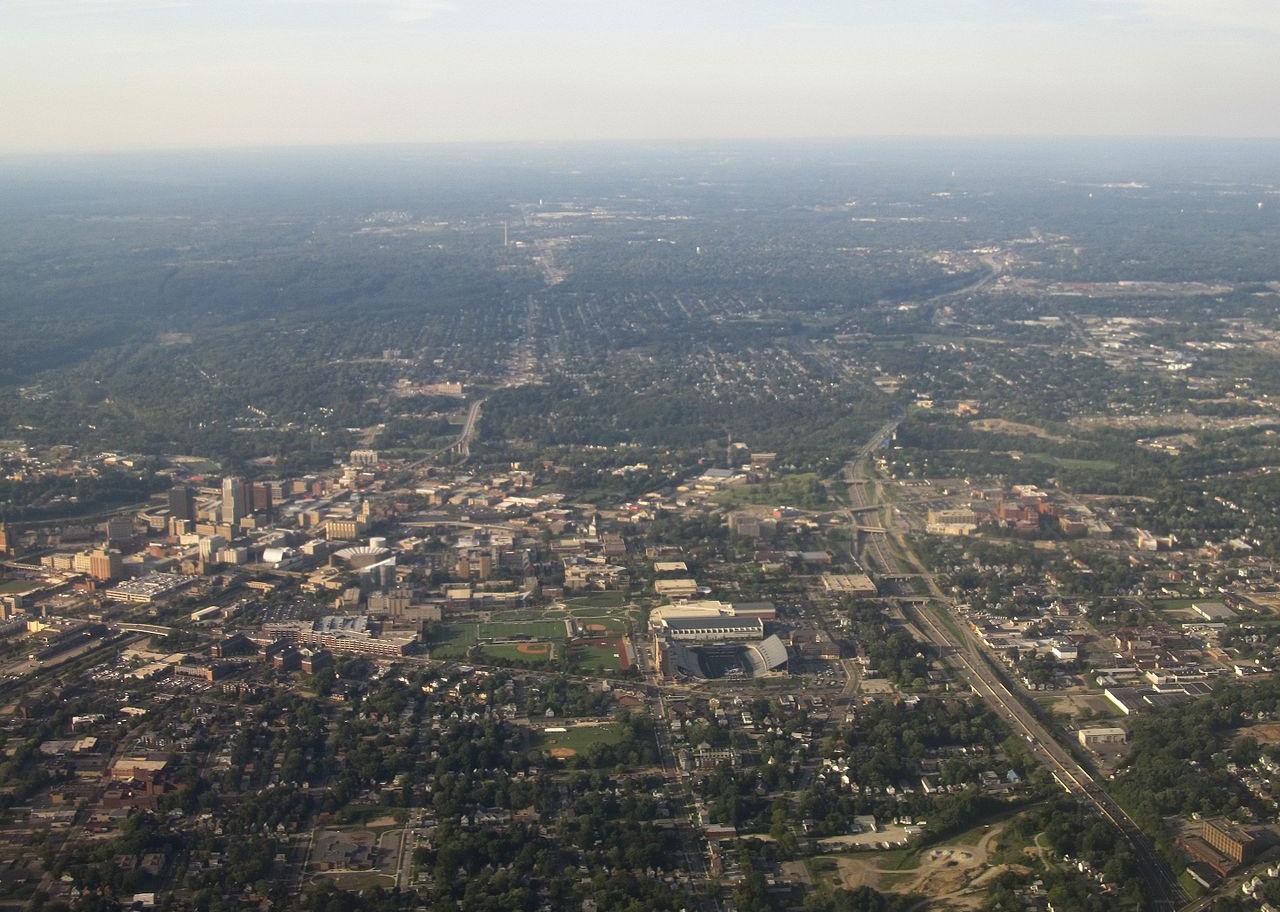
#24. Akron, Ohio: Akron-Canton Regional
The approach from the air to Akro airport and downtown.
– Annual flights (August 2021-July 2022): 2,219
– On-time performance: 71.92%
– Air carrier delay: 9.1%
– Weather delay: 1.5%
– National Aviation System delay: 5.1%
– Security delay: 0.2%
– Aircraft arriving late delay: 9.2%
– Cancelled flights: 2.9%
– Diverted flights: 0.1%
Ben P L // Wikimedia Commons
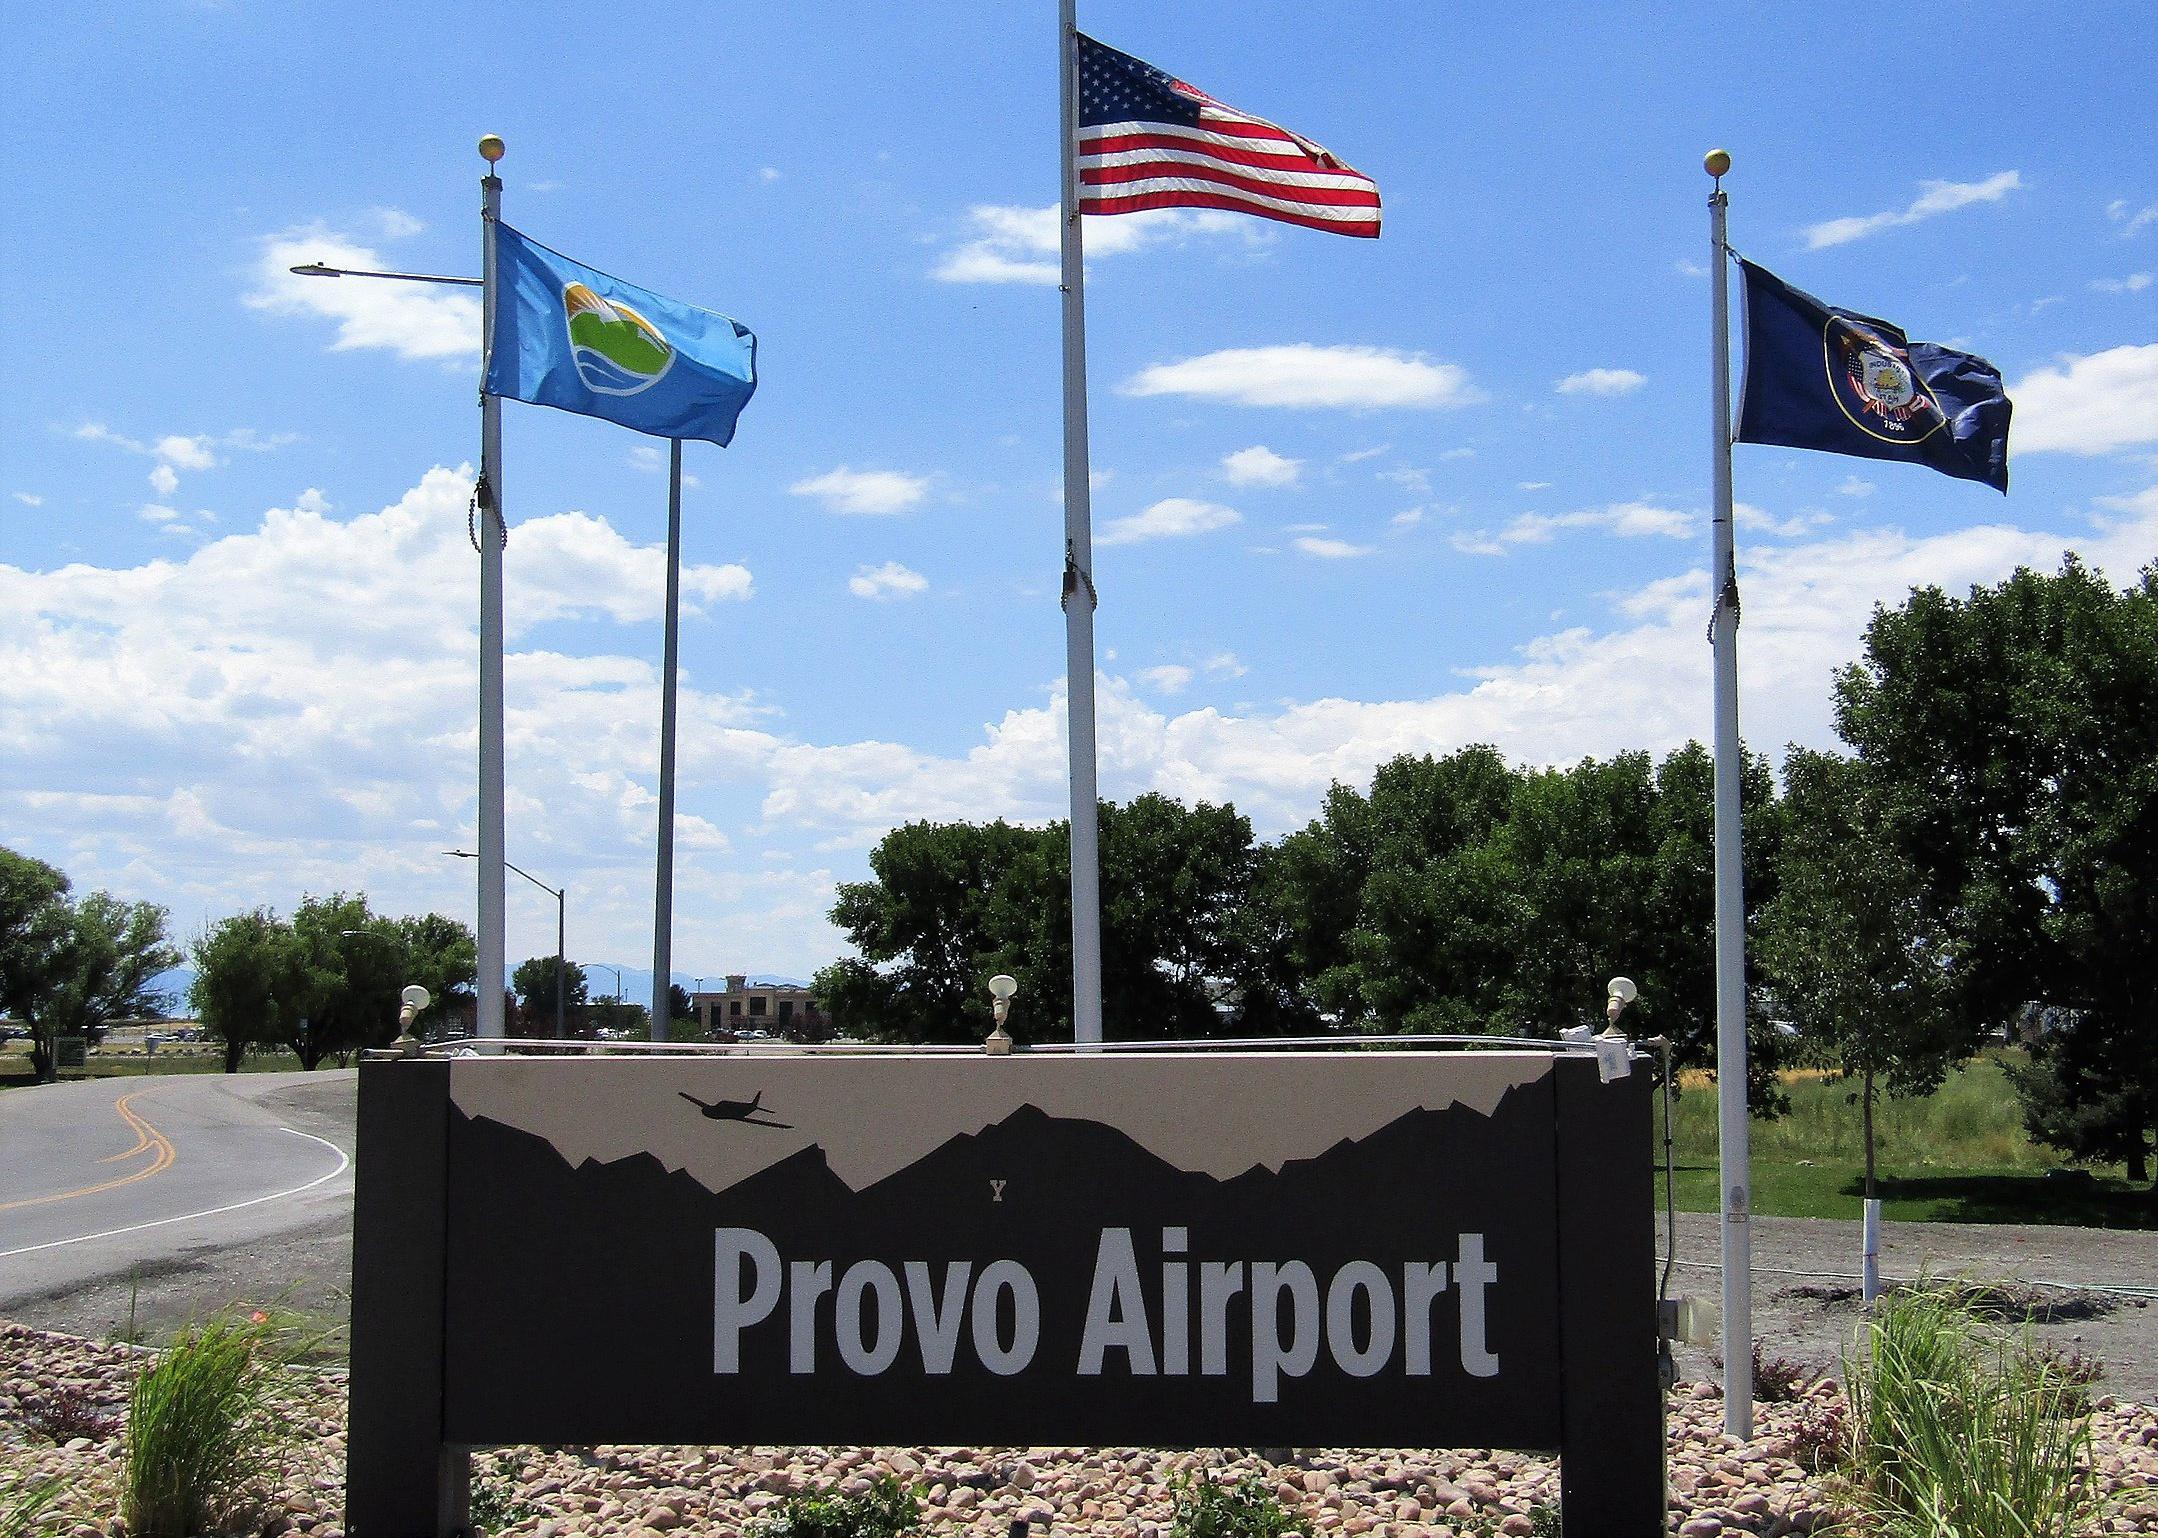
#23. Provo, Utah: Provo Municipal
A small airport sign for Provo with flags.
– Annual flights (August 2021-July 2022): 1,045
– On-time performance: 71.87%
– Air carrier delay: 9.6%
– Weather delay: 0.6%
– National Aviation System delay: 4.2%
– Security delay: 0.0%
– Aircraft arriving late delay: 9.4%
– Cancelled flights: 4.2%
– Diverted flights: 0.1%
Antony-22 // Wikimedia Commons
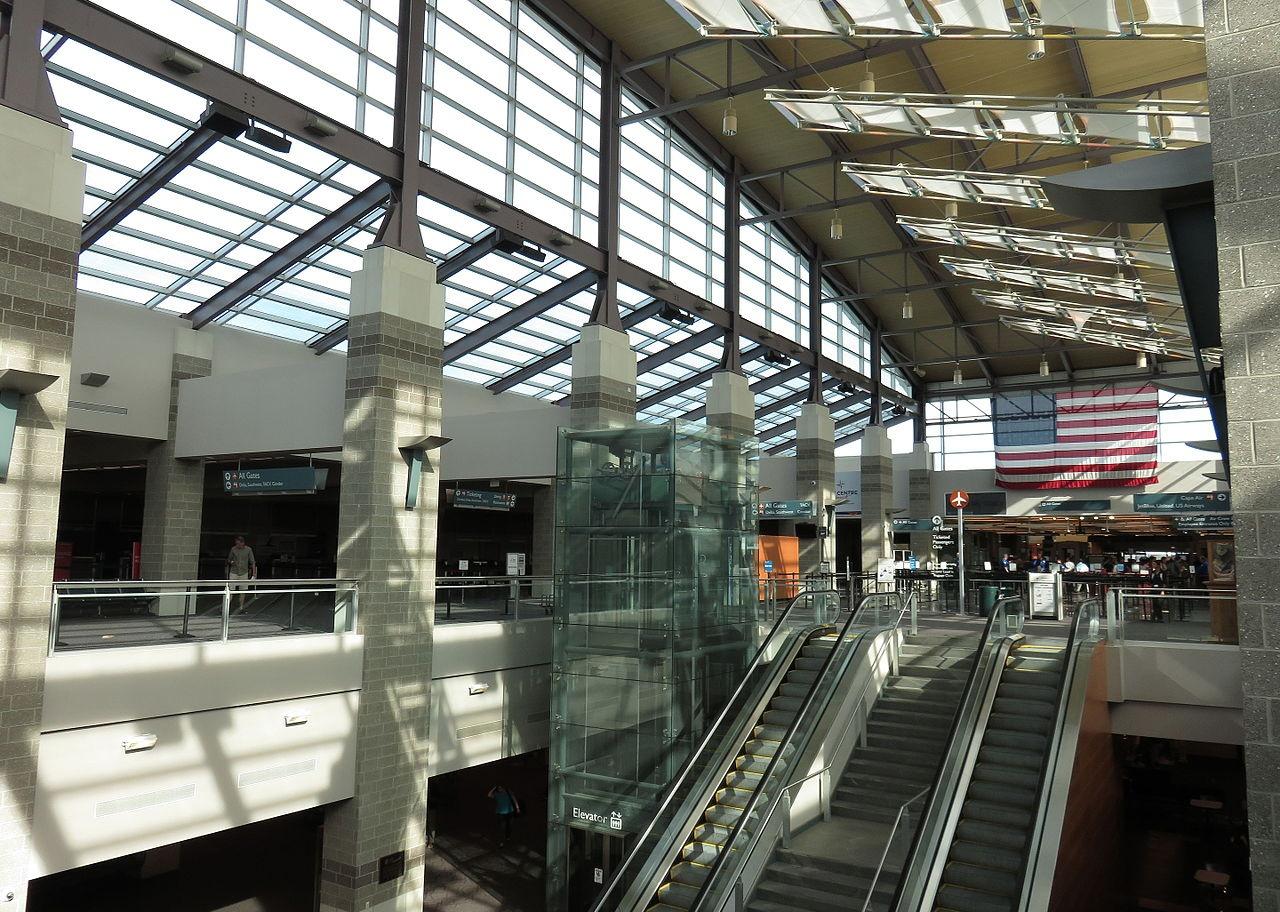
#22. Providence, Rhode Island: Theodore Francis Green State
An escalator and American flag in Theodore Francis Green airport.
– Annual flights (August 2021-July 2022): 13,861
– On-time performance: 71.83%
– Air carrier delay: 11.0%
– Weather delay: 0.9%
– National Aviation System delay: 3.9%
– Security delay: 0.1%
– Aircraft arriving late delay: 8.4%
– Cancelled flights: 3.8%
– Diverted flights: 0.1%
Sdkb // Wikimedia Commons
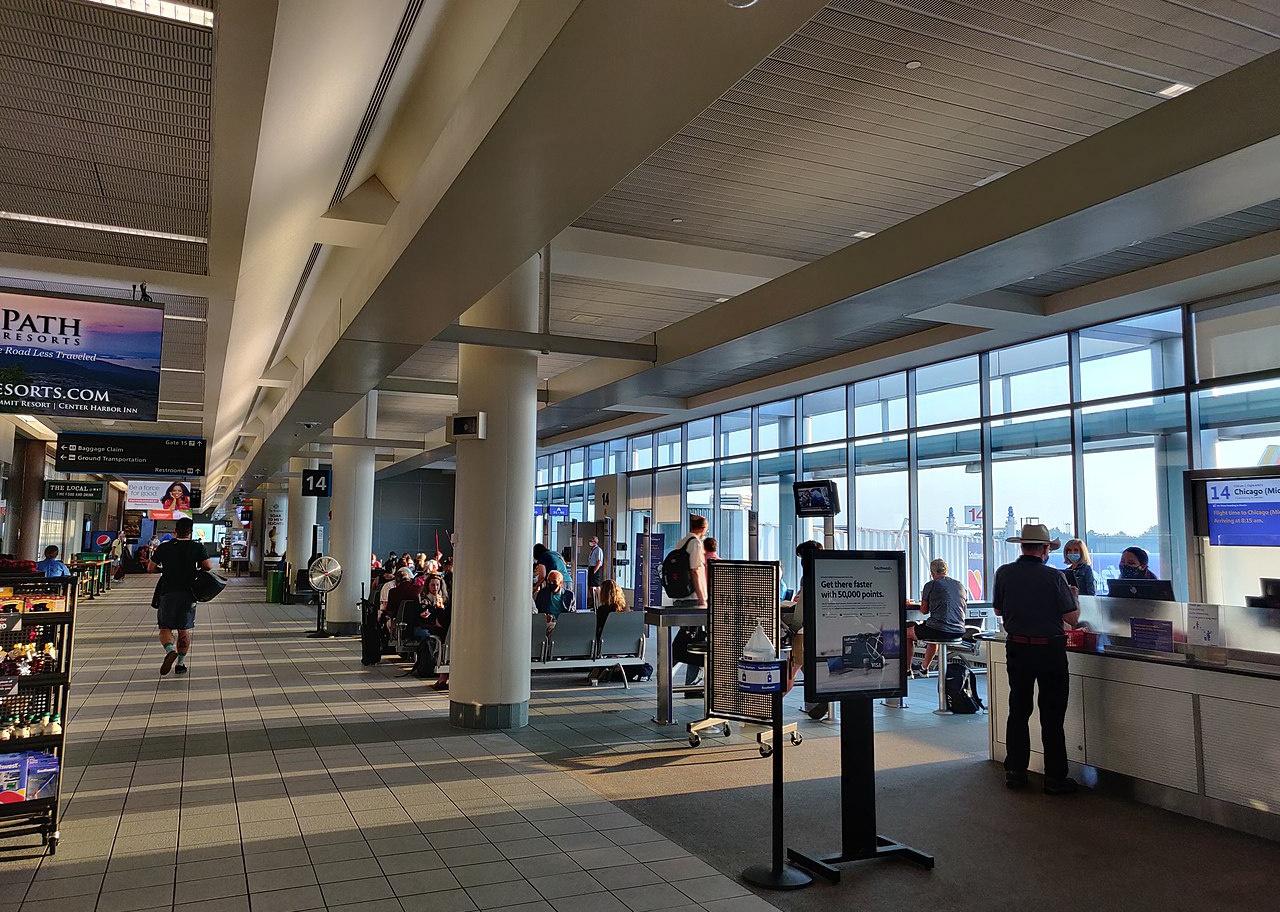
#21. Manchester, New Hampshire: Manchester-Boston Regional
Departure gates at Manchester-Boston airport.
– Annual flights (August 2021-July 2022): 6,162
– On-time performance: 71.78%
– Air carrier delay: 10.7%
– Weather delay: 0.6%
– National Aviation System delay: 3.8%
– Security delay: 0.1%
– Aircraft arriving late delay: 9.2%
– Cancelled flights: 3.8%
– Diverted flights: 0.1%
You may also like: 25 extreme getaways
Hayk_Shalunts // Shutterstock
#20. Fort Lauderdale, Florida: Fort Lauderdale-Hollywood International
A large crowd walking with luggage in the Fort Lauderdale airport.
– Annual flights (August 2021-July 2022): 87,550
– On-time performance: 71.74%
– Air carrier delay: 9.2%
– Weather delay: 0.6%
– National Aviation System delay: 7.7%
– Security delay: 0.2%
– Aircraft arriving late delay: 7.1%
– Cancelled flights: 3.2%
– Diverted flights: 0.4%
Canva
#19. Belleville, Illinois: Scott AFB/MidAmerica
An aircraft approaching the runway at sunset.
– Annual flights (August 2021-July 2022): 1,259
– On-time performance: 70.93%
– Air carrier delay: 7.6%
– Weather delay: 1.9%
– National Aviation System delay: 6.5%
– Security delay: 0.3%
– Aircraft arriving late delay: 10.0%
– Cancelled flights: 2.7%
– Diverted flights: 0.1%
Joni Hanebutt // Shutterstock
#18. Orlando, Florida: Orlando International
People rushing to get to flights.
– Annual flights (August 2021-July 2022): 143,793
– On-time performance: 70.54%
– Air carrier delay: 9.2%
– Weather delay: 0.6%
– National Aviation System delay: 8.2%
– Security delay: 0.1%
– Aircraft arriving late delay: 8.4%
– Cancelled flights: 2.7%
– Diverted flights: 0.3%
Aaroncosta3 // Wikimedia Commons
#17. Sarasota/Bradenton, Florida: Sarasota/Bradenton International
An aircraft and empty luggage trucks at Sarasota airport.
– Annual flights (August 2021-July 2022): 16,702
– On-time performance: 70.18%
– Air carrier delay: 9.1%
– Weather delay: 0.7%
– National Aviation System delay: 8.9%
– Security delay: 0.0%
– Aircraft arriving late delay: 7.9%
– Cancelled flights: 2.9%
– Diverted flights: 0.3%
stock_photo_world // Shutterstock
#16. Dallas, Texas: Dallas Love Field
People walk through neon lit signs and restaurants at Dallas Love Field airport.
– Annual flights (August 2021-July 2022): 64,904
– On-time performance: 70.07%
– Air carrier delay: 8.5%
– Weather delay: 0.3%
– National Aviation System delay: 7.3%
– Security delay: 0.1%
– Aircraft arriving late delay: 10.2%
– Cancelled flights: 3.2%
– Diverted flights: 0.3%
You may also like: Most popular historic sites in America
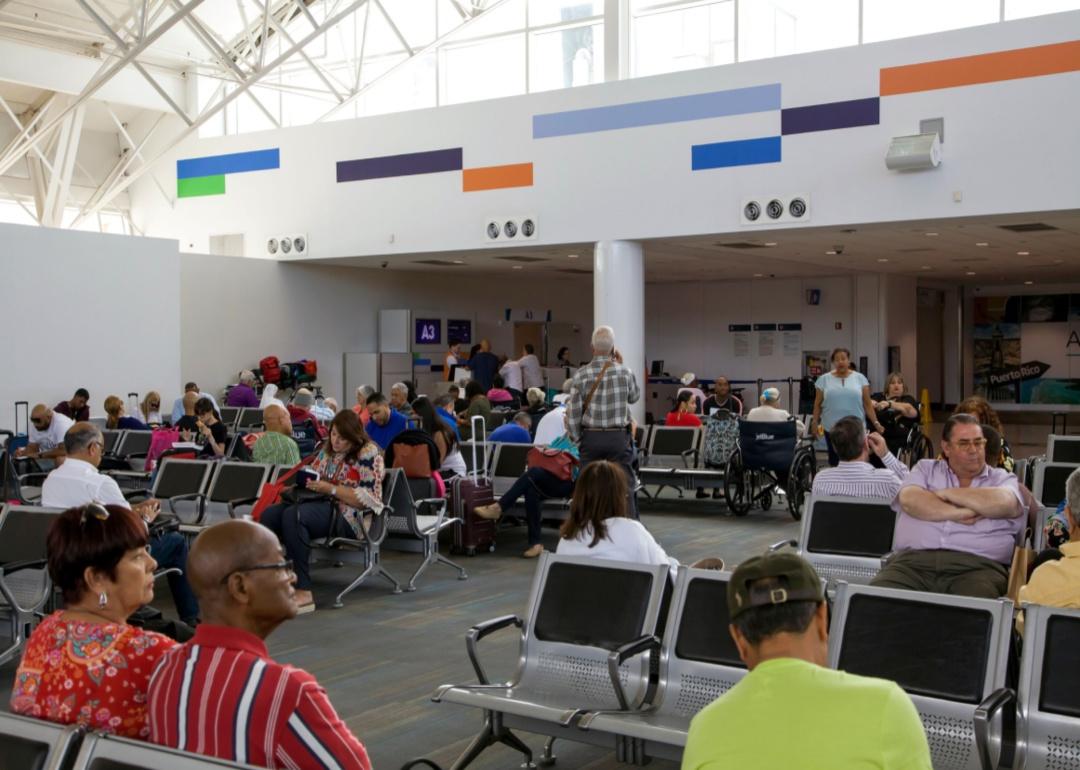
eddtoro // Shutterstock
#15. San Juan, Puerto Rico: Luis Munoz Marin International
People wait in a crowded room for flights.
– Annual flights (August 2021-July 2022): 30,113
– On-time performance: 69.53%
– Air carrier delay: 14.0%
– Weather delay: 0.9%
– National Aviation System delay: 6.0%
– Security delay: 0.2%
– Aircraft arriving late delay: 7.3%
– Cancelled flights: 1.9%
– Diverted flights: 0.2%
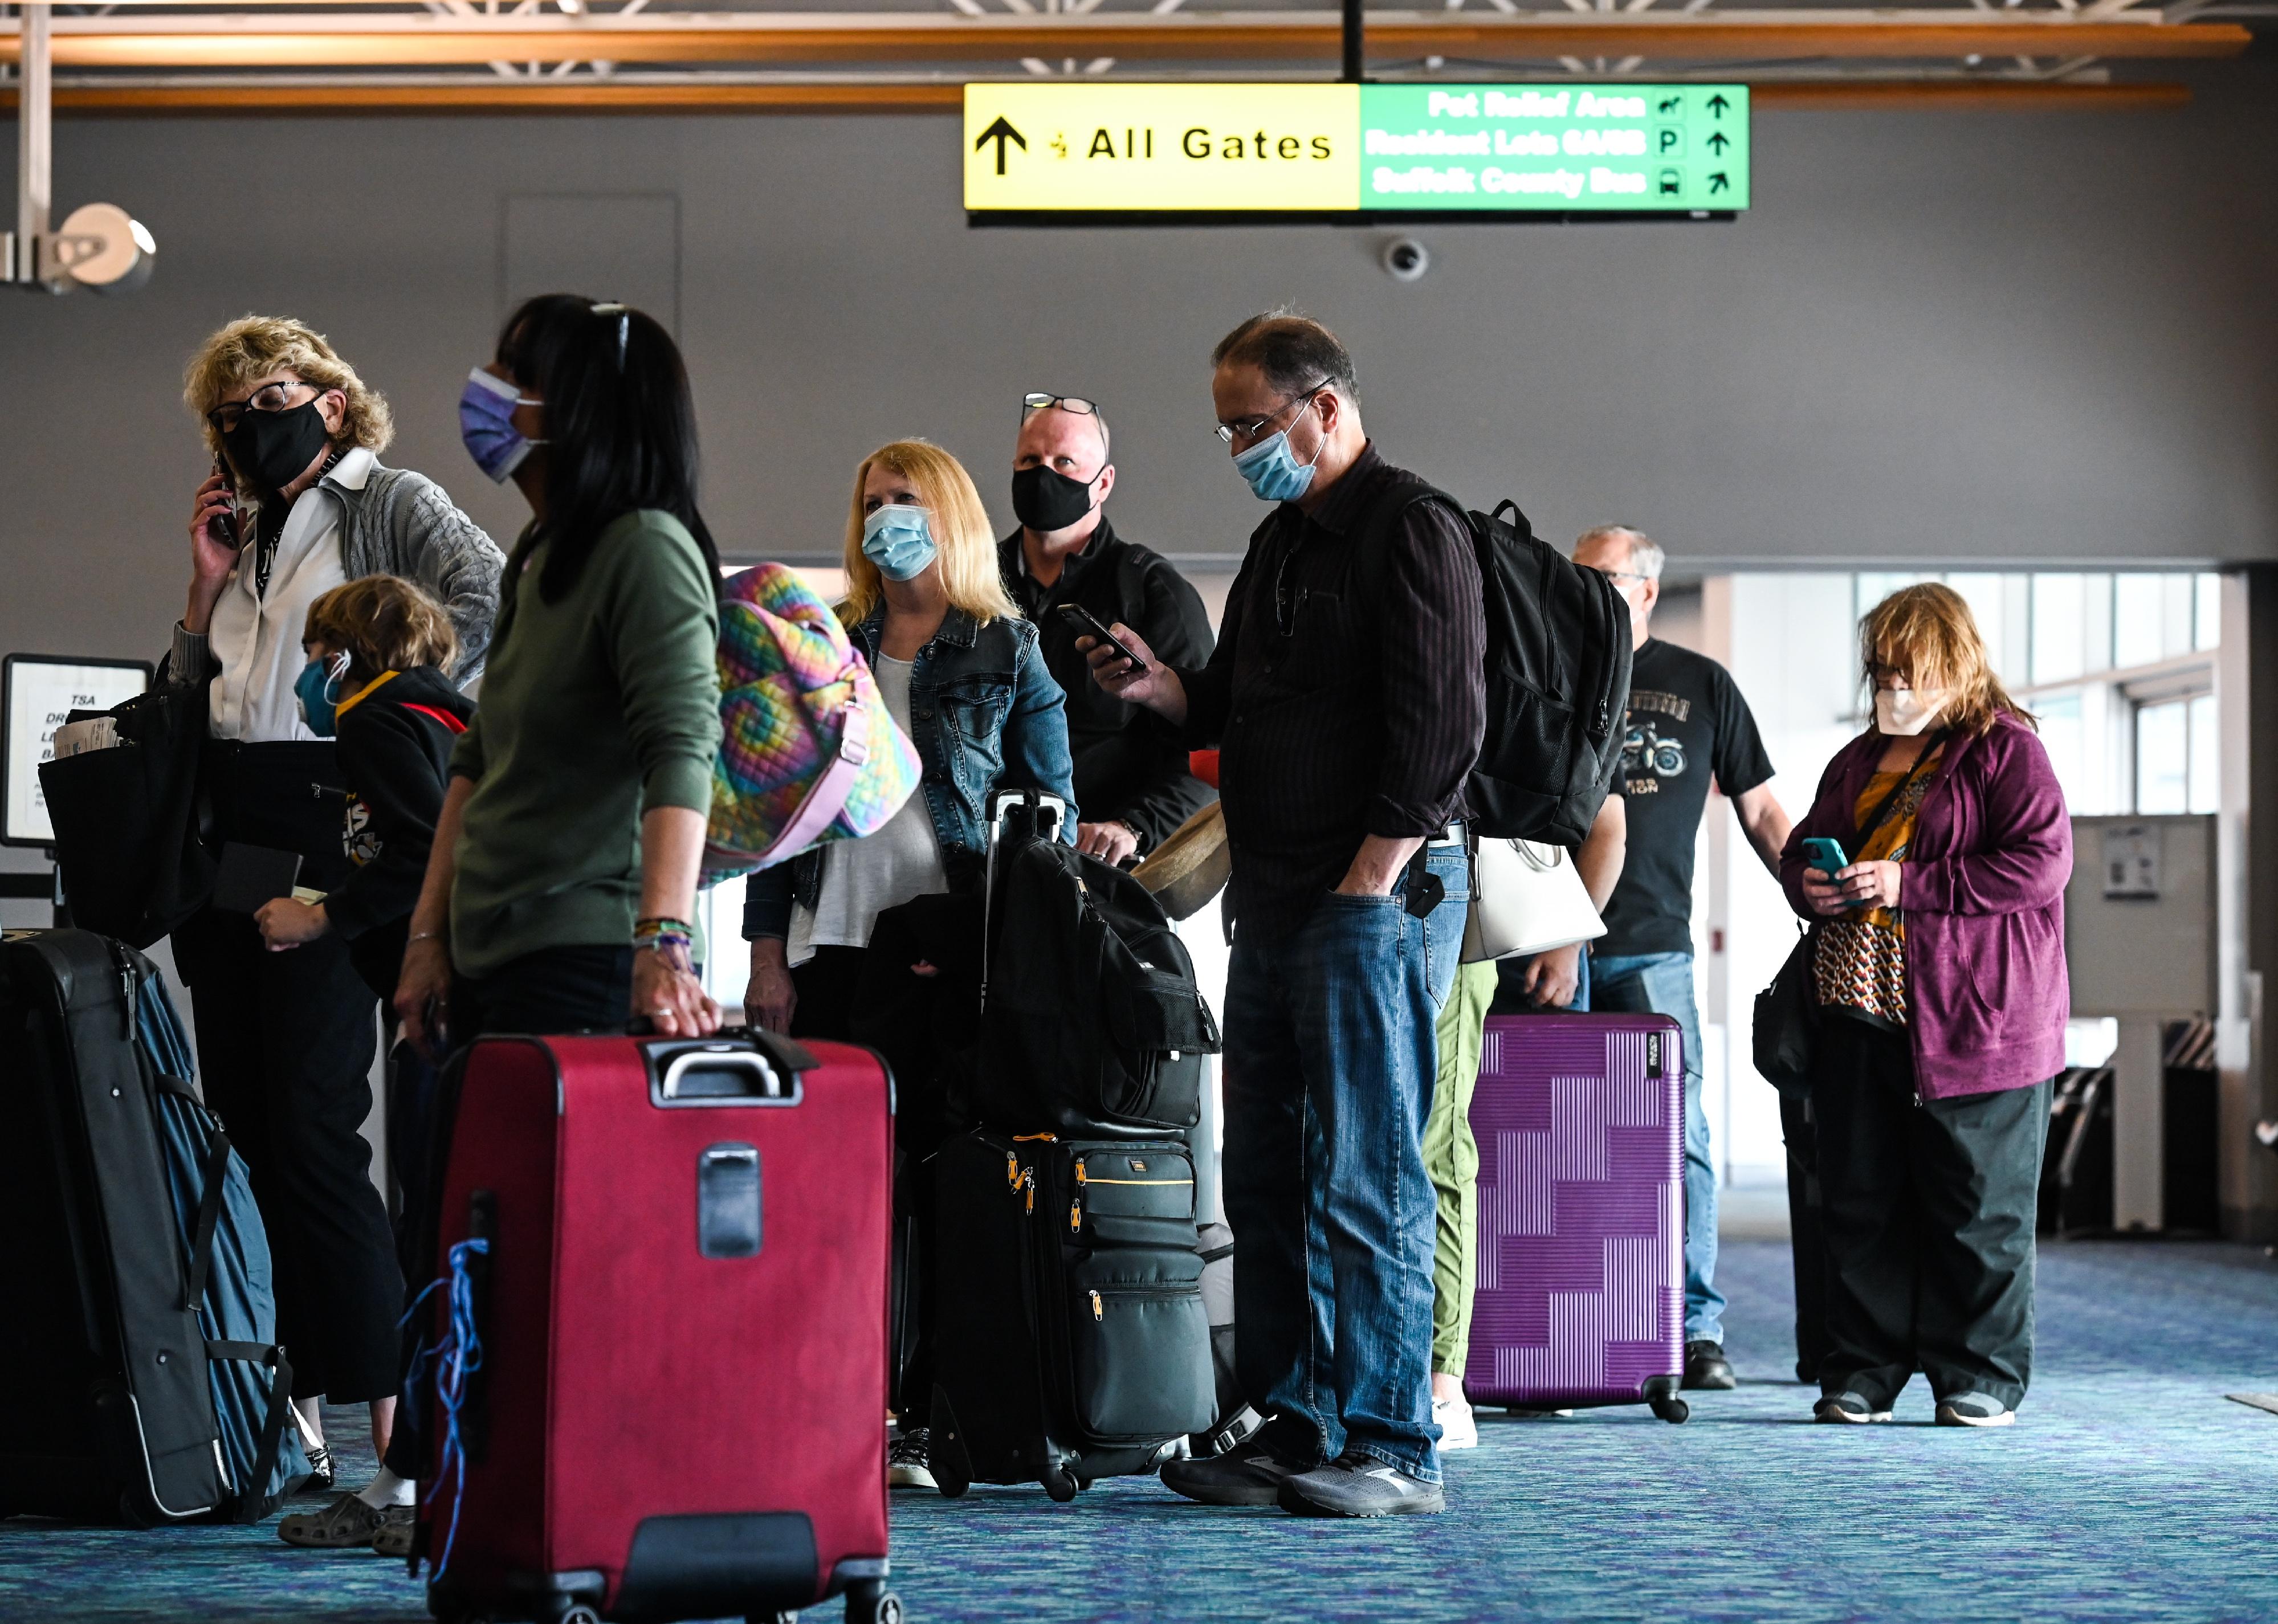
Steve Pfost/Newsday RM // Getty Images
#14. Islip, New York: Long Island MacArthur
Passengers wait in a ticket line.
– Annual flights (August 2021-July 2022): 5,343
– On-time performance: 69.42%
– Air carrier delay: 11.3%
– Weather delay: 0.5%
– National Aviation System delay: 4.9%
– Security delay: 0.0%
– Aircraft arriving late delay: 10.5%
– Cancelled flights: 3.2%
– Diverted flights: 0.1%
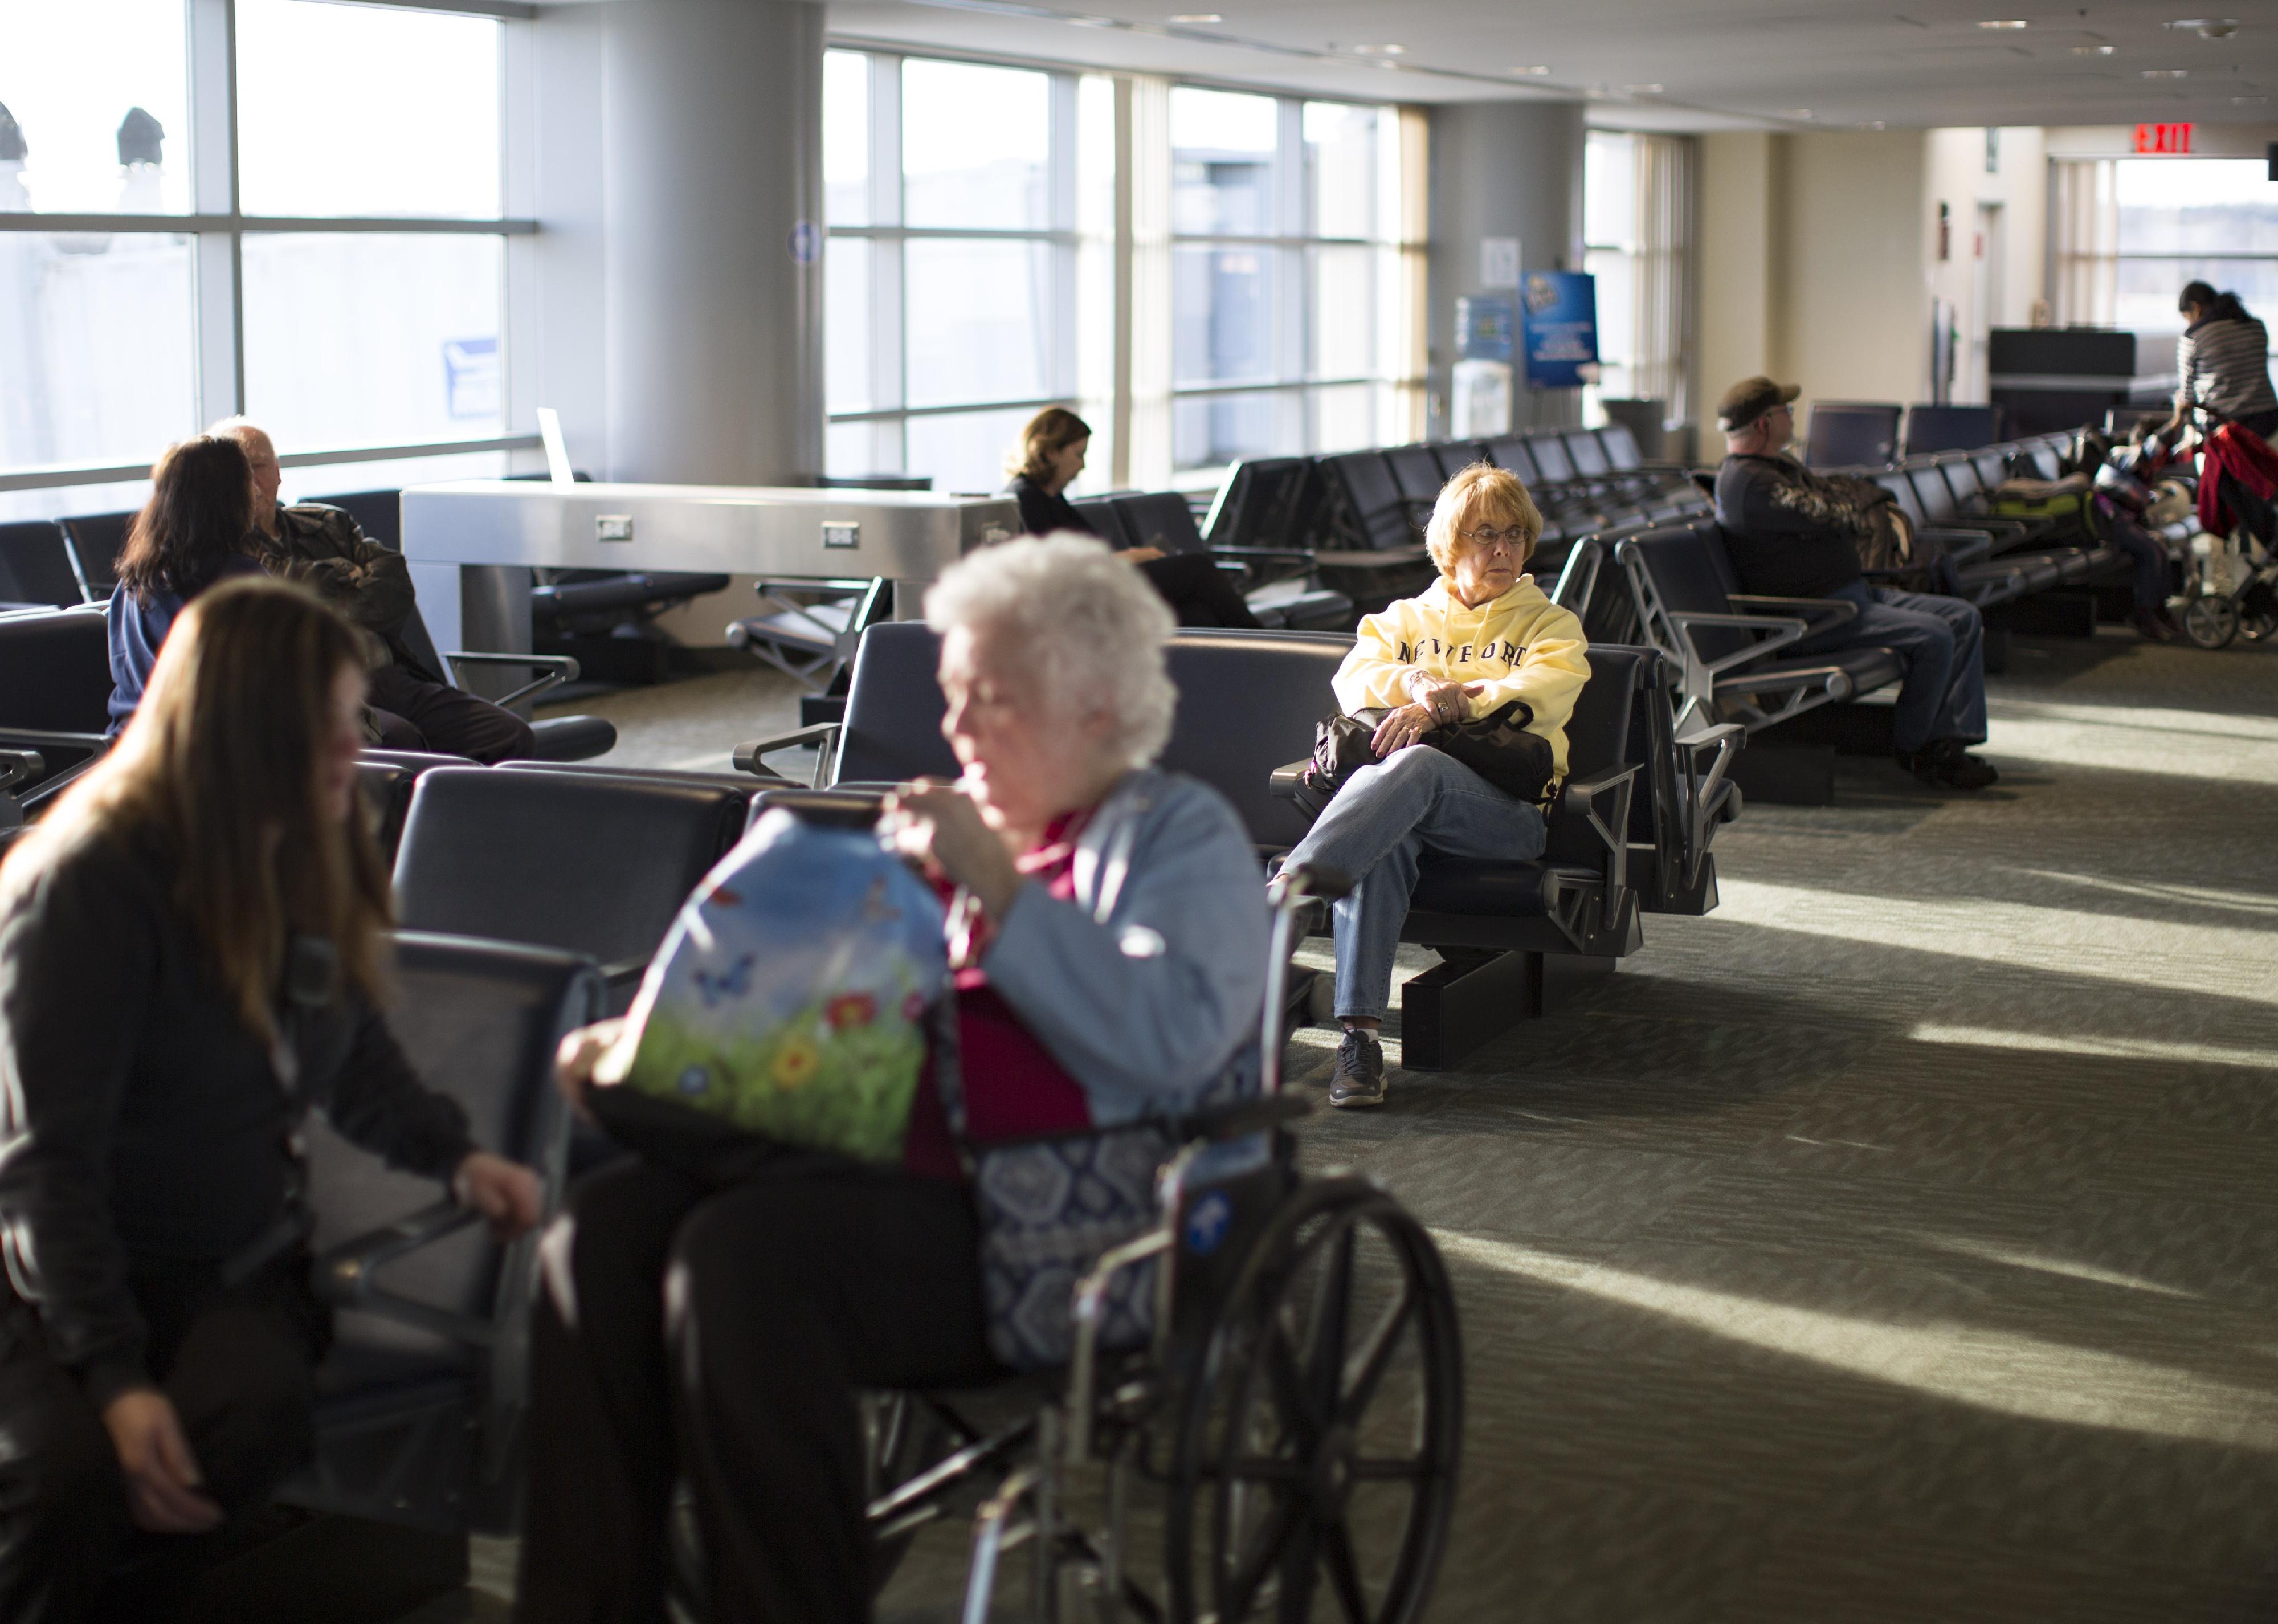
Dina Rudick/The Boston Globe // Getty Images
#13. Worcester, Massachusetts: Worcester Regional
Passengers wait in seats for their plane to begin boarding.
– Annual flights (August 2021-July 2022): 1,342
– On-time performance: 69.30%
– Air carrier delay: 11.8%
– Weather delay: 0.6%
– National Aviation System delay: 2.4%
– Security delay: 0.1%
– Aircraft arriving late delay: 7.3%
– Cancelled flights: 8.3%
– Diverted flights: 0.3%
Sanibel sun (talk) // Wikimedia Commons
#12. Flint, Michigan: Bishop International
People at ticketing and going to gates at Bishop airport.
– Annual flights (August 2021-July 2022): 3,057
– On-time performance: 68.76%
– Air carrier delay: 7.2%
– Weather delay: 1.6%
– National Aviation System delay: 7.1%
– Security delay: 0.1%
– Aircraft arriving late delay: 12.3%
– Cancelled flights: 2.9%
– Diverted flights: 0.1%
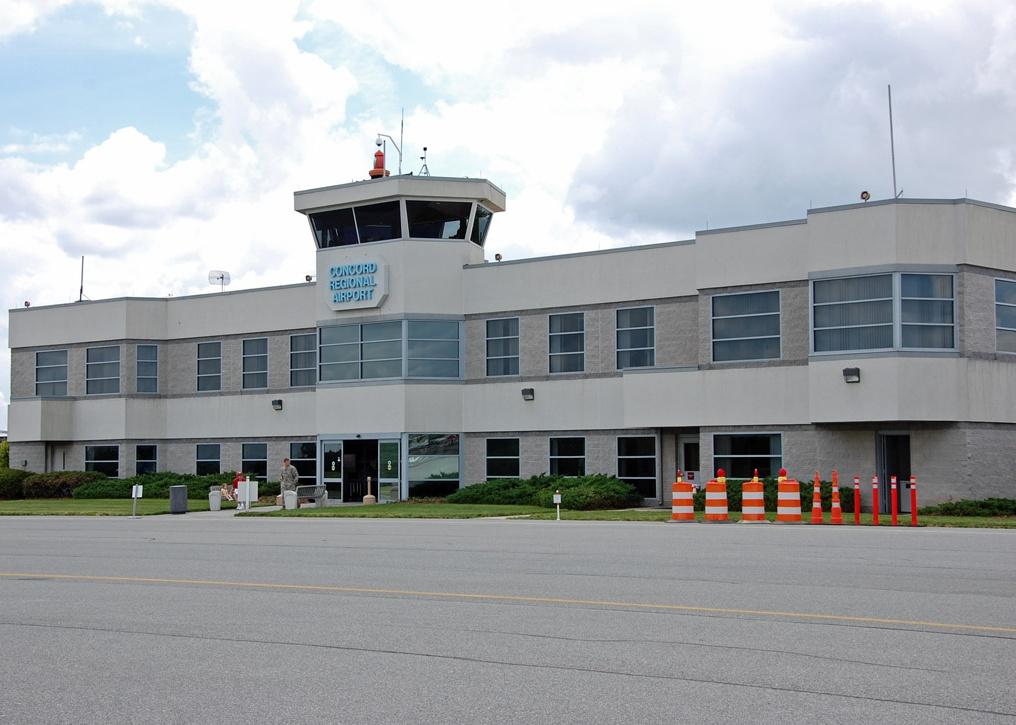
Bz3rk // Wikimedia Commons
#11. Concord, North Carolina: Concord Padgett Regional
General aviation terminal at Concord airport.
– Annual flights (August 2021-July 2022): 1,023
– On-time performance: 68.52%
– Air carrier delay: 8.1%
– Weather delay: 1.8%
– National Aviation System delay: 5.1%
– Security delay: 0.2%
– Aircraft arriving late delay: 11.5%
– Cancelled flights: 4.2%
– Diverted flights: 0.6%
You may also like: US airlines most likely to bump passengers
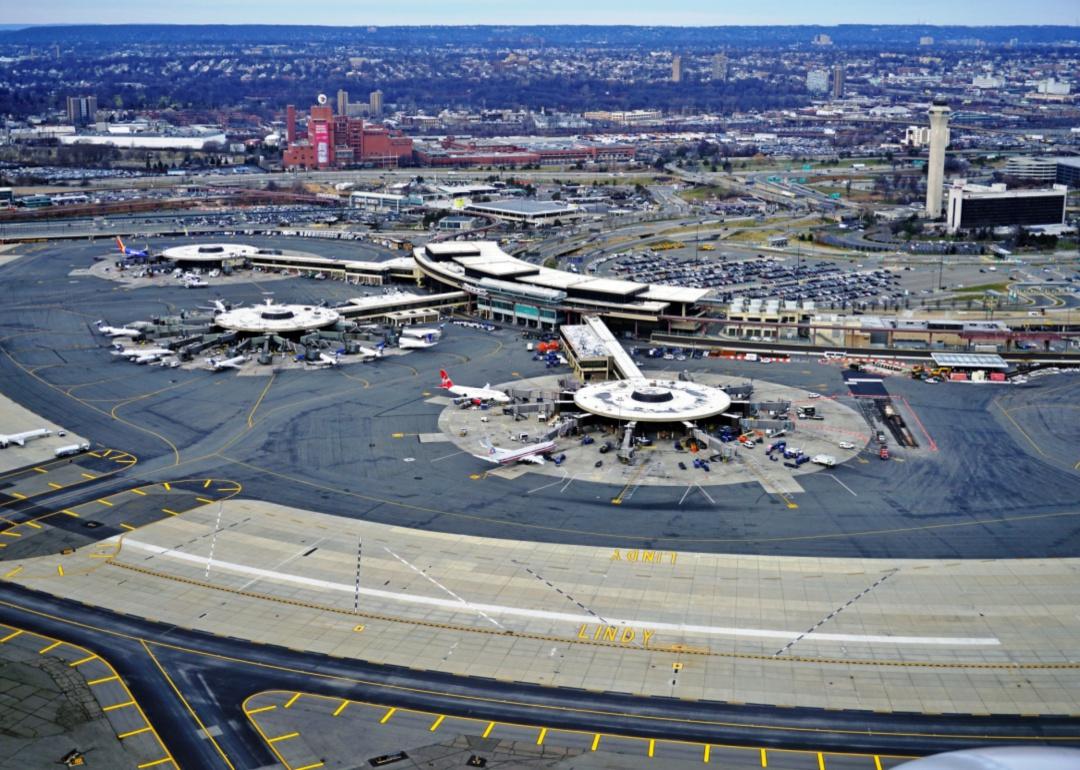
EQRoy // Shutterstock
#10. Newark, New Jersey: Newark Liberty International
An aerial view of the Newark airport.
– Annual flights (August 2021-July 2022): 123,026
– On-time performance: 68.47%
– Air carrier delay: 6.6%
– Weather delay: 0.7%
– National Aviation System delay: 12.6%
– Security delay: 0.1%
– Aircraft arriving late delay: 6.2%
– Cancelled flights: 5.0%
– Diverted flights: 0.4%
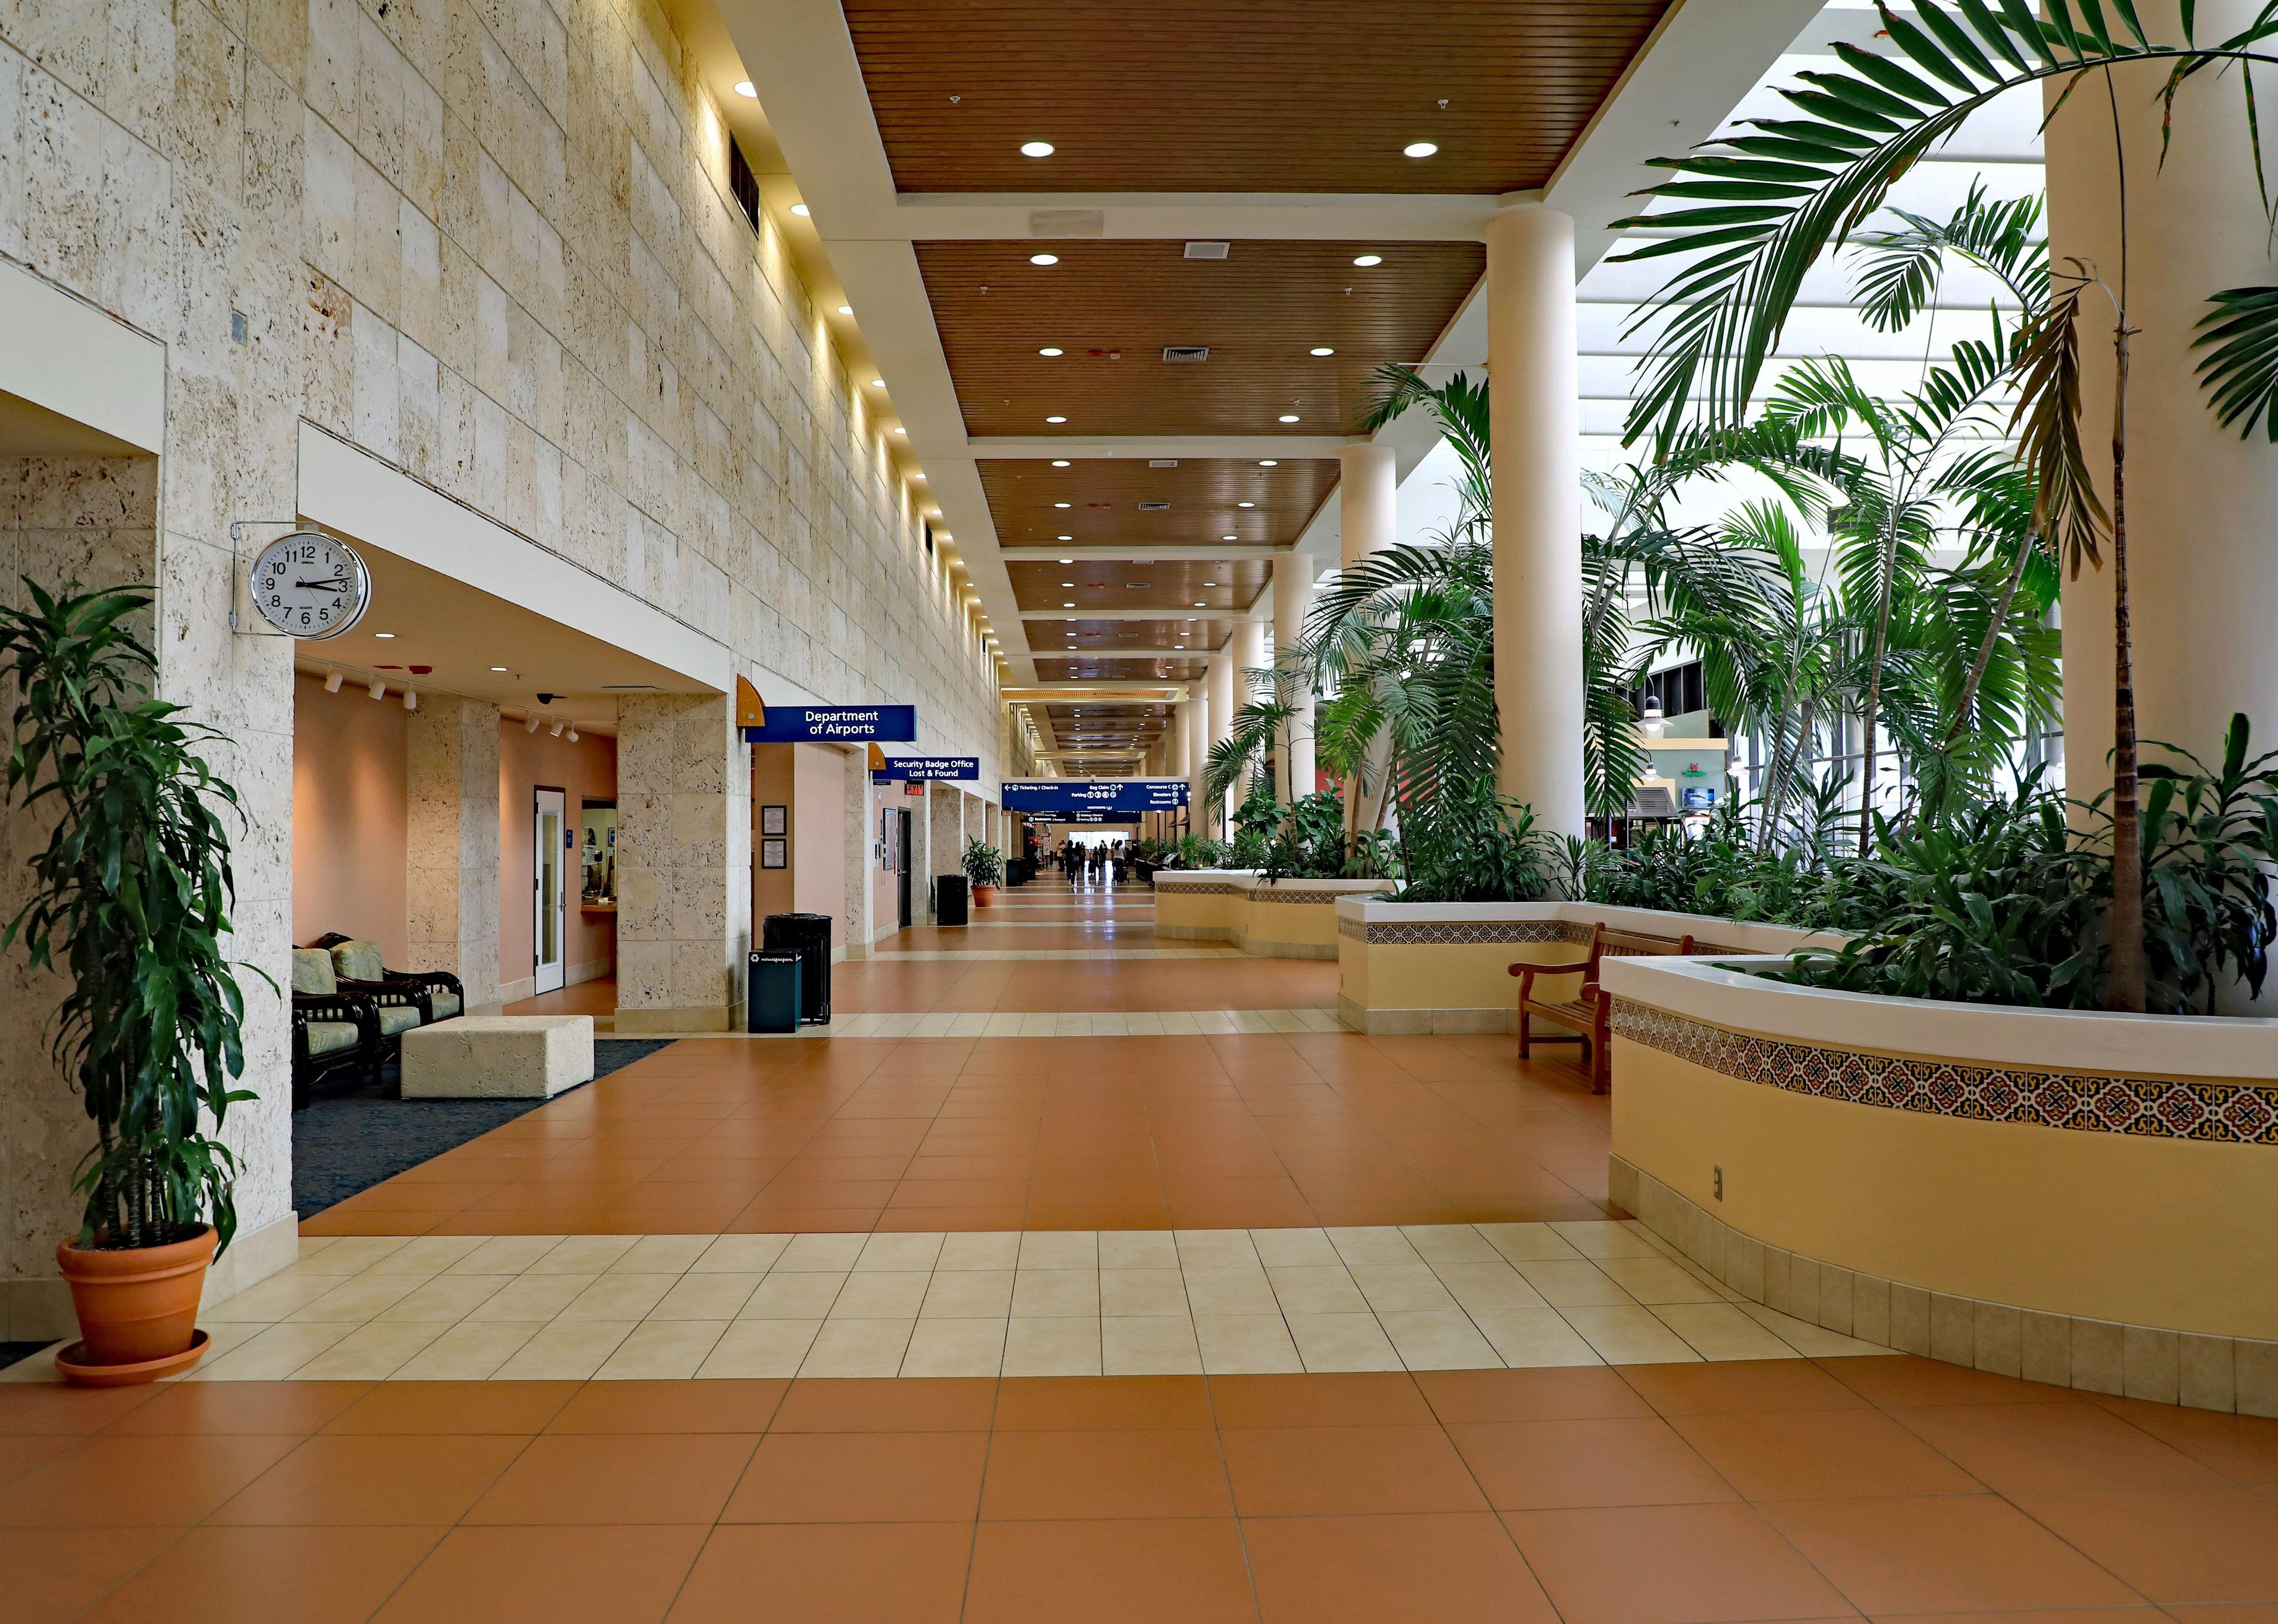
Thomas Barrat // Shutterstock
#9. West Palm Beach/Palm Beach, Florida: Palm Beach International
The beautiful interior of the Palm Beach airport with a stone hallway lined in palm trees.
– Annual flights (August 2021-July 2022): 24,603
– On-time performance: 66.98%
– Air carrier delay: 11.0%
– Weather delay: 0.7%
– National Aviation System delay: 10.3%
– Security delay: 0.1%
– Aircraft arriving late delay: 7.1%
– Cancelled flights: 3.6%
– Diverted flights: 0.2%
EQRoy // Shutterstock
#8. Trenton, New Jersey: Trenton Mercer
Passengers disembark from an aircraft on the tarmac in Trenton.
– Annual flights (August 2021-July 2022): 2,534
– On-time performance: 66.93%
– Air carrier delay: 10.2%
– Weather delay: 0.6%
– National Aviation System delay: 7.9%
– Security delay: 0.0%
– Aircraft arriving late delay: 10.9%
– Cancelled flights: 3.3%
– Diverted flights: 0.2%
Sixflashphoto // Wikimedia Commons
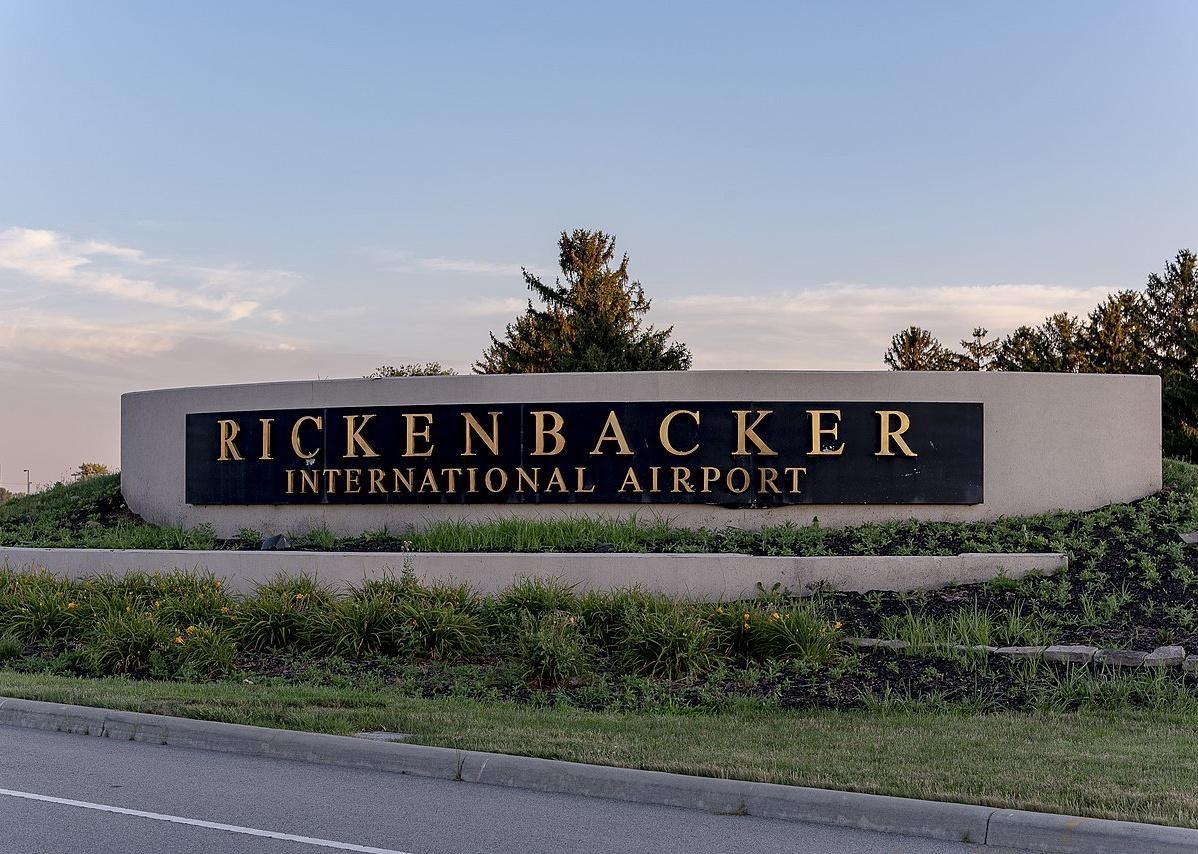
#7. Columbus, Ohio: Rickenbacker International
The entrance sign into Rickenbacker airport.
– Annual flights (August 2021-July 2022): 1,101
– On-time performance: 63.94%
– Air carrier delay: 9.3%
– Weather delay: 2.6%
– National Aviation System delay: 7.2%
– Security delay: 0.2%
– Aircraft arriving late delay: 12.7%
– Cancelled flights: 4.0%
– Diverted flights: 0.1%
Joni Hanebutt // Shutterstock
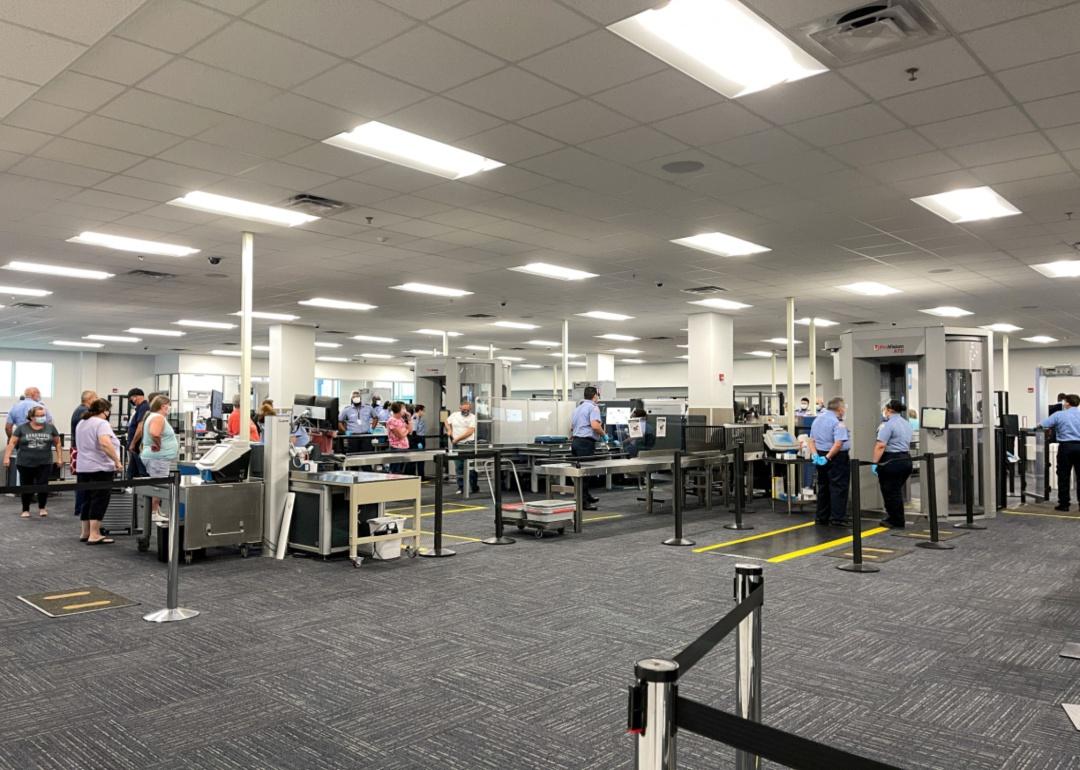
#6. Sanford, Florida: Orlando Sanford International
Passengers go through security.
– Annual flights (August 2021-July 2022): 9,292
– On-time performance: 61.97%
– Air carrier delay: 8.5%
– Weather delay: 1.5%
– National Aviation System delay: 8.9%
– Security delay: 0.2%
– Aircraft arriving late delay: 15.3%
– Cancelled flights: 3.5%
– Diverted flights: 0.2%
You may also like: Must-drive roads in every state
AProvchy // Shutterstock
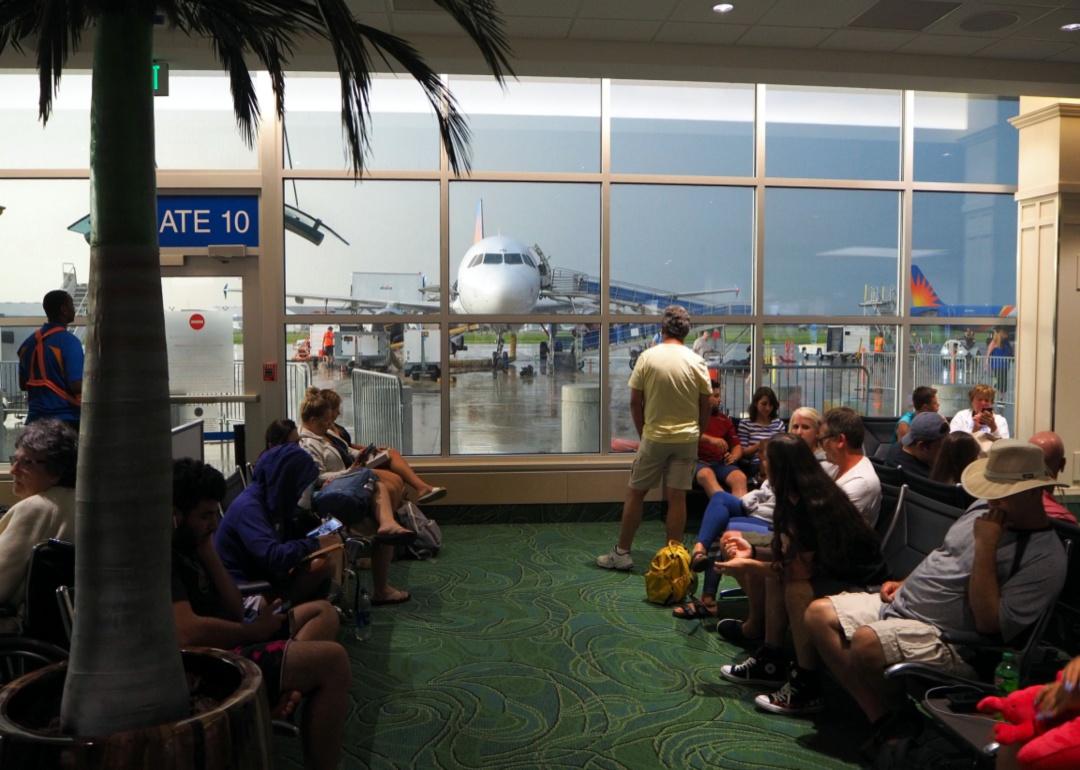
#5. St. Petersburg, Florida: St Pete Clearwater International
Passengers wait in a crowded room with a big window and palm tree facing a plane and storm outside on the tarmac.
– Annual flights (August 2021-July 2022): 7,886
– On-time performance: 61.49%
– Air carrier delay: 7.4%
– Weather delay: 2.2%
– National Aviation System delay: 10.1%
– Security delay: 0.1%
– Aircraft arriving late delay: 14.9%
– Cancelled flights: 3.5%
– Diverted flights: 0.3%
Tim Roberts Photography // Shutterstock
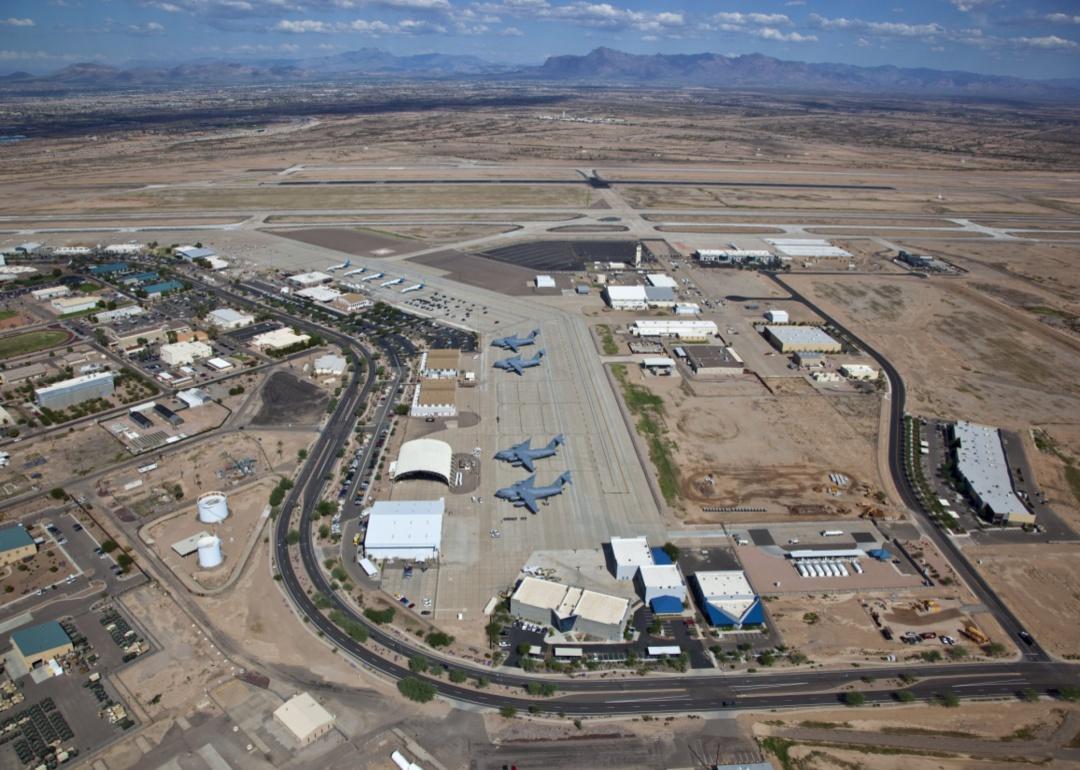
#4. Phoenix, Arizona: Phoenix-Mesa Gateway
An aerial view of Phoenix Mesa airport in a desert landscape.
– Annual flights (August 2021-July 2022): 5,946
– On-time performance: 60.34%
– Air carrier delay: 9.8%
– Weather delay: 1.0%
– National Aviation System delay: 8.1%
– Security delay: 0.2%
– Aircraft arriving late delay: 16.8%
– Cancelled flights: 3.6%
– Diverted flights: 0.2%
Miguelpr91 // Wikimedia Commons
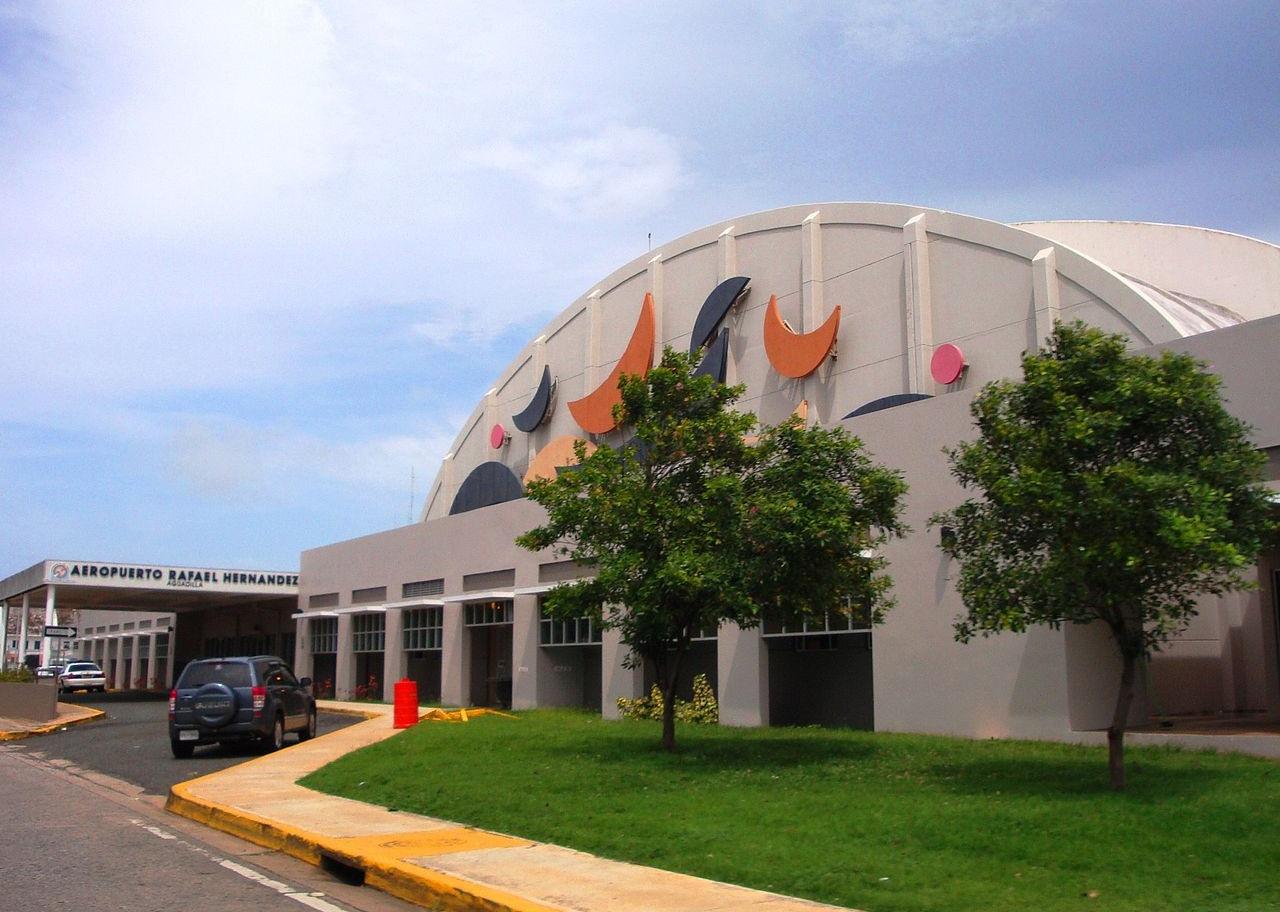
#3. Aguadilla, Puerto Rico: Rafael Hernandez
A dome shaped airport building with colorful crescents on the front.
– Annual flights (August 2021-July 2022): 2,289
– On-time performance: 60.25%
– Air carrier delay: 17.6%
– Weather delay: 1.5%
– National Aviation System delay: 9.2%
– Security delay: 0.5%
– Aircraft arriving late delay: 7.9%
– Cancelled flights: 2.9%
– Diverted flights: 0.2%
EQRoy // Shutterstock
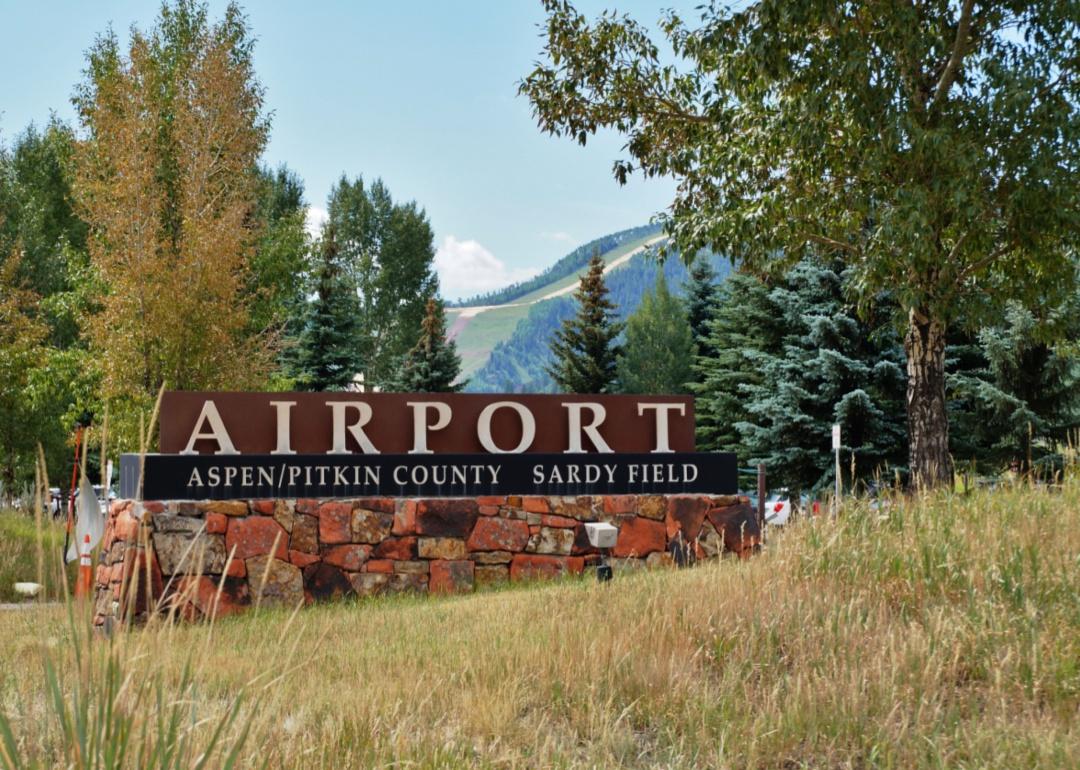
#2. Aspen, Colorado: Aspen Pitkin County Sardy Field
A stone entrance sign into Aspen airport with mountains in the background.
– Annual flights (August 2021-July 2022): 6,353
– On-time performance: 58.93%
– Air carrier delay: 19.1%
– Weather delay: 1.8%
– National Aviation System delay: 1.7%
– Security delay: 0.0%
– Aircraft arriving late delay: 7.2%
– Cancelled flights: 8.2%
– Diverted flights: 3.1%
Education Images/Universal Images Group // Getty Images
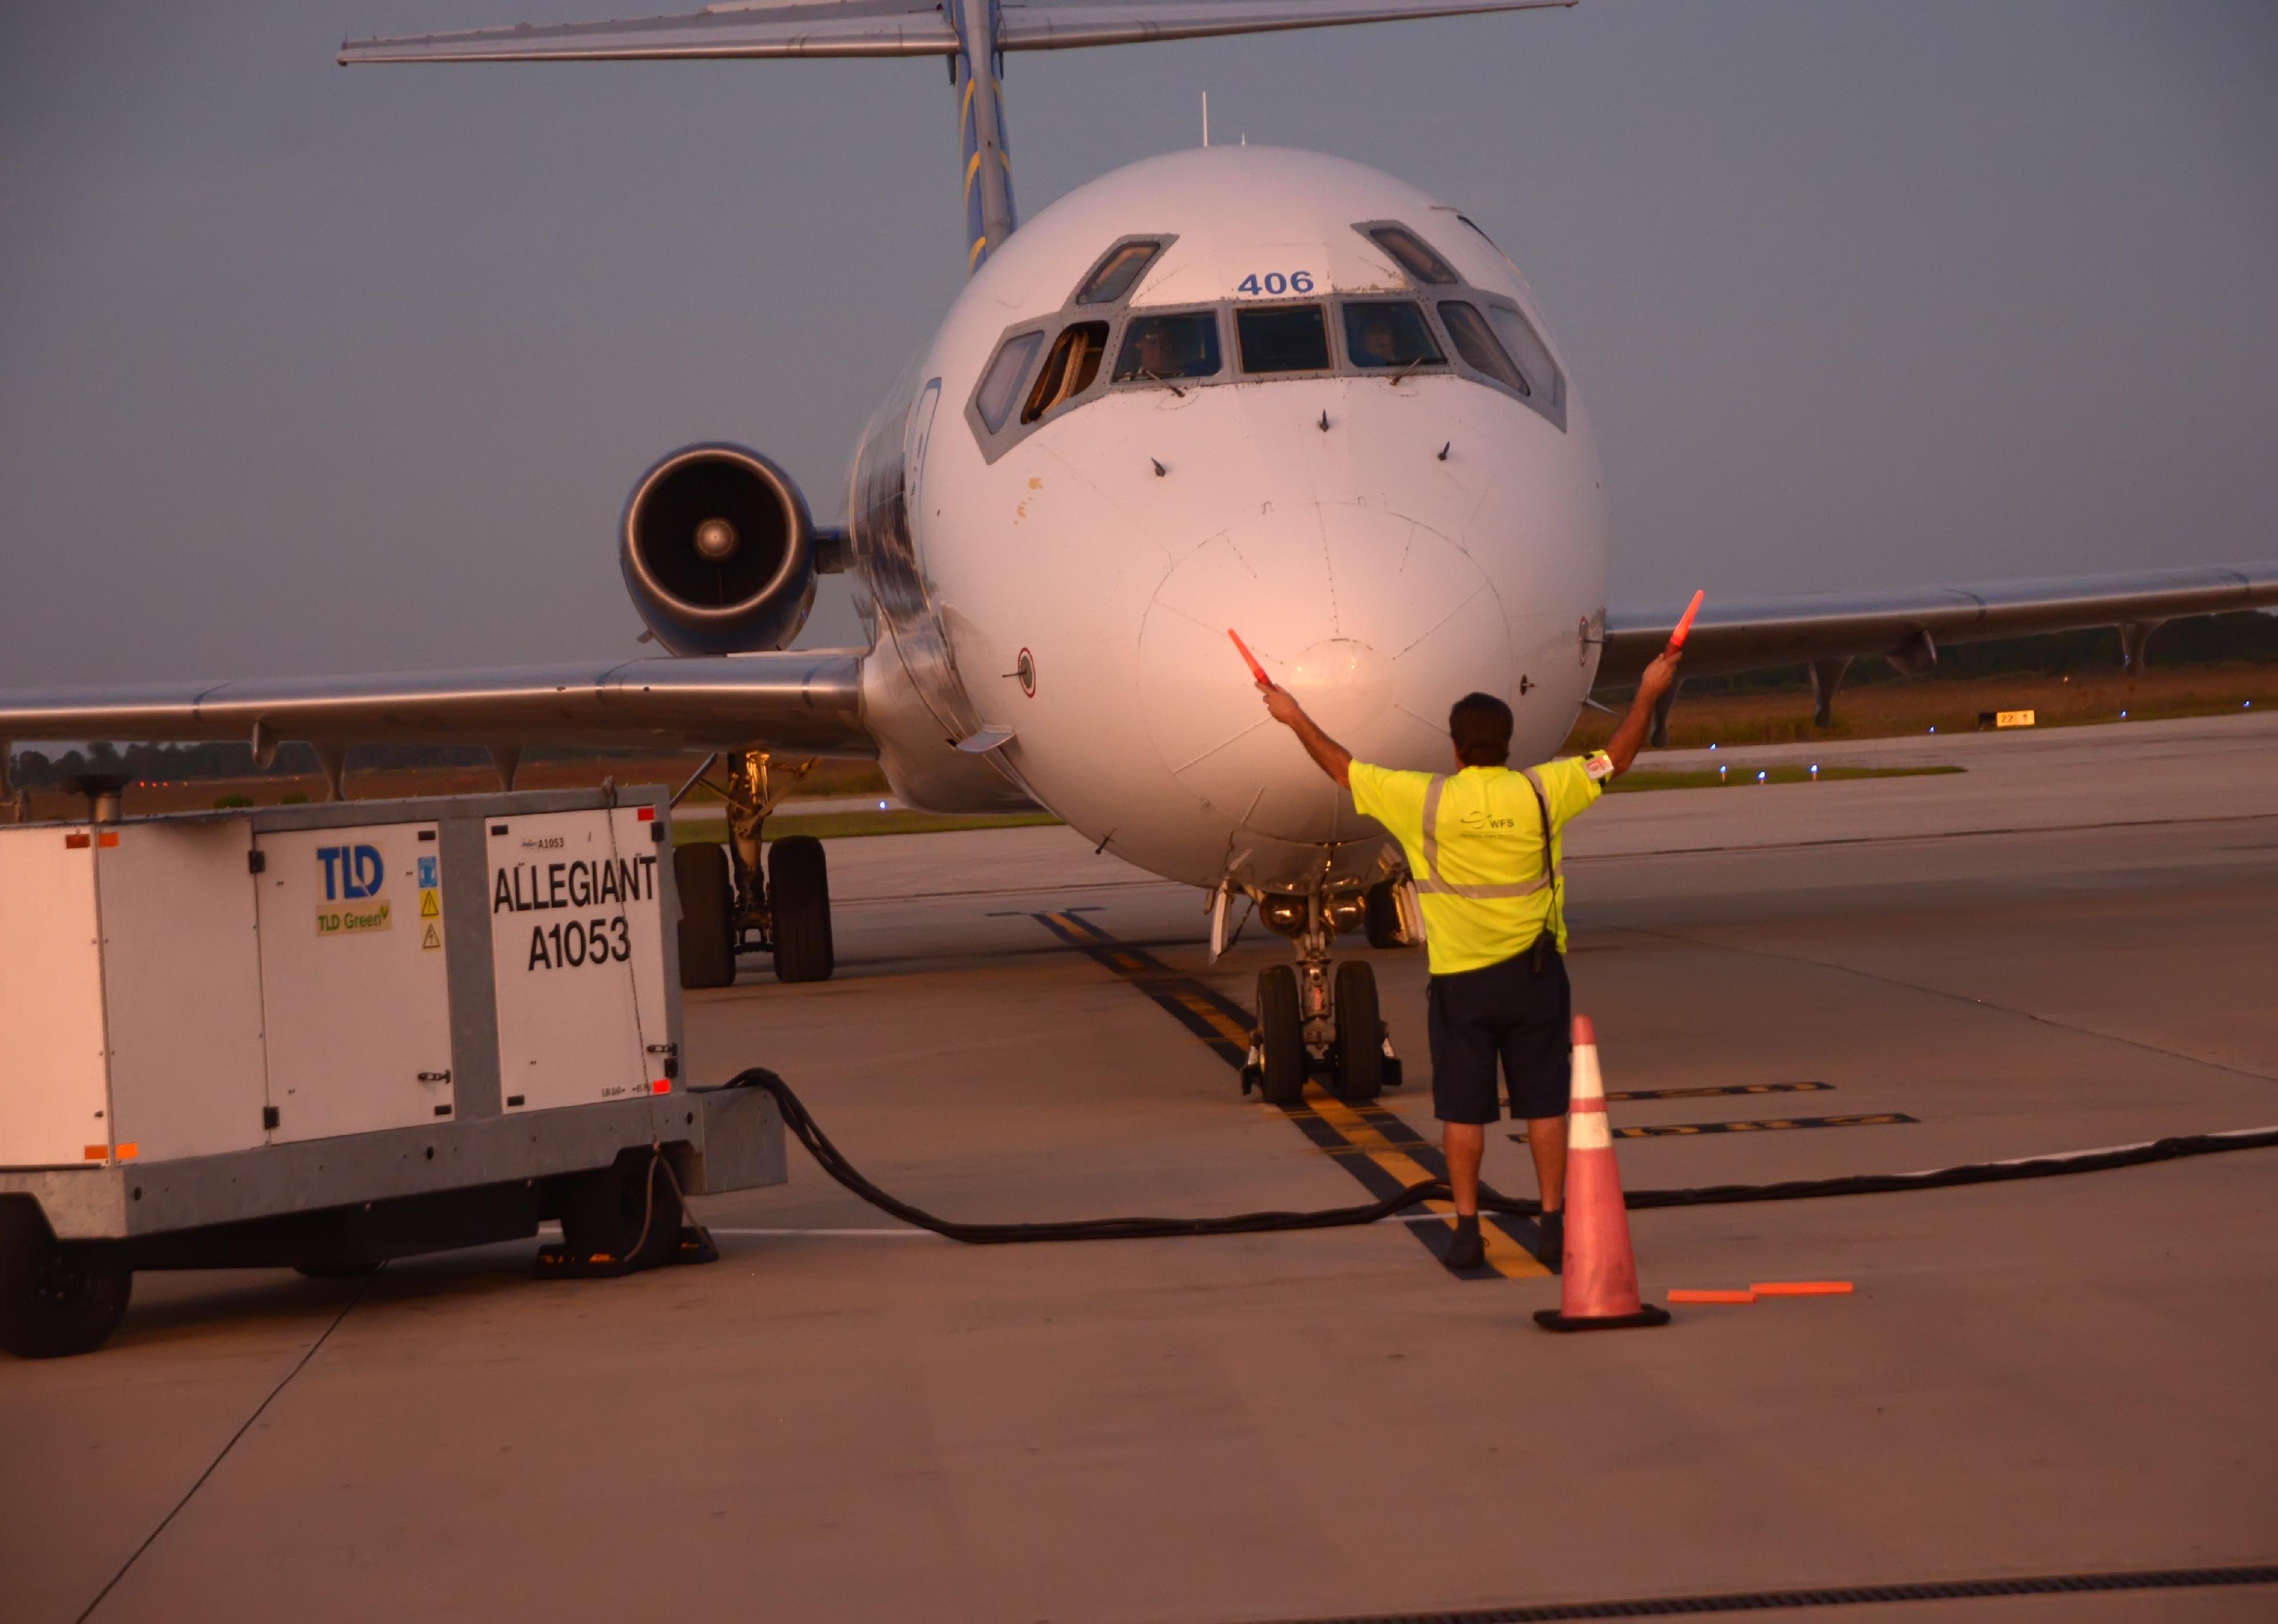
#1. Punta Gorda, Florida: Punta Gorda Airport
An airport employee directs a plane that just landed at Punta Gorda airport.
– Annual flights (August 2021-July 2022): 6,358
– On-time performance: 50.13%
– Air carrier delay: 10.0%
– Weather delay: 1.6%
– National Aviation System delay: 15.3%
– Security delay: 0.0%
– Aircraft arriving late delay: 18.6%
– Cancelled flights: 3.8%
– Diverted flights: 0.5%
You may also like: The most popular hotel chains in America
