Metros sending the most people to El Paso

Epccedu // Wikimedia Commons
Metros sending the most people to El Paso
compiled a list of metros that are sending the most people to El Paso, TX Metro Area using data from the U.S. Census Bureau. Metros are ranked by the estimated number of people who moved to El Paso from the metro between 2015 and 2019. Ties were broken by gross migration.
You may also like: Where people in El Paso are moving to most
![]()

Blankfaze // Wikimedia Commons
#50. Pensacola-Ferry Pass-Brent, FL Metro Area
– Migration to El Paso from Pensacola in 2015-2019: 153 (#51 most common destination from Pensacola)
– Migration from El Paso to Pensacola: 177 (#52 most common destination from El Paso)
– Net migration: 24 to Pensacola

Charles Henry // Flickr
#49. Amarillo, TX Metro Area
– Migration to El Paso from Amarillo in 2015-2019: 164 (#12 most common destination from Amarillo)
– Migration from El Paso to Amarillo: 84 (#80 most common destination from El Paso)
– Net migration: 80 to El Paso

Wtoc11 // Flickr
#48. Hinesville, GA Metro Area
– Migration to El Paso from Hinesville in 2015-2019: 168 (#13 most common destination from Hinesville)
– Migration from El Paso to Hinesville: 108 (#66 most common destination from El Paso)
– Net migration: 60 to El Paso

Stuart Seeger // Wikicommons
#47. Portland-Vancouver-Hillsboro, OR-WA Metro Area
– Migration to El Paso from Portland in 2015-2019: 188 (#74 most common destination from Portland)
– Migration from El Paso to Portland: 104 (#67 most common destination from El Paso)
– Net migration: 84 to El Paso

Zereshk // Wikimedia
#46. Tucson, AZ Metro Area
– Migration to El Paso from Tucson in 2015-2019: 189 (#43 most common destination from Tucson)
– Migration from El Paso to Tucson: 325 (#31 most common destination from El Paso)
– Net migration: 136 to Tucson
You may also like: Highest-paying jobs in El Paso that don’t require a college degree

Kristin Nador // Flickr
#45. Wichita, KS Metro Area
– Migration to El Paso from Wichita in 2015-2019: 193 (#22 most common destination from Wichita)
– Migration from El Paso to Wichita: 431 (#24 most common destination from El Paso)
– Net migration: 238 to Wichita

EQRoy // Shutterstock
#44. Fairbanks, AK Metro Area
– Migration to El Paso from Fairbanks in 2015-2019: 198 (#6 most common destination from Fairbanks)
– Migration from El Paso to Fairbanks: 90 (#77 most common destination from El Paso)
– Net migration: 108 to El Paso

Noel Pennington//Flickr
#43. Memphis, TN-MS-AR Metro Area
– Migration to El Paso from Memphis in 2015-2019: 200 (#47 most common destination from Memphis)
– Migration from El Paso to Memphis: 20 (#147 most common destination from El Paso)
– Net migration: 180 to El Paso

Ron Cogswell//Wikicommons
#42. Richmond, VA Metro Area
– Migration to El Paso from Richmond in 2015-2019: 214 (#38 most common destination from Richmond)
– Migration from El Paso to Richmond: 200 (#43 most common destination from El Paso)
– Net migration: 14 to El Paso

Billy Hathorn // Wikimedia
#41. San Angelo, TX Metro Area
– Migration to El Paso from San Angelo in 2015-2019: 218 (#8 most common destination from San Angelo)
– Migration from El Paso to San Angelo: 73 (#86 most common destination from El Paso)
– Net migration: 145 to El Paso
You may also like: Highest-rated Asian restaurants in El Paso, according to Tripadvisor

Tony Webster // Wikicommons
#40. Minneapolis-St. Paul-Bloomington, MN-WI Metro Area
– Migration to El Paso from Minneapolis in 2015-2019: 222 (#64 most common destination from Minneapolis)
– Migration from El Paso to Minneapolis: 59 (#103 most common destination from El Paso)
– Net migration: 163 to El Paso

Sean Pavone // Shutterstock
#39. St. Louis, MO-IL Metro Area
– Migration to El Paso from St. Louis in 2015-2019: 222 (#71 most common destination from St. Louis)
– Migration from El Paso to St. Louis: 74 (#85 most common destination from El Paso)
– Net migration: 148 to El Paso

Frank K. // Wikicommons
#38. Anchorage, AK Metro Area
– Migration to El Paso from Anchorage in 2015-2019: 272 (#17 most common destination from Anchorage)
– Migration from El Paso to Anchorage: 18 (#155 most common destination from El Paso)
– Net migration: 254 to El Paso

TommyBrison // Shutterstock
#37. Kansas City, MO-KS Metro Area
– Migration to El Paso from Kansas City in 2015-2019: 272 (#53 most common destination from Kansas City)
– Migration from El Paso to Kansas City: 178 (#51 most common destination from El Paso)
– Net migration: 94 to El Paso

PhotosByMahin // Pixabay
#36. Detroit-Warren-Dearborn, MI Metro Area
– Migration to El Paso from Detroit in 2015-2019: 278 (#64 most common destination from Detroit)
– Migration from El Paso to Detroit: 179 (#50 most common destination from El Paso)
– Net migration: 99 to El Paso
You may also like: People from these metros are finding new jobs in El Paso

Songquan Deng // Shutterstock
#35. Orlando-Kissimmee-Sanford, FL Metro Area
– Migration to El Paso from Orlando in 2015-2019: 286 (#61 most common destination from Orlando)
– Migration from El Paso to Orlando: 82 (#81 most common destination from El Paso)
– Net migration: 204 to El Paso

Bob Jagendorf // Wikimedia Commons
#34. Clarksville, TN-KY Metro Area
– Migration to El Paso from Clarksville in 2015-2019: 288 (#19 most common destination from Clarksville)
– Migration from El Paso to Clarksville: 494 (#16 most common destination from El Paso)
– Net migration: 206 to Clarksville

ESB Professional // Shutterstock
#33. Pittsburgh, PA Metro Area
– Migration to El Paso from Pittsburgh in 2015-2019: 292 (#49 most common destination from Pittsburgh)
– Migration from El Paso to Pittsburgh: 8 (#173 most common destination from El Paso)
– Net migration: 284 to El Paso

Kzollman // Wikimedia Commons
#32. Manhattan, KS Metro Area
– Migration to El Paso from Manhattan in 2015-2019: 299 (#8 most common destination from Manhattan)
– Migration from El Paso to Manhattan: 136 (#61 most common destination from El Paso)
– Net migration: 163 to El Paso

GeorgeNeedham // Flickr
#31. Sierra Vista-Douglas, AZ Metro Area
– Migration to El Paso from Sierra Vista in 2015-2019: 306 (#6 most common destination from Sierra Vista)
– Migration from El Paso to Sierra Vista: 240 (#38 most common destination from El Paso)
– Net migration: 66 to El Paso
You may also like: Biggest sources of immigrants to El Paso

Kolossos // Wikimedia Commons
#30. Miami-Fort Lauderdale-Pompano Beach, FL Metro Area
– Migration to El Paso from Miami in 2015-2019: 319 (#84 most common destination from Miami)
– Migration from El Paso to Miami: 146 (#60 most common destination from El Paso)
– Net migration: 173 to El Paso

PghPhxNfk // Wikimedia Commons
#29. Columbus, GA-AL Metro Area
– Migration to El Paso from Columbus in 2015-2019: 321 (#16 most common destination from Columbus)
– Migration from El Paso to Columbus: 350 (#26 most common destination from El Paso)
– Net migration: 29 to Columbus

Public Domain
#28. Seattle-Tacoma-Bellevue, WA Metro Area
– Migration to El Paso from Seattle in 2015-2019: 358 (#68 most common destination from Seattle)
– Migration from El Paso to Seattle: 706 (#9 most common destination from El Paso)
– Net migration: 348 to Seattle

Akhenaton06 // Wikicommons
#27. Columbia, SC Metro Area
– Migration to El Paso from Columbia in 2015-2019: 379 (#19 most common destination from Columbia)
– Migration from El Paso to Columbia: 350 (#26 most common destination from El Paso)
– Net migration: 29 to El Paso

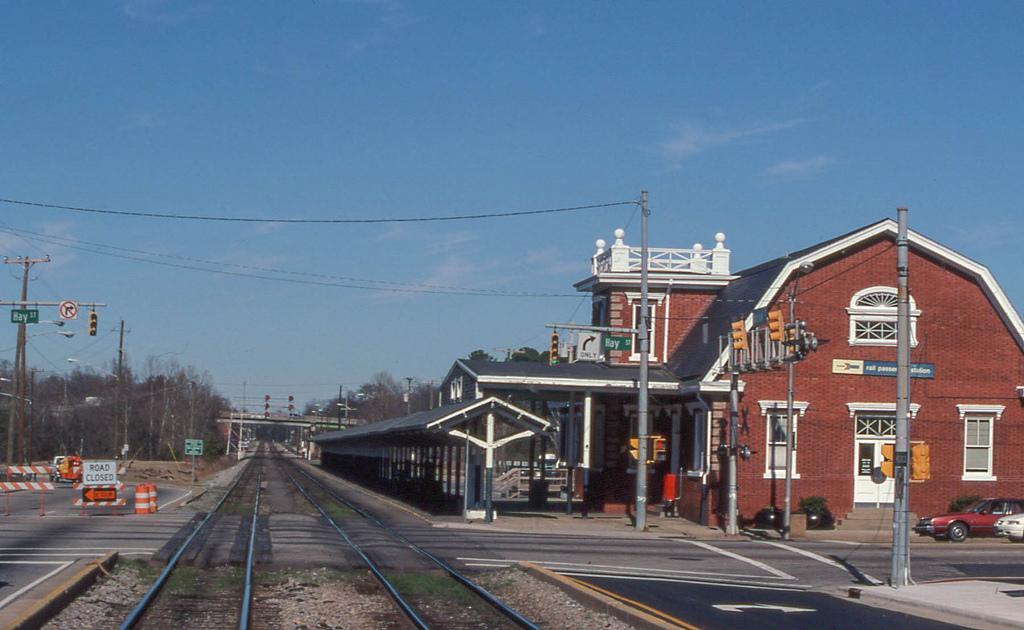
Billy Hathorn // Wikimedia
#26. Killeen-Temple, TX Metro Area
– Migration to El Paso from Killeen in 2015-2019: 399 (#20 most common destination from Killeen)
– Migration from El Paso to Killeen: 983 (#7 most common destination from El Paso)
– Net migration: 584 to Killeen
You may also like: Dogs available for adoption in El Paso

Robert Corby // Wikimedia Commons
#25. Colorado Springs, CO Metro Area
– Migration to El Paso from Colorado Springs in 2015-2019: 403 (#26 most common destination from Colorado Springs)
– Migration from El Paso to Colorado Springs: 315 (#33 most common destination from El Paso)
– Net migration: 88 to El Paso

King of Hearts // Wikimedia
#24. New York-Newark-Jersey City, NY-NJ-PA Metro Area
– Migration to El Paso from New York in 2015-2019: 407 (#132 most common destination from New York)
– Migration from El Paso to New York: 346 (#28 most common destination from El Paso)
– Net migration: 61 to El Paso

SG Arts // Shutterstock
#23. Midland, TX Metro Area
– Migration to El Paso from Midland in 2015-2019: 416 (#5 most common destination from Midland)
– Migration from El Paso to Midland: 460 (#19 most common destination from El Paso)
– Net migration: 44 to Midland

Daniel Orth // Flickr
#22. Riverside-San Bernardino-Ontario, CA Metro Area
– Migration to El Paso from Riverside in 2015-2019: 420 (#60 most common destination from Riverside)
– Migration from El Paso to Riverside: 166 (#57 most common destination from El Paso)
– Net migration: 254 to El Paso

f11photo // Shutterstock
#21. Denver-Aurora-Lakewood, CO Metro Area
– Migration to El Paso from Denver in 2015-2019: 445 (#51 most common destination from Denver)
– Migration from El Paso to Denver: 555 (#13 most common destination from El Paso)
– Net migration: 110 to Denver
You may also like: Highest-rated fine dining restaurants in El Paso, according to Tripadvisor

Elred // Wikimedia Commons
#20. Lubbock, TX Metro Area
– Migration to El Paso from Lubbock in 2015-2019: 446 (#6 most common destination from Lubbock)
– Migration from El Paso to Lubbock: 491 (#17 most common destination from El Paso)
– Net migration: 45 to Lubbock

Joe Mabel // Wikicommons
#19. Olympia-Lacey-Tumwater, WA Metro Area
– Migration to El Paso from Olympia in 2015-2019: 458 (#3 most common destination from Olympia)
– Migration from El Paso to Olympia: 19 (#151 most common destination from El Paso)
– Net migration: 439 to El Paso

WillHuebie // Shutterstock
#18. Lawton, OK Metro Area
– Migration to El Paso from Lawton in 2015-2019: 461 (#3 most common destination from Lawton)
– Migration from El Paso to Lawton: 318 (#32 most common destination from El Paso)
– Net migration: 143 to El Paso

Public Domain
#17. Brownsville-Harlingen, TX Metro Area
– Migration to El Paso from Brownsville in 2015-2019: 465 (#7 most common destination from Brownsville)
– Migration from El Paso to Brownsville: 40 (#121 most common destination from El Paso)
– Net migration: 425 to El Paso

Public Domain
#16. Watertown-Fort Drum, NY Metro Area
– Migration to El Paso from Watertown in 2015-2019: 465 (#5 most common destination from Watertown)
– Migration from El Paso to Watertown: 169 (#55 most common destination from El Paso)
– Net migration: 296 to El Paso
You may also like: Highest-earning zip codes in El Paso metro area

Edmund Garman // Flickr
#15. Urban Honolulu, HI Metro Area
– Migration to El Paso from Urban Honolulu in 2015-2019: 470 (#26 most common destination from Urban Honolulu)
– Migration from El Paso to Urban Honolulu: 458 (#21 most common destination from El Paso)
– Net migration: 12 to El Paso

Keizers // Wikimedia Commons
#14. Atlanta-Sandy Springs-Alpharetta, GA Metro Area
– Migration to El Paso from Atlanta in 2015-2019: 485 (#83 most common destination from Atlanta)
– Migration from El Paso to Atlanta: 460 (#19 most common destination from El Paso)
– Net migration: 25 to El Paso

M.Bucka // Wikimedia Commons
#13. Albuquerque, NM Metro Area
– Migration to El Paso from Albuquerque in 2015-2019: 503 (#12 most common destination from Albuquerque)
– Migration from El Paso to Albuquerque: 546 (#14 most common destination from El Paso)
– Net migration: 43 to Albuquerque

Pixabay
#12. Austin-Round Rock-Georgetown, TX Metro Area
– Migration to El Paso from Austin in 2015-2019: 594 (#28 most common destination from Austin)
– Migration from El Paso to Austin: 1,426 (#5 most common destination from El Paso)
– Net migration: 832 to Austin
davidwilson1949 // Flickr
#11. Fayetteville, NC Metro Area
– Migration to El Paso from Fayetteville in 2015-2019: 600 (#15 most common destination from Fayetteville)
– Migration from El Paso to Fayetteville: 690 (#11 most common destination from El Paso)
– Net migration: 90 to Fayetteville
You may also like: Highest and lowest paying health care jobs in El Paso

SD Dirk // Flickr
#10. San Diego-Chula Vista-Carlsbad, CA Metro Area
– Migration to El Paso from San Diego in 2015-2019: 728 (#39 most common destination from San Diego)
– Migration from El Paso to San Diego: 186 (#48 most common destination from El Paso)
– Net migration: 542 to El Paso

BDS2006 // Wikimedia
#9. Los Angeles-Long Beach-Anaheim, CA Metro Area
– Migration to El Paso from Los Angeles in 2015-2019: 737 (#69 most common destination from Los Angeles)
– Migration from El Paso to Los Angeles: 991 (#6 most common destination from El Paso)
– Net migration: 254 to Los Angeles

Andrew Bossi // Wikimedia
#8. Washington-Arlington-Alexandria, DC-VA-MD-WV Metro Area
– Migration to El Paso from Washington in 2015-2019: 773 (#66 most common destination from Washington)
– Migration from El Paso to Washington: 703 (#10 most common destination from El Paso)
– Net migration: 70 to El Paso

DPPed// Wikimedia
#7. Phoenix-Mesa-Chandler, AZ Metro Area
– Migration to El Paso from Phoenix in 2015-2019: 890 (#31 most common destination from Phoenix)
– Migration from El Paso to Phoenix: 858 (#8 most common destination from El Paso)
– Net migration: 32 to El Paso

Christopher & Amy Esposito // Wikicommons
#6. Chicago-Naperville-Elgin, IL-IN-WI Metro Area
– Migration to El Paso from Chicago in 2015-2019: 927 (#64 most common destination from Chicago)
– Migration from El Paso to Chicago: 448 (#23 most common destination from El Paso)
– Net migration: 479 to El Paso
You may also like: Most common jobs in El Paso

skeeze // Pixabay
#5. Houston-The Woodlands-Sugar Land, TX Metro Area
– Migration to El Paso from Houston in 2015-2019: 969 (#33 most common destination from Houston)
– Migration from El Paso to Houston: 2,388 (#2 most common destination from El Paso)
– Net migration: 1,419 to Houston

Rusalkin Dmytro // Shutterstock
#4. Odessa, TX Metro Area
– Migration to El Paso from Odessa in 2015-2019: 1,176 (#2 most common destination from Odessa)
– Migration from El Paso to Odessa: 538 (#15 most common destination from El Paso)
– Net migration: 638 to El Paso

Pixabay
#3. San Antonio-New Braunfels, TX Metro Area
– Migration to El Paso from San Antonio in 2015-2019: 1,663 (#7 most common destination from San Antonio)
– Migration from El Paso to San Antonio: 2,236 (#4 most common destination from El Paso)
– Net migration: 573 to San Antonio

Alan Botting // Wikimedia Commons
#2. Dallas-Fort Worth-Arlington, TX Metro Area
– Migration to El Paso from Dallas in 2015-2019: 2,074 (#22 most common destination from Dallas)
– Migration from El Paso to Dallas: 2,297 (#3 most common destination from El Paso)
– Net migration: 223 to Dallas
Public Domain
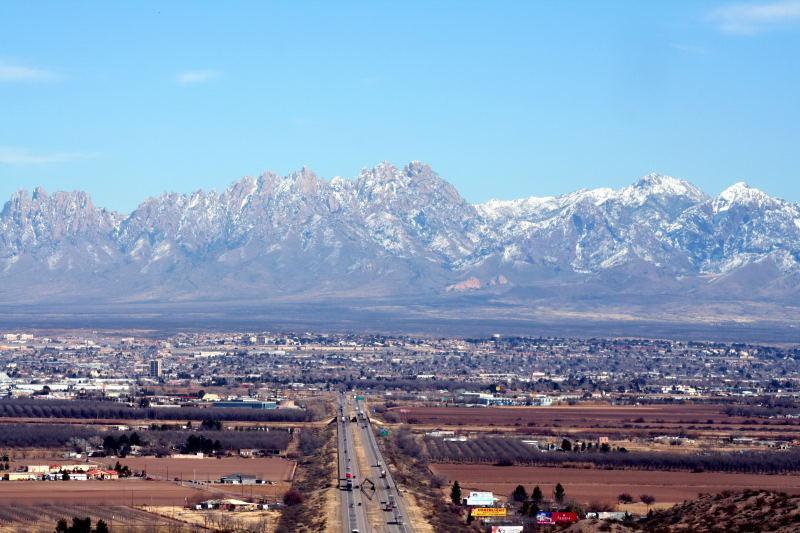
#1. Las Cruces, NM Metro Area
– Migration to El Paso from Las Cruces in 2015-2019: 2,257 (#1 most common destination from Las Cruces)
– Migration from El Paso to Las Cruces: 2,587 (#1 most common destination from El Paso)
– Net migration: 330 to Las Cruces
You may also like: Closest national parks to El Paso
