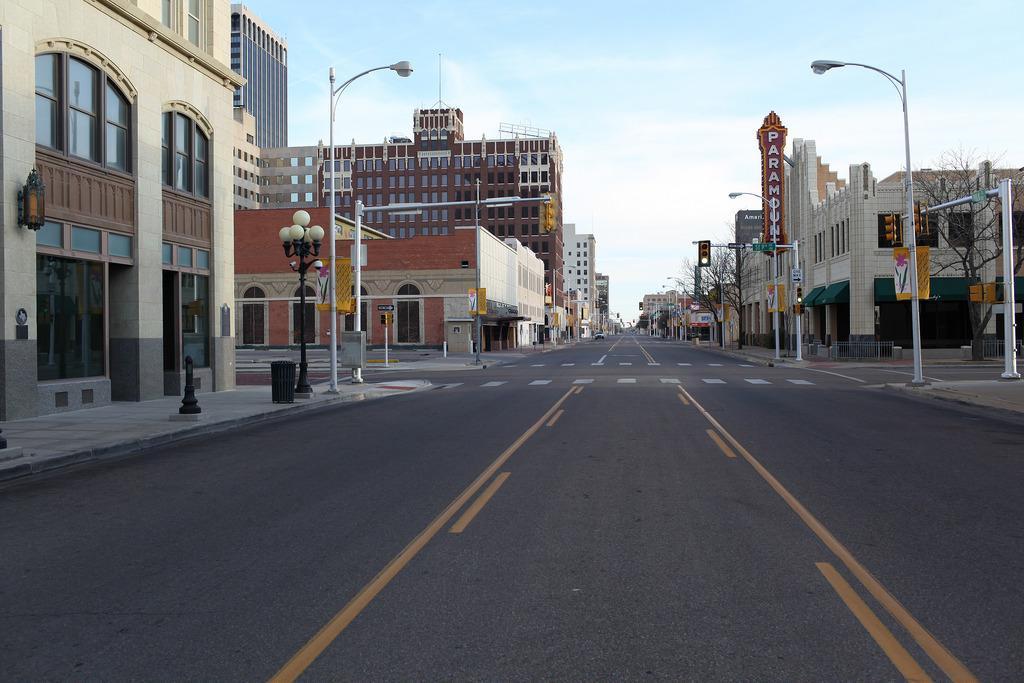
Counties with the lowest hospital bed capacity in Texas

Larry D. Moore // Wikimedia Commons
Counties with the lowest hospital bed capacity in Texas
The vaccine deployment in December 2020 signaled a turning point in the COVID-19 pandemic. By the end of May 2021, 40% of the U.S. population was fully vaccinated. But as vaccination rates lagged over the summer, new surges of COVID-19 came, including Delta in the summer of 2021, and now the Omicron variant, which comprises the majority of cases in the U.S.
Researchers around the world have reported that Omicron is more transmissible than Delta, making breakthrough and repeat infections more likely. Early research suggests this strain may cause less severe illness than Delta and the original virus, however, health officials have warned an Omicron-driven surge could still increase hospitalization and death rates—especially in areas with less vaccinated populations.
The United States as of Feb. 24 reached 942,985 COVID-19-related deaths and nearly 78.7 million COVID-19 cases, according to Johns Hopkins University. Currently, 64.8% of the population is fully vaccinated, and 43.4% have received booster doses.
Stacker compiled a list of the counties with the lowest in-patient bed capacity in Texas using data from the U.S. Department of Health & Human Services and vaccination data from Covid Act Now. Counties are ranked by the percent of in-patient hospital beds filled as of Feb. 23, with the percent of hospital beds filled by COVID-19 patients serving as a tiebreaker. Hospitalization data was available for about 77% of counties in the U.S. Keep reading to see what hospital capacity looks like in your county.
![]()
Elred // Wikimedia Commons
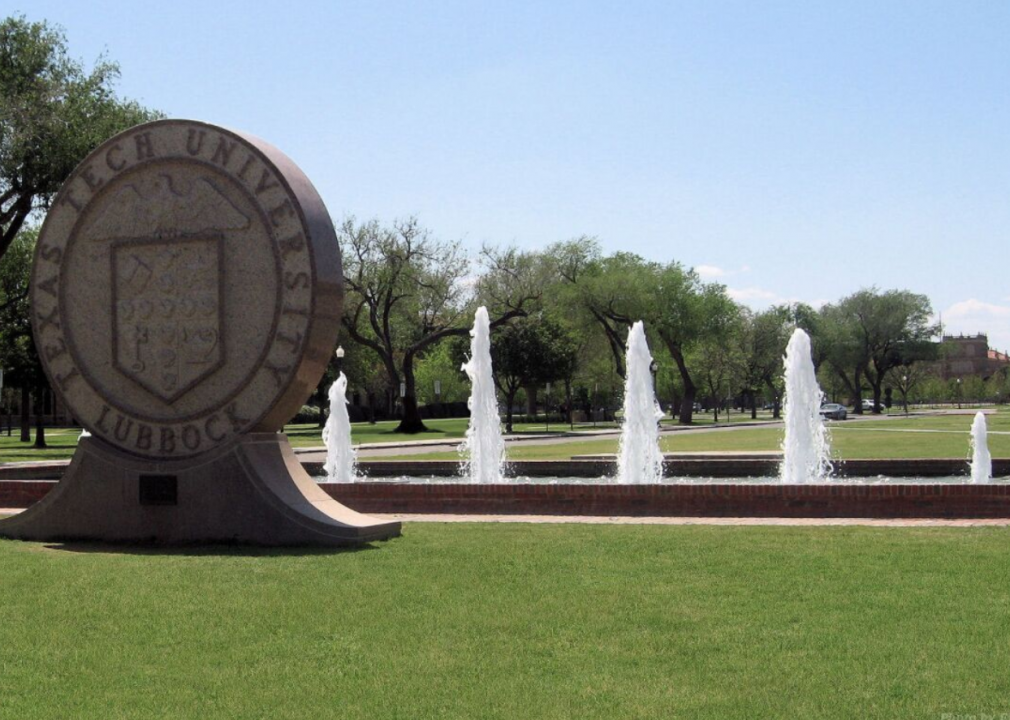
#50. Lubbock County, TX
– Inpatient beds occupied: 73.0% (8.0% by COVID-19 patients)
— 9.9% more availability than Texas overall
– ICU beds occupied: 86.0% (13.0% by COVID-19 patients)
— 9.5% more availability than Texas overall
– Cases per 100k in last 7 days: 89 (276 cases)
– Population that is fully vaccinated: 47.9% (148,812 fully vaccinated)
— -20.0% lower vaccination rate than Texas
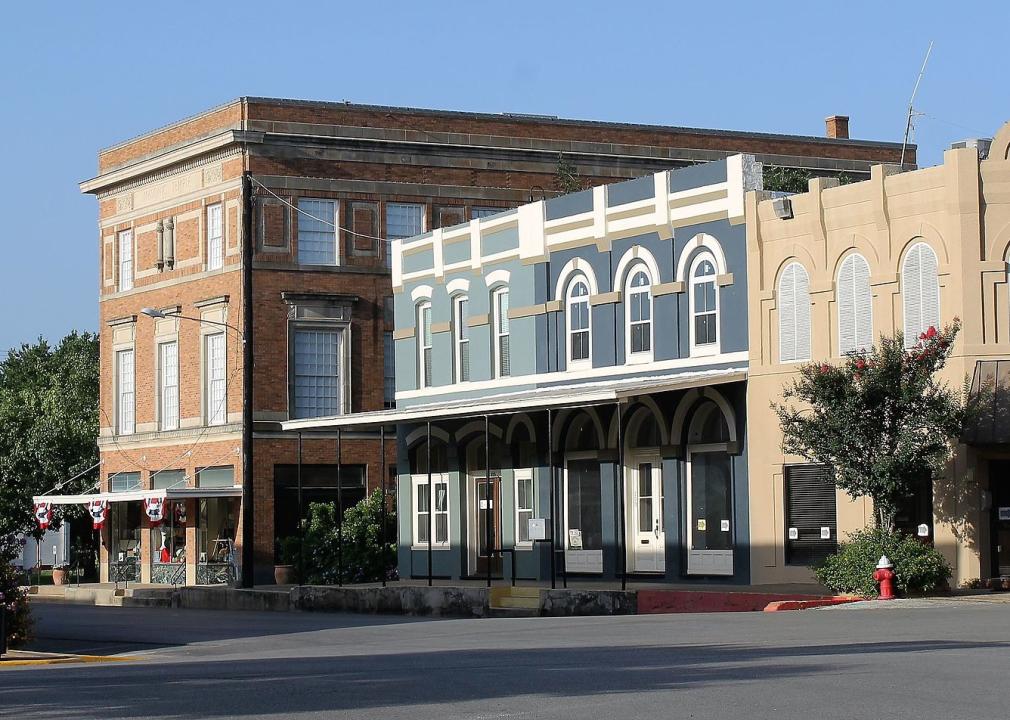
Billy Hathorn // Wikimedia Commons
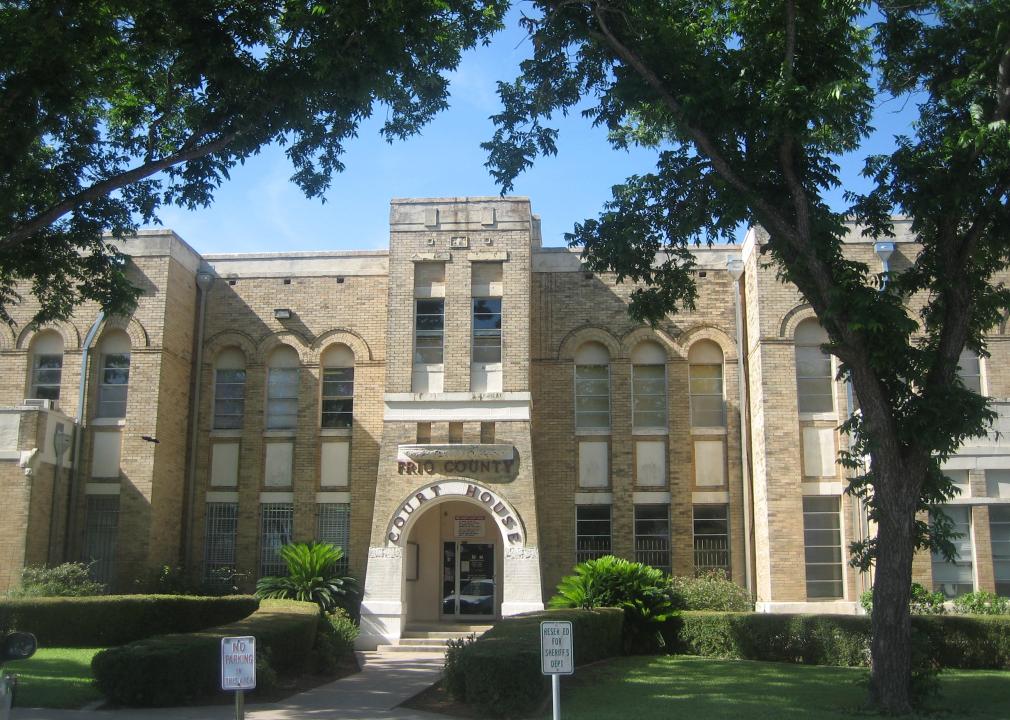
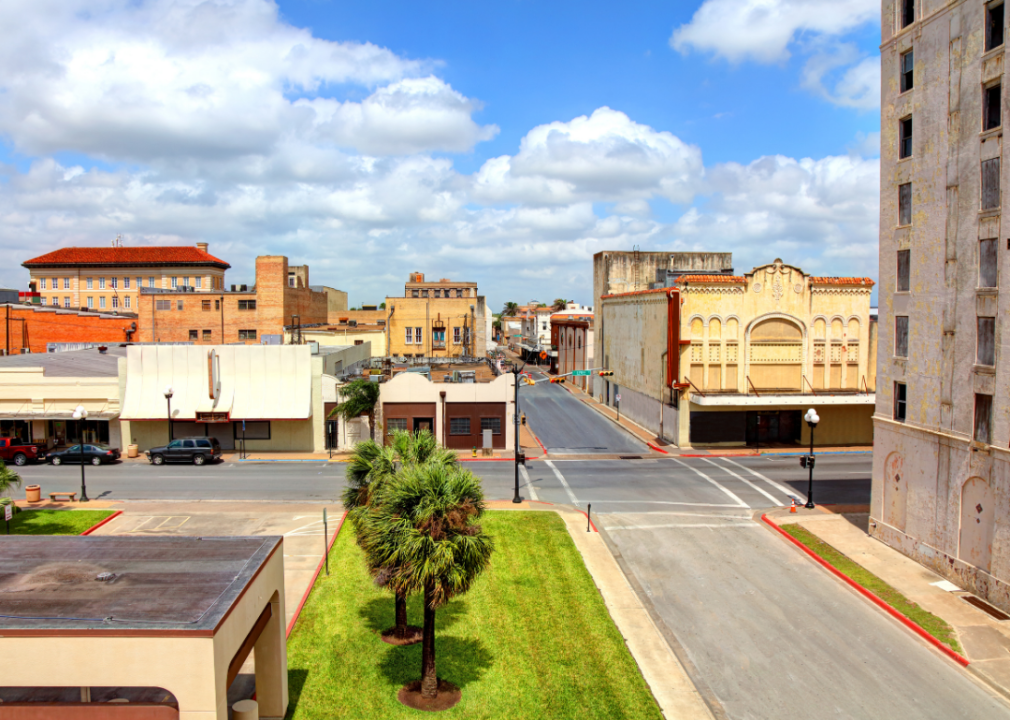
#49. Frio County, TX
– Inpatient beds occupied: 73.0% (1.0% by COVID-19 patients)
— 9.9% more availability than Texas overall
– ICU beds occupied: data not available
— 95% full in Texas overall
– Cases per 100k in last 7 days: 463 (94 cases)
– Population that is fully vaccinated: 61.4% (12,475 fully vaccinated)
— 2.5% higher vaccination rate than Texas
Billy Hathorn // Wikimedia Commons
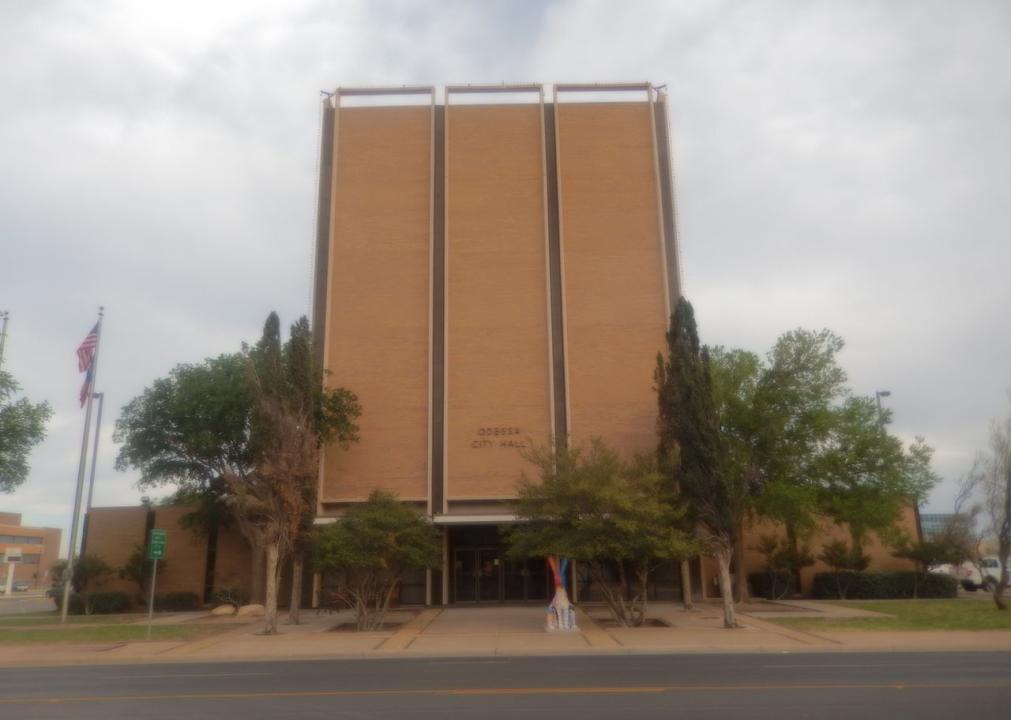
#48. Ector County, TX
– Inpatient beds occupied: 75.0% (11.0% by COVID-19 patients)
— 7.4% more availability than Texas overall
– ICU beds occupied: 74.0% (17.0% by COVID-19 patients)
— 22.1% more availability than Texas overall
– Cases per 100k in last 7 days: 60 (99 cases)
– Population that is fully vaccinated: 42.3% (70,252 fully vaccinated)
— -29.4% lower vaccination rate than Texas

Aualliso // Wikimedia Commons
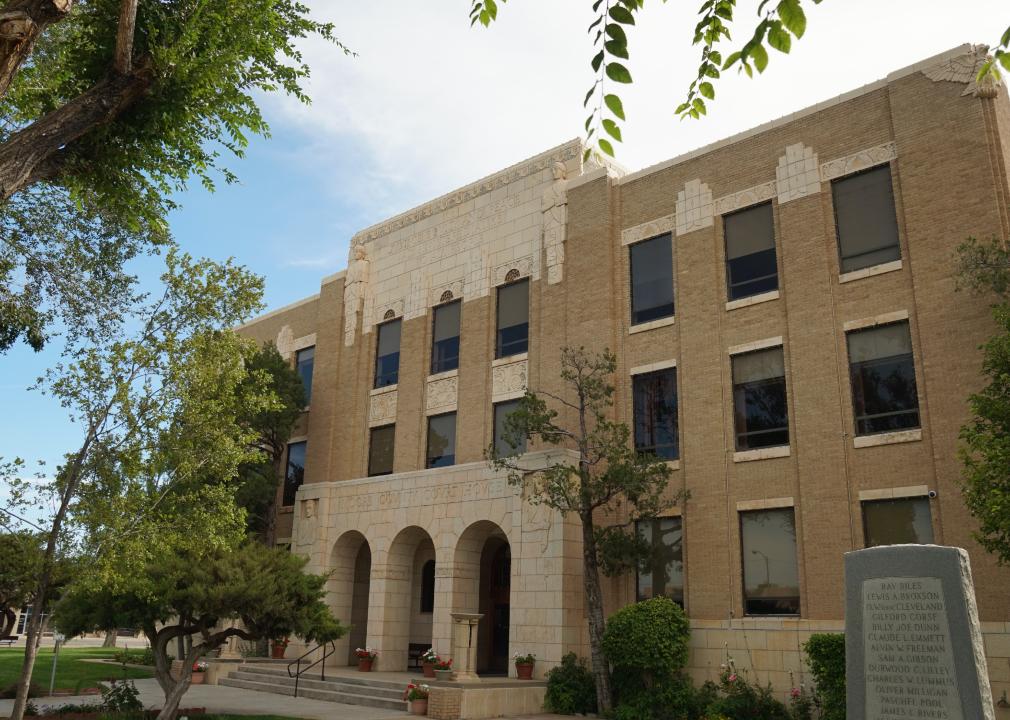
#47. Coryell County, TX
– Inpatient beds occupied: 75.0% (2.0% by COVID-19 patients)
— 7.4% more availability than Texas overall
– ICU beds occupied: data not available
— 95% full in Texas overall
– Cases per 100k in last 7 days: 90 (68 cases)
– Population that is fully vaccinated: 52.6% (39,921 fully vaccinated)
— -12.2% lower vaccination rate than Texas
Robert Blaine Camp // Wikimedia Commons
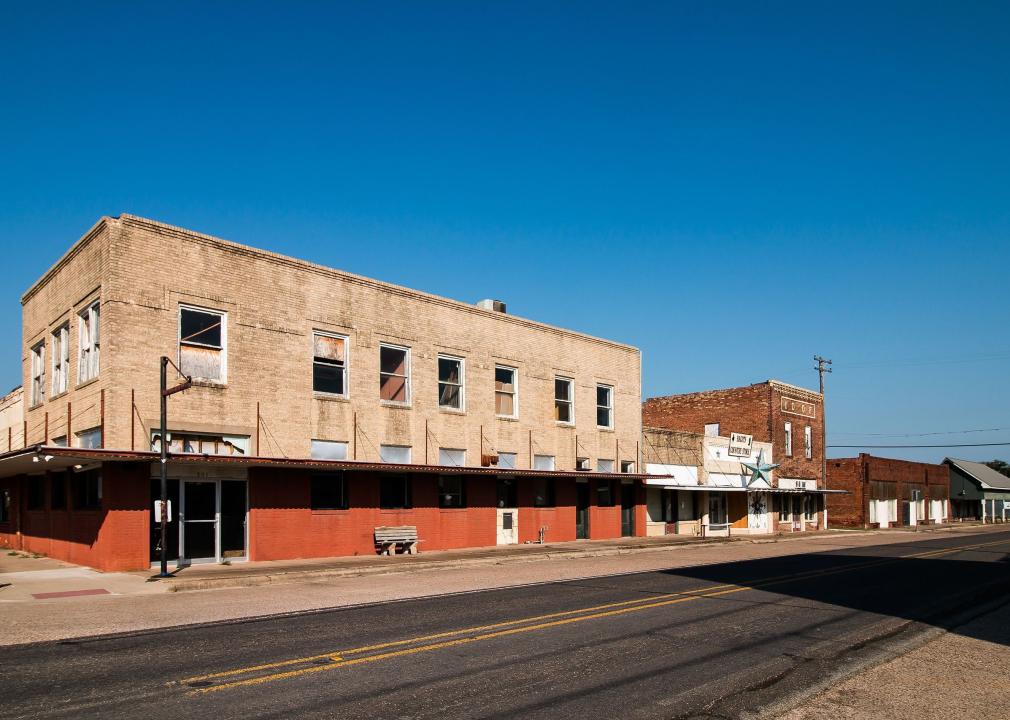
#46. Moore County, TX
– Inpatient beds occupied: 76.0% (3.0% by COVID-19 patients)
— 6.2% more availability than Texas overall
– ICU beds occupied: data not available
— 95% full in Texas overall
– Cases per 100k in last 7 days: 382 (80 cases)
– Population that is fully vaccinated: 44.5% (9,325 fully vaccinated)
— -25.7% lower vaccination rate than Texas
Renelibrary // Wikimedia Commons
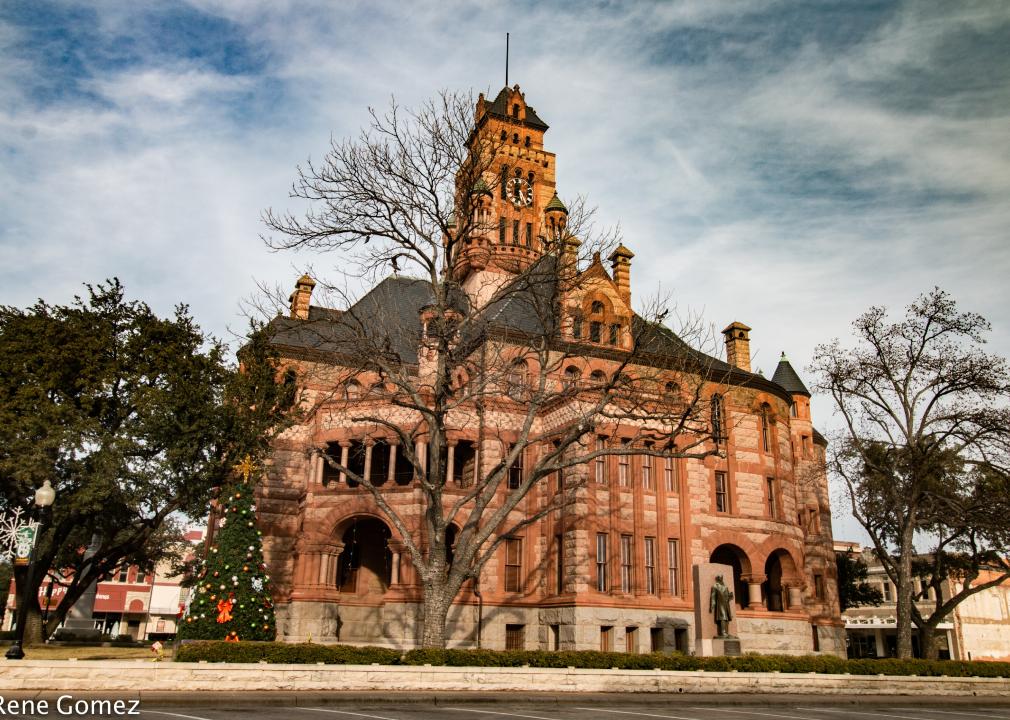
#45. Navarro County, TX
– Inpatient beds occupied: 78.0% (24.0% by COVID-19 patients)
— 3.7% more availability than Texas overall
– ICU beds occupied: 84.0% (22.0% by COVID-19 patients)
— 11.6% more availability than Texas overall
– Cases per 100k in last 7 days: 214 (107 cases)
– Population that is fully vaccinated: 44.7% (22,380 fully vaccinated)
— -25.4% lower vaccination rate than Texas
Farragutful // Wikimedia Commons
#44. Smith County, TX
– Inpatient beds occupied: 78.0% (16.0% by COVID-19 patients)
— 3.7% more availability than Texas overall
– ICU beds occupied: 90.0% (27.0% by COVID-19 patients)
— 5.3% more availability than Texas overall
– Cases per 100k in last 7 days: 147 (343 cases)
– Population that is fully vaccinated: 45.2% (105,284 fully vaccinated)
— -24.5% lower vaccination rate than Texas
Aualliso // Wikimedia Commons
#43. Bosque County, TX
– Inpatient beds occupied: 78.0% (14.0% by COVID-19 patients)
— 3.7% more availability than Texas overall
– ICU beds occupied: data not available
— 95% full in Texas overall
– Cases per 100k in last 7 days: 150 (28 cases)
– Population that is fully vaccinated: 46.0% (8,589 fully vaccinated)
— -23.2% lower vaccination rate than Texas
Billy Hathorn // Wikimedia Commons
#42. Burnet County, TX
– Inpatient beds occupied: 82.0% (16.0% by COVID-19 patients)
— 1.2% more full than Texas overall
– ICU beds occupied: 77.0% (33.0% by COVID-19 patients)
— 18.9% more availability than Texas overall
– Cases per 100k in last 7 days: 116 (56 cases)
– Population that is fully vaccinated: 53.1% (25,553 fully vaccinated)
— -11.4% lower vaccination rate than Texas
Kairos14 // Wikimedia Commons
#41. Hood County, TX
– Inpatient beds occupied: 83.0% (19.0% by COVID-19 patients)
— 2.5% more full than Texas overall
– ICU beds occupied: 71.0% (40.0% by COVID-19 patients)
— 25.3% more availability than Texas overall
– Cases per 100k in last 7 days: 135 (83 cases)
– Population that is fully vaccinated: 49.9% (30,748 fully vaccinated)
— -16.7% lower vaccination rate than Texas
Carol M. Highsmith // Wikimedia Commons
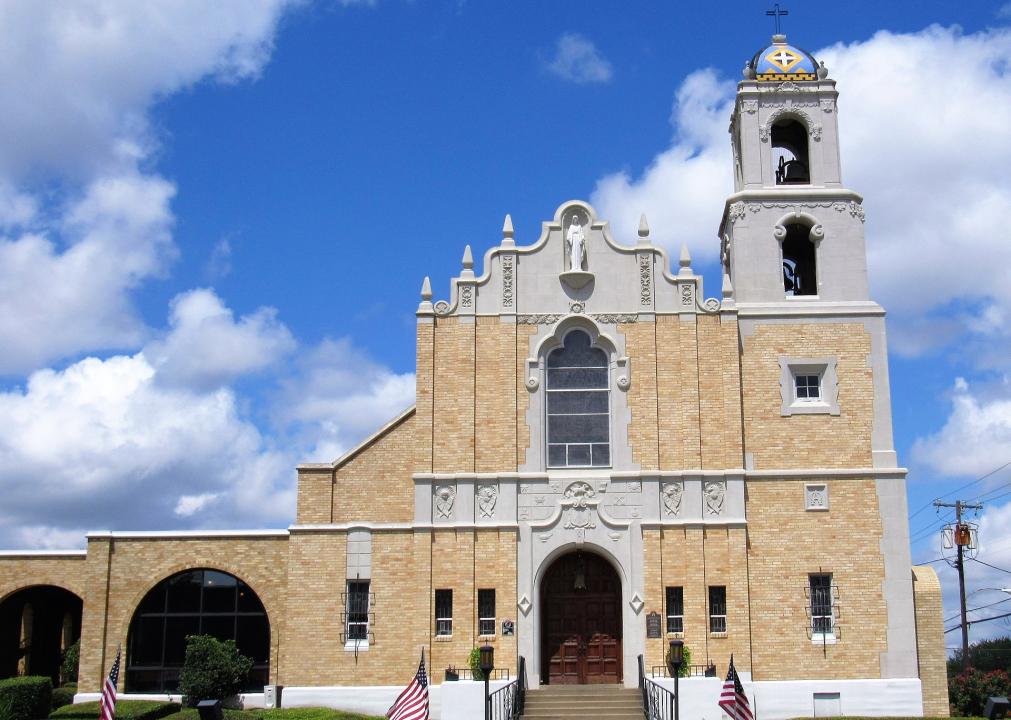
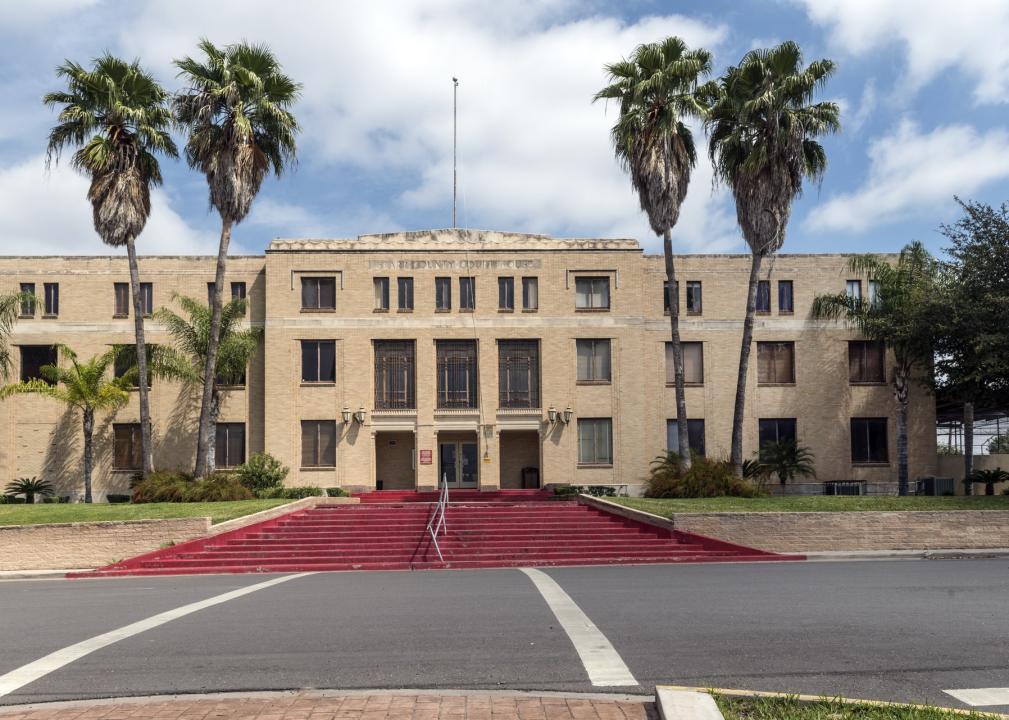
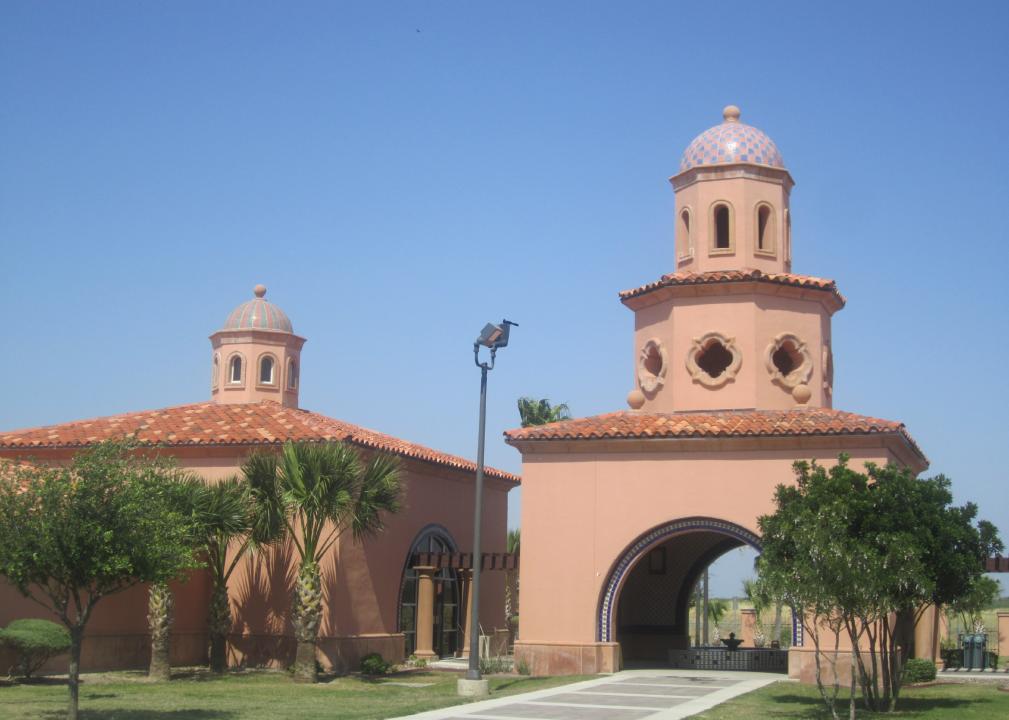
#40. Starr County, TX
– Inpatient beds occupied: 83.0% (16.0% by COVID-19 patients)
— 2.5% more full than Texas overall
– ICU beds occupied: data not available
— 95% full in Texas overall
– Cases per 100k in last 7 days: 840 (543 cases)
– Population that is fully vaccinated: 84.9% (54,867 fully vaccinated)
— 41.7% higher vaccination rate than Texas
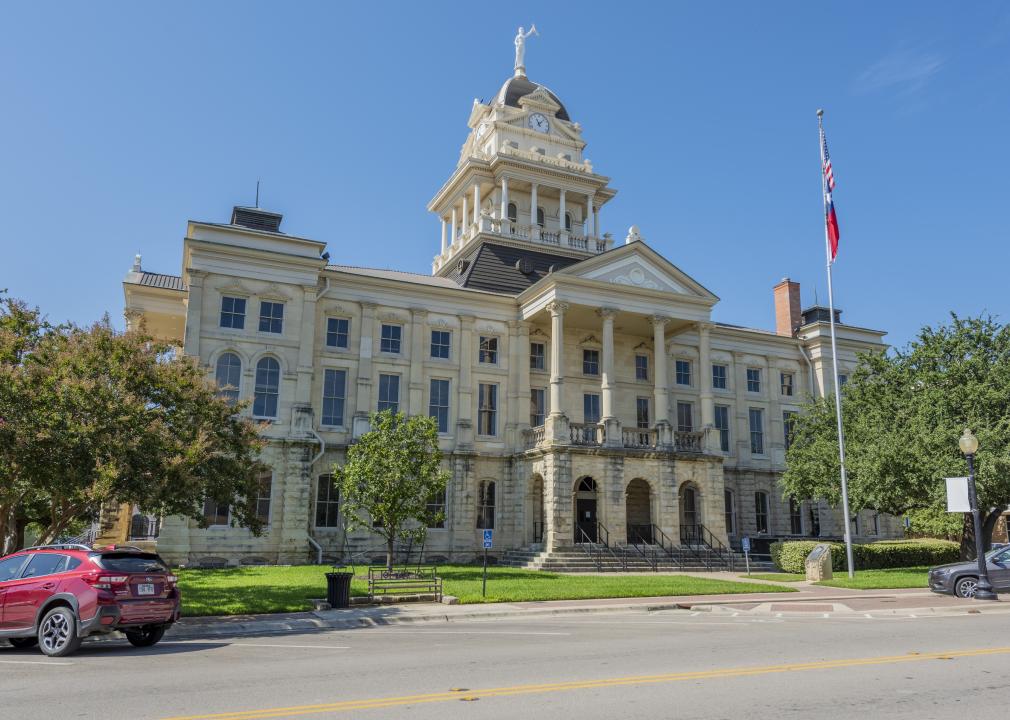
Larry D. Moore // Wikimedia Commons
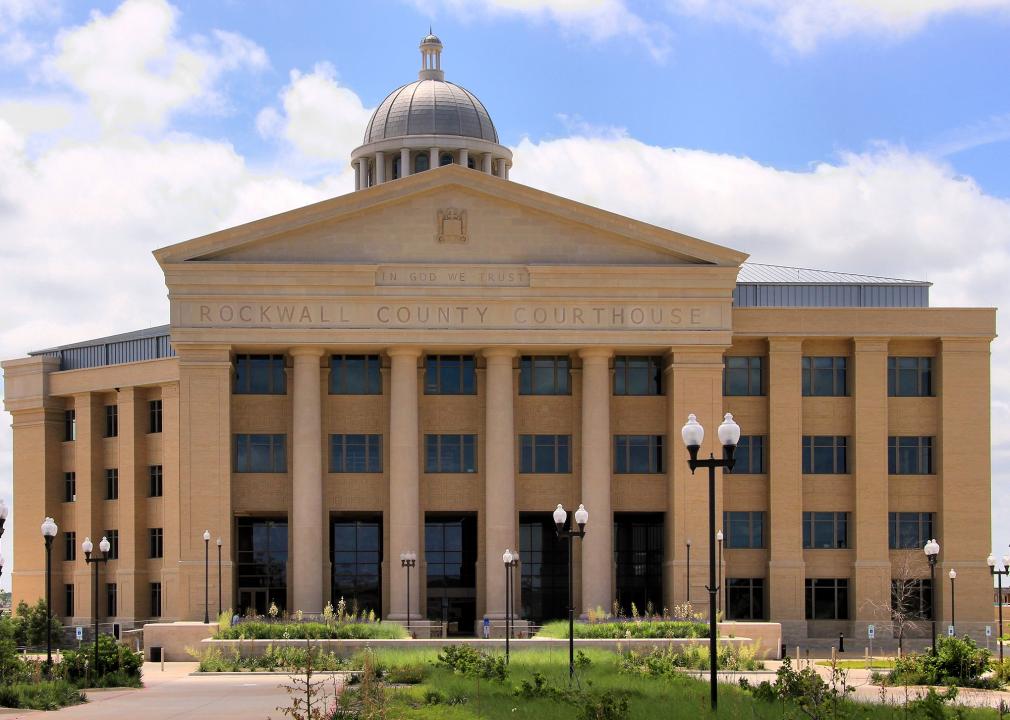
#39. Rockwall County, TX
– Inpatient beds occupied: 84.0% (23.0% by COVID-19 patients)
— 3.7% more full than Texas overall
– ICU beds occupied: 64.0% (33.0% by COVID-19 patients)
— 32.6% more availability than Texas overall
– Cases per 100k in last 7 days: 75 (79 cases)
– Population that is fully vaccinated: 57.7% (60,572 fully vaccinated)
— -3.7% lower vaccination rate than Texas
Larry D. Moore // Wikimedia Commons
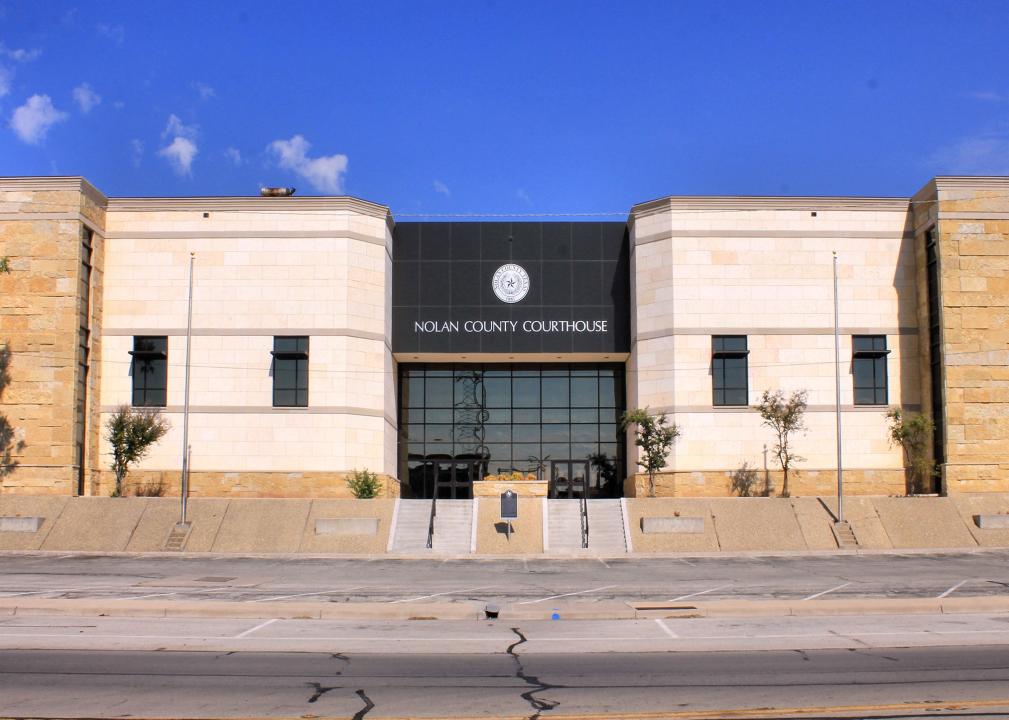
#38. Nolan County, TX
– Inpatient beds occupied: 84.0% (23.0% by COVID-19 patients)
— 3.7% more full than Texas overall
– ICU beds occupied: 73.0% (5.0% by COVID-19 patients)
— 23.2% more availability than Texas overall
– Cases per 100k in last 7 days: 211 (31 cases)
– Population that is fully vaccinated: 41.4% (6,087 fully vaccinated)
— -30.9% lower vaccination rate than Texas
Public Domain
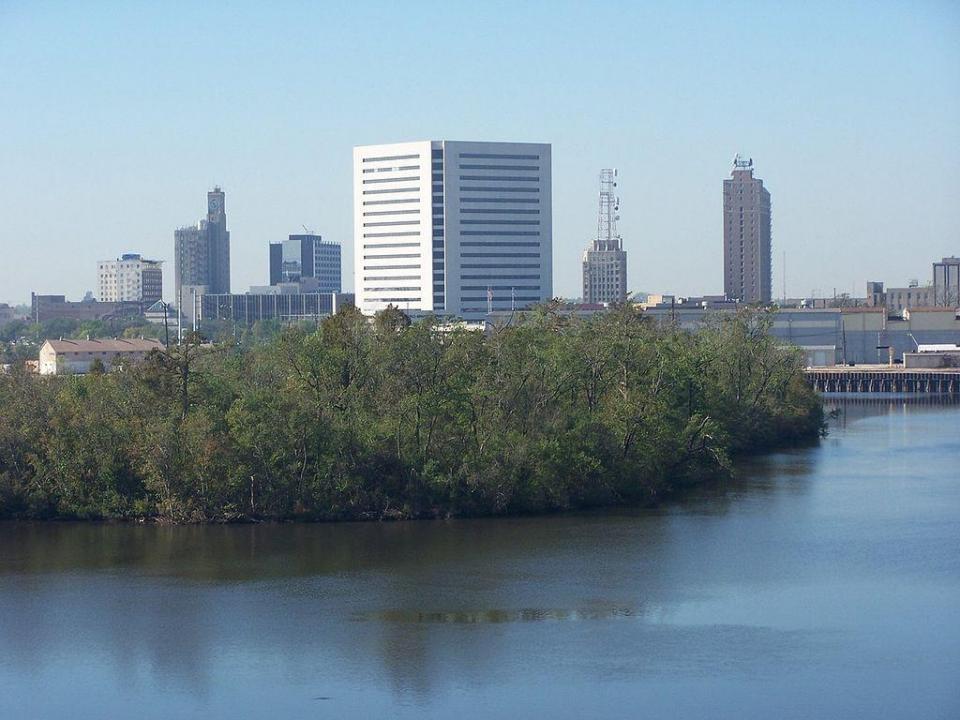
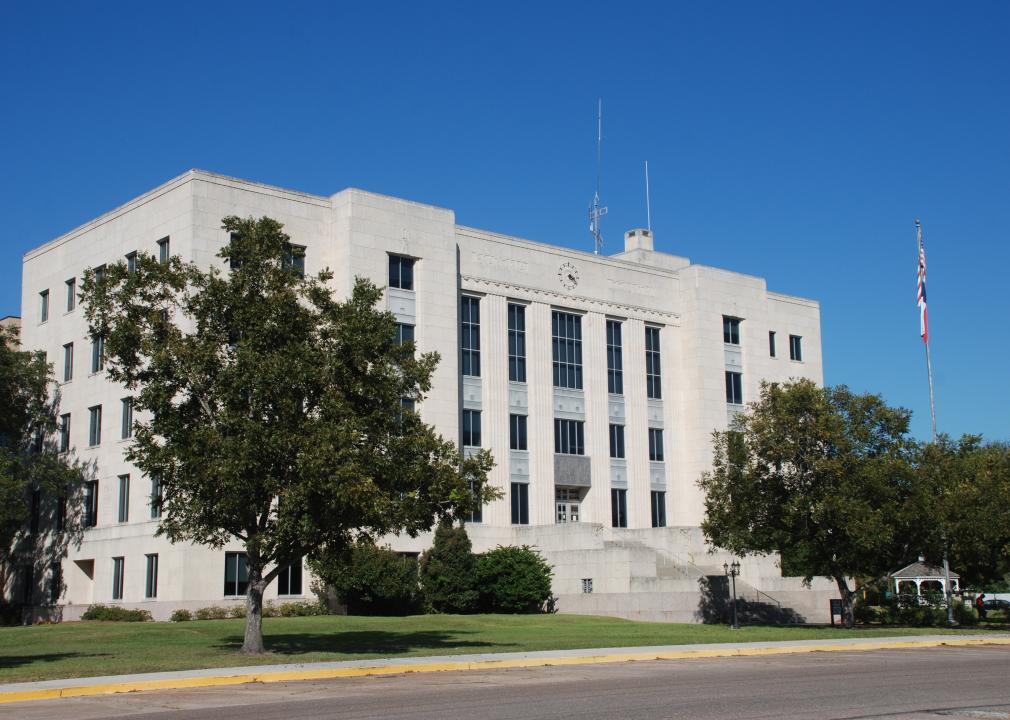
#37. Jefferson County, TX
– Inpatient beds occupied: 84.0% (10.0% by COVID-19 patients)
— 3.7% more full than Texas overall
– ICU beds occupied: 84.0% (19.0% by COVID-19 patients)
— 11.6% more availability than Texas overall
– Cases per 100k in last 7 days: 250 (630 cases)
– Population that is fully vaccinated: 50.2% (126,280 fully vaccinated)
— -16.2% lower vaccination rate than Texas
Mick Watson from Atascocita, Texas // Wikimedia Commons
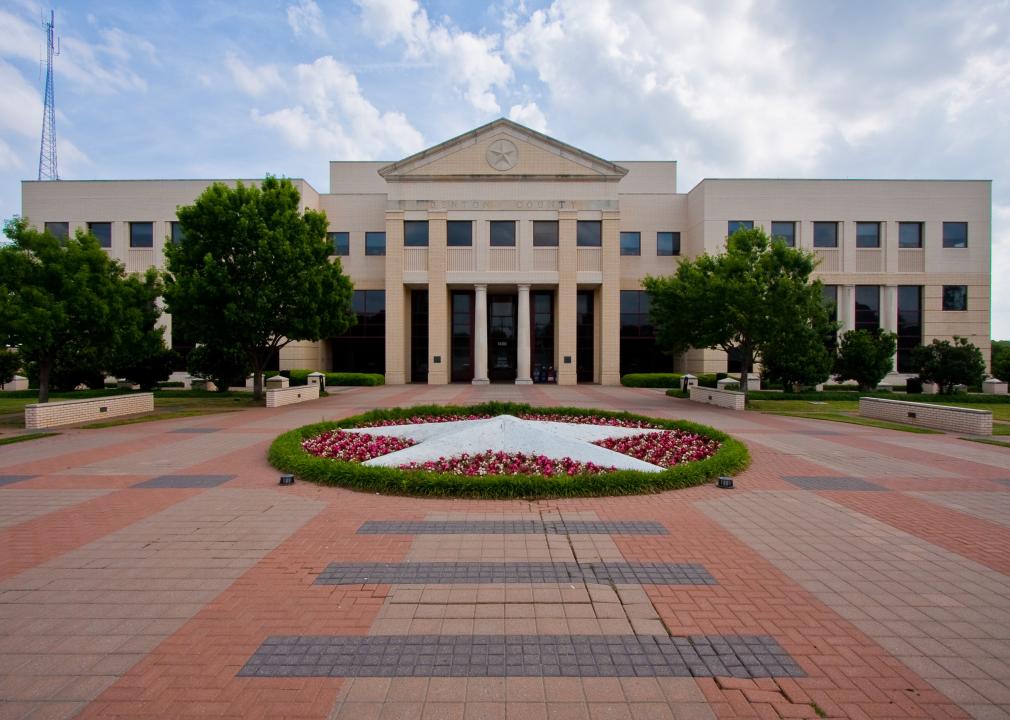
#36. Denton County, TX
– Inpatient beds occupied: 84.0% (12.0% by COVID-19 patients)
— 3.7% more full than Texas overall
– ICU beds occupied: 89.0% (29.0% by COVID-19 patients)
— 6.3% more availability than Texas overall
– Cases per 100k in last 7 days: 185 (1,642 cases)
– Population that is fully vaccinated: 60.7% (538,783 fully vaccinated)
— 1.3% higher vaccination rate than Texas

Larry D. Moore // Wikimedia Commons
#35. Henderson County, TX
– Inpatient beds occupied: 84.0% (27.0% by COVID-19 patients)
— 3.7% more full than Texas overall
– ICU beds occupied: 99.0% (64.0% by COVID-19 patients)
— 4.2% more full than Texas overall
– Cases per 100k in last 7 days: 106 (88 cases)
– Population that is fully vaccinated: 38.8% (32,087 fully vaccinated)
— -35.2% lower vaccination rate than Texas

Lpret // Wikicommons
#34. McLennan County, TX
– Inpatient beds occupied: 85.0% (13.0% by COVID-19 patients)
— 4.9% more full than Texas overall
– ICU beds occupied: 86.0% (27.0% by COVID-19 patients)
— 9.5% more availability than Texas overall
– Cases per 100k in last 7 days: 214 (549 cases)
– Population that is fully vaccinated: 50.8% (130,485 fully vaccinated)
— -15.2% lower vaccination rate than Texas
Larry D. Moore // Wikimedia Commons
#33. Hays County, TX
– Inpatient beds occupied: 85.0% (17.0% by COVID-19 patients)
— 4.9% more full than Texas overall
– ICU beds occupied: 96.0% (35.0% by COVID-19 patients)
— 1.1% more full than Texas overall
– Cases per 100k in last 7 days: 417 (960 cases)
– Population that is fully vaccinated: 61.3% (141,049 fully vaccinated)
— 2.3% higher vaccination rate than Texas
BenjaminMonroy // Wikimedia Commons
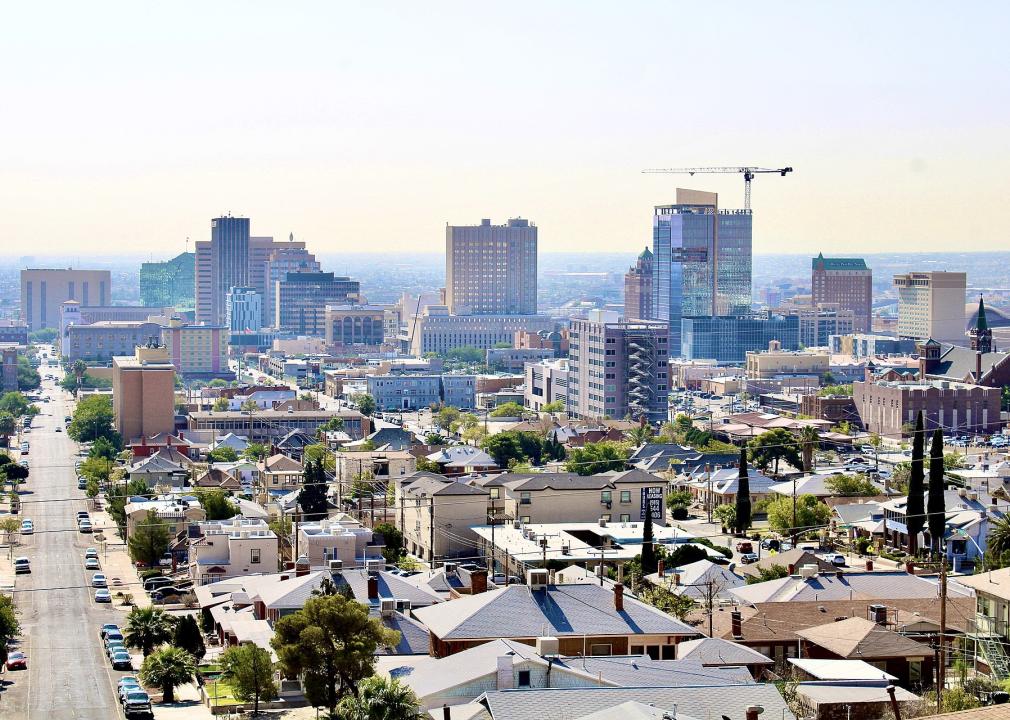
#32. El Paso County, TX
– Inpatient beds occupied: 85.0% (14.0% by COVID-19 patients)
— 4.9% more full than Texas overall
– ICU beds occupied: 97.0% (24.0% by COVID-19 patients)
— 2.1% more full than Texas overall
– Cases per 100k in last 7 days: 130 (1,094 cases)
– Population that is fully vaccinated: 79.0% (662,597 fully vaccinated)
— 31.9% higher vaccination rate than Texas
Canva
#31. Cameron County, TX
– Inpatient beds occupied: 86.0% (11.0% by COVID-19 patients)
— 6.2% more full than Texas overall
– ICU beds occupied: 91.0% (25.0% by COVID-19 patients)
— 4.2% more availability than Texas overall
– Cases per 100k in last 7 days: 313 (1,323 cases)
– Population that is fully vaccinated: 76.6% (324,082 fully vaccinated)
— 27.9% higher vaccination rate than Texas

Larry D. Moore // Wikimedia Commons
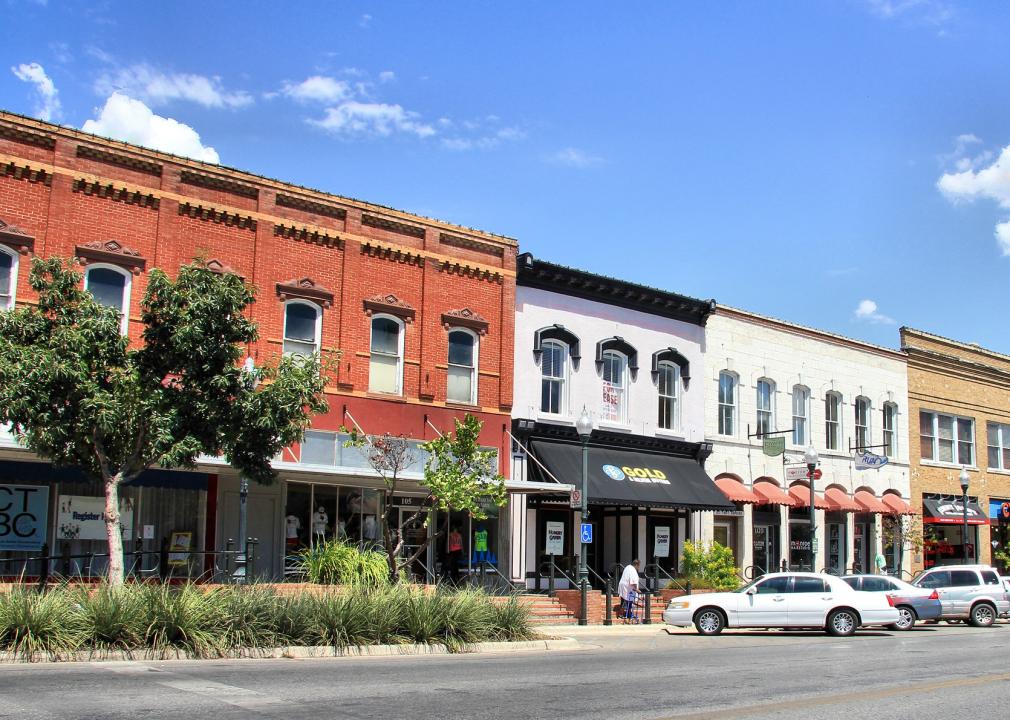
#30. Williamson County, TX
– Inpatient beds occupied: 86.0% (11.0% by COVID-19 patients)
— 6.2% more full than Texas overall
– ICU beds occupied: 94.0% (18.0% by COVID-19 patients)
— 1.1% more availability than Texas overall
– Cases per 100k in last 7 days: 150 (883 cases)
– Population that is fully vaccinated: 67.5% (398,654 fully vaccinated)
— 12.7% higher vaccination rate than Texas
Renelibrary // Wikimedia Commons
#29. Ellis County, TX
– Inpatient beds occupied: 88.0% (13.0% by COVID-19 patients)
— 8.6% more full than Texas overall
– ICU beds occupied: 71.0% (21.0% by COVID-19 patients)
— 25.3% more availability than Texas overall
– Cases per 100k in last 7 days: 115 (213 cases)
– Population that is fully vaccinated: 53.2% (98,398 fully vaccinated)
— -11.2% lower vaccination rate than Texas

Larry D. Moore // Wikimedia Commons
#28. Fort Bend County, TX
– Inpatient beds occupied: 88.0% (7.0% by COVID-19 patients)
— 8.6% more full than Texas overall
– ICU beds occupied: 86.0% (8.0% by COVID-19 patients)
— 9.5% more availability than Texas overall
– Cases per 100k in last 7 days: 355 (2,884 cases)
– Population that is fully vaccinated: 70.5% (572,227 fully vaccinated)
— 17.7% higher vaccination rate than Texas
Adavyd // Wikimedia Commons
#27. Brazoria County, TX
– Inpatient beds occupied: 88.0% (12.0% by COVID-19 patients)
— 8.6% more full than Texas overall
– ICU beds occupied: 93.0% (14.0% by COVID-19 patients)
— 2.1% more availability than Texas overall
– Cases per 100k in last 7 days: 144 (539 cases)
– Population that is fully vaccinated: 57.2% (213,921 fully vaccinated)
— -4.5% lower vaccination rate than Texas
Eaglegrafix // Wikimedia Commons
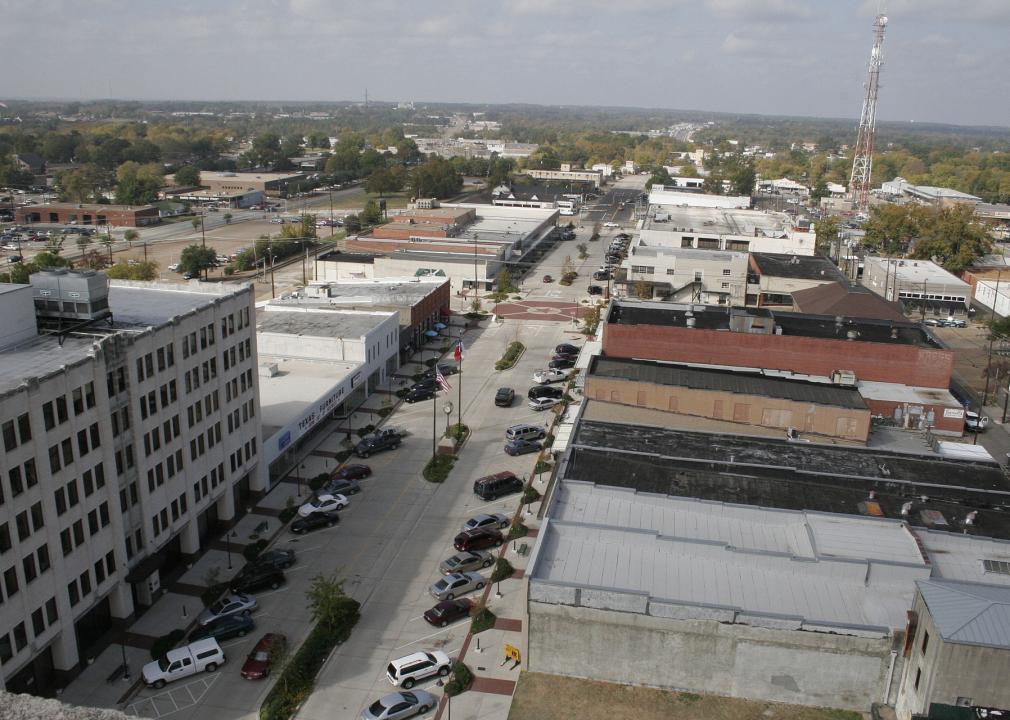
#26. Gregg County, TX
– Inpatient beds occupied: 88.0% (12.0% by COVID-19 patients)
— 8.6% more full than Texas overall
– ICU beds occupied: 95.0% (19.0% by COVID-19 patients)
— 0.0% more availability than Texas overall
– Cases per 100k in last 7 days: 72 (89 cases)
– Population that is fully vaccinated: 44.3% (54,953 fully vaccinated)
— -26.0% lower vaccination rate than Texas
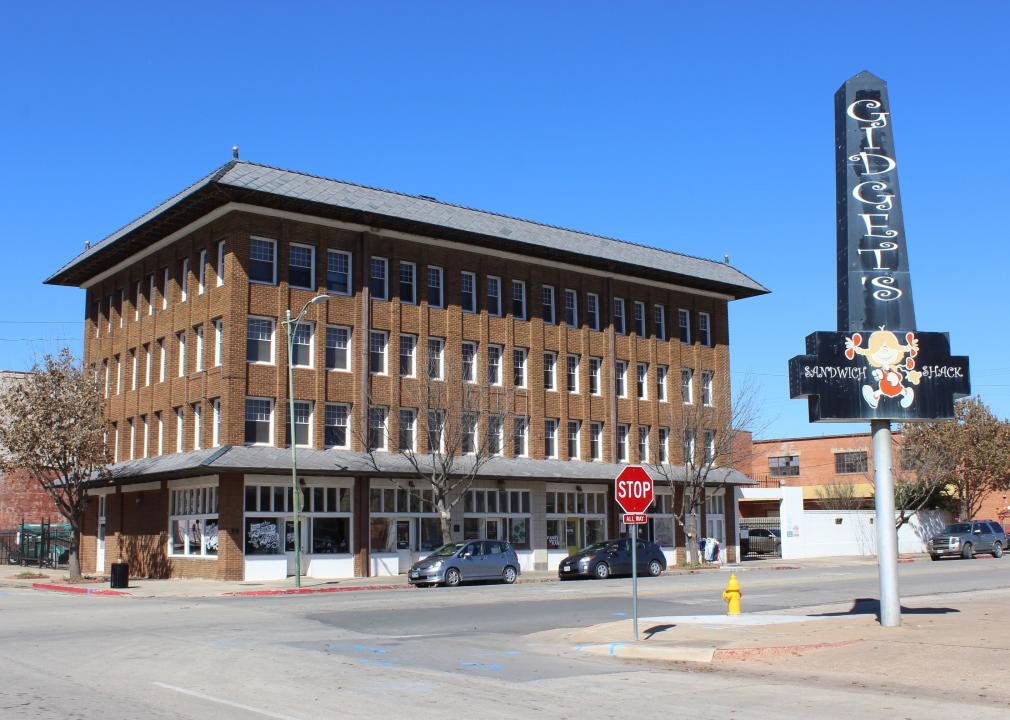
Charles Henry // Flickr
#25. Potter County, TX
– Inpatient beds occupied: 88.0% (14.0% by COVID-19 patients)
— 8.6% more full than Texas overall
– ICU beds occupied: 96.0% (42.0% by COVID-19 patients)
— 1.1% more full than Texas overall
– Cases per 100k in last 7 days: 113 (133 cases)
– Population that is fully vaccinated: 44.7% (52,436 fully vaccinated)
— -25.4% lower vaccination rate than Texas
Reading Associate 17 // Wikimedia Commons
#24. Caldwell County, TX
– Inpatient beds occupied: 88.0% (14.0% by COVID-19 patients)
— 8.6% more full than Texas overall
– ICU beds occupied: data not available
— 95% full in Texas overall
– Cases per 100k in last 7 days: 179 (78 cases)
– Population that is fully vaccinated: 55.8% (24,360 fully vaccinated)
— -6.8% lower vaccination rate than Texas

Adavyd // Wikimedia Commons
#23. Lamar County, TX
– Inpatient beds occupied: 89.0% (6.0% by COVID-19 patients)
— 9.9% more full than Texas overall
– ICU beds occupied: 93.0% (6.0% by COVID-19 patients)
— 2.1% more availability than Texas overall
– Cases per 100k in last 7 days: 166 (83 cases)
– Population that is fully vaccinated: 39.3% (19,578 fully vaccinated)
— -34.4% lower vaccination rate than Texas
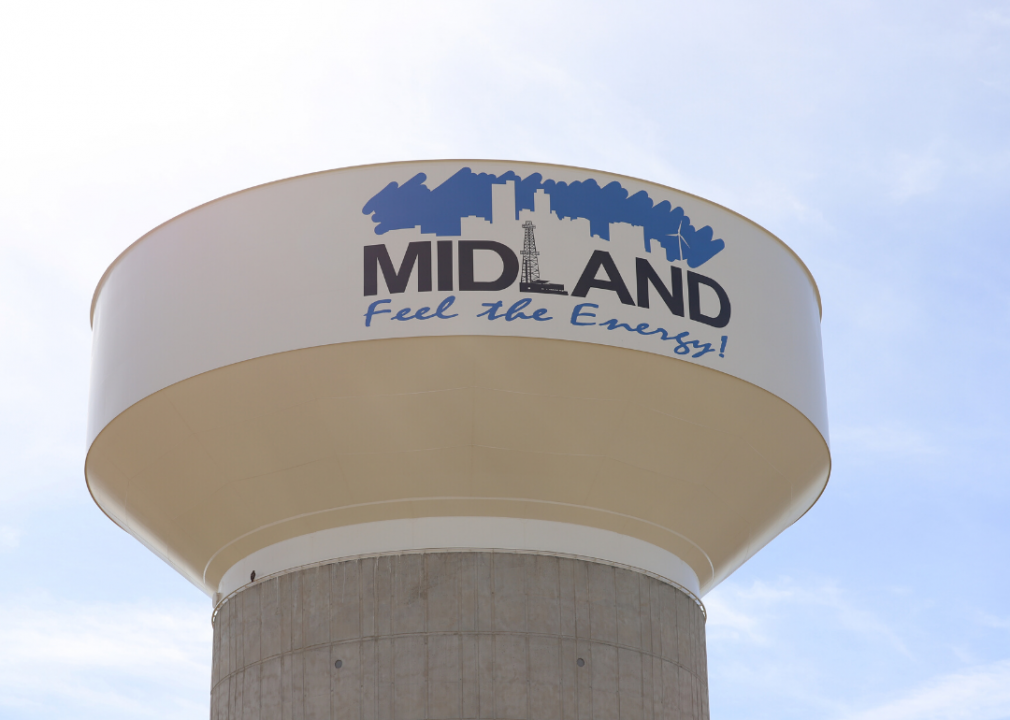
SG Arts // Shutterstock
#22. Midland County, TX
– Inpatient beds occupied: 89.0% (12.0% by COVID-19 patients)
— 9.9% more full than Texas overall
– ICU beds occupied: 99.0% (23.0% by COVID-19 patients)
— 4.2% more full than Texas overall
– Cases per 100k in last 7 days: 151 (267 cases)
– Population that is fully vaccinated: 42.5% (75,131 fully vaccinated)
— -29.0% lower vaccination rate than Texas
Larry D. Moore // Wikimedia Commons
#21. Montgomery County, TX
– Inpatient beds occupied: 90.0% (10.0% by COVID-19 patients)
— 11.1% more full than Texas overall
– ICU beds occupied: 90.0% (18.0% by COVID-19 patients)
— 5.3% more availability than Texas overall
– Cases per 100k in last 7 days: 188 (1,144 cases)
– Population that is fully vaccinated: 53.7% (326,109 fully vaccinated)
— -10.4% lower vaccination rate than Texas

Hequals2henry // Wikimedia Commons
#20. Harris County, TX
– Inpatient beds occupied: 90.0% (9.0% by COVID-19 patients)
— 11.1% more full than Texas overall
– ICU beds occupied: 94.0% (15.0% by COVID-19 patients)
— 1.1% more availability than Texas overall
– Cases per 100k in last 7 days: 175 (8,265 cases)
– Population that is fully vaccinated: 62.5% (2,945,706 fully vaccinated)
— 4.3% higher vaccination rate than Texas

Larry D. Moore // Wikimedia Commons
#19. Johnson County, TX
– Inpatient beds occupied: 91.0% (16.0% by COVID-19 patients)
— 12.3% more full than Texas overall
– ICU beds occupied: 91.0% (20.0% by COVID-19 patients)
— 4.2% more availability than Texas overall
– Cases per 100k in last 7 days: 117 (205 cases)
– Population that is fully vaccinated: 45.4% (79,798 fully vaccinated)
— -24.2% lower vaccination rate than Texas
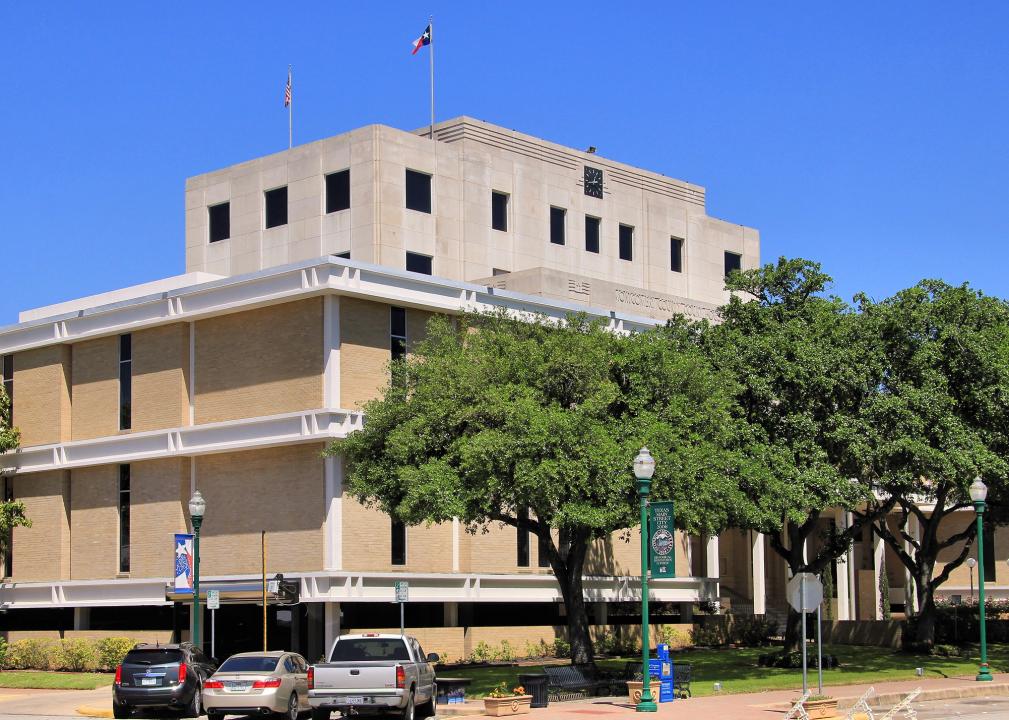
Mark Fisher // Wikimedia Commons
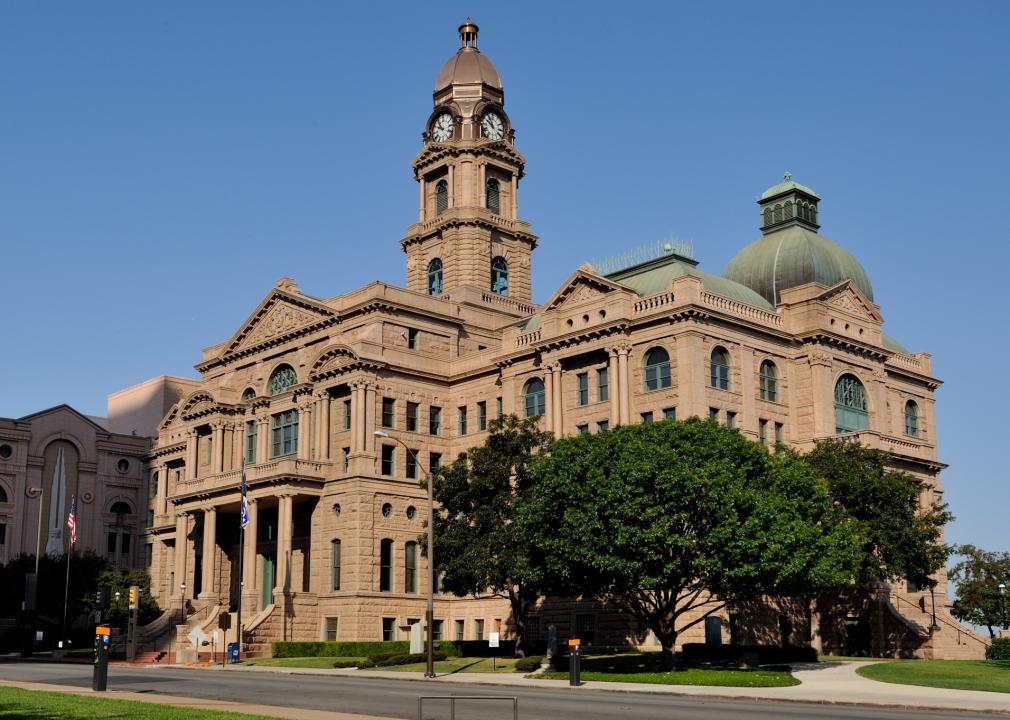
#18. Tarrant County, TX
– Inpatient beds occupied: 91.0% (10.0% by COVID-19 patients)
— 12.3% more full than Texas overall
– ICU beds occupied: 93.0% (23.0% by COVID-19 patients)
— 2.1% more availability than Texas overall
– Cases per 100k in last 7 days: 185 (3,888 cases)
– Population that is fully vaccinated: 55.6% (1,169,319 fully vaccinated)
— -7.2% lower vaccination rate than Texas

天王星 // Wikimedia Commons
#17. Travis County, TX
– Inpatient beds occupied: 91.0% (8.0% by COVID-19 patients)
— 12.3% more full than Texas overall
– ICU beds occupied: 94.0% (21.0% by COVID-19 patients)
— 1.1% more availability than Texas overall
– Cases per 100k in last 7 days: 83 (1,052 cases)
– Population that is fully vaccinated: 68.8% (876,460 fully vaccinated)
— 14.9% higher vaccination rate than Texas
Larry D. Moore // Wikimedia Commons
#16. Taylor County, TX
– Inpatient beds occupied: 92.0% (8.0% by COVID-19 patients)
— 13.6% more full than Texas overall
– ICU beds occupied: 90.0% (21.0% by COVID-19 patients)
— 5.3% more availability than Texas overall
– Cases per 100k in last 7 days: 108 (149 cases)
– Population that is fully vaccinated: 49.6% (68,441 fully vaccinated)
— -17.2% lower vaccination rate than Texas
Alan Botting // Wikimedia Commons
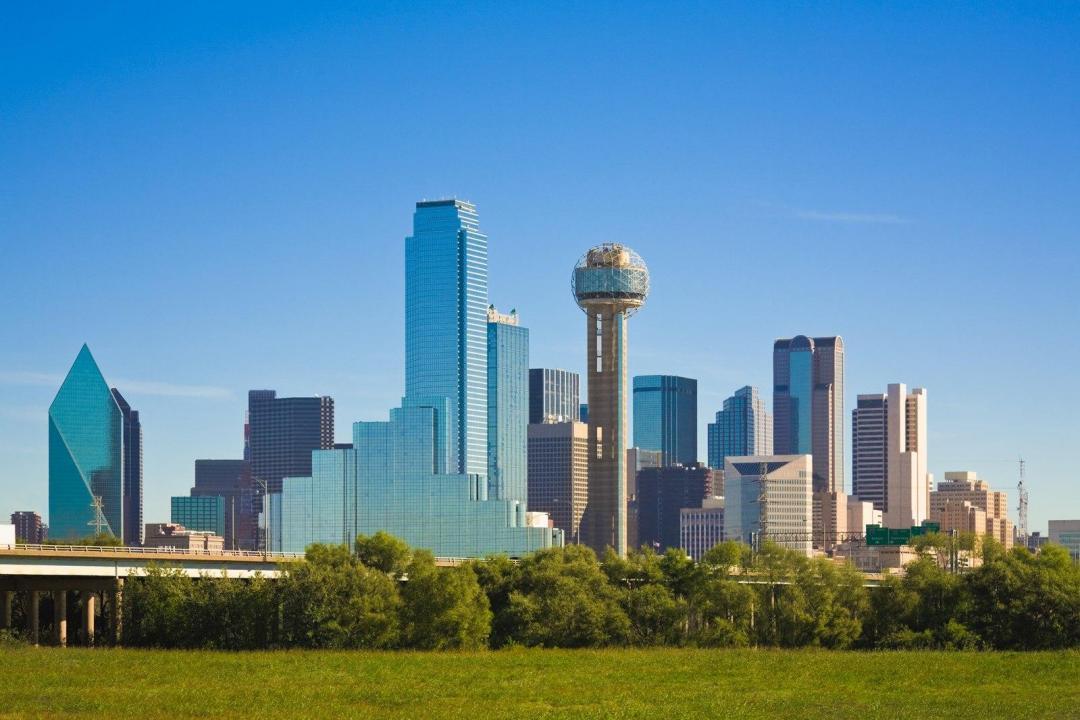
#15. Dallas County, TX
– Inpatient beds occupied: 92.0% (9.0% by COVID-19 patients)
— 13.6% more full than Texas overall
– ICU beds occupied: 93.0% (19.0% by COVID-19 patients)
— 2.1% more availability than Texas overall
– Cases per 100k in last 7 days: 85 (2,235 cases)
– Population that is fully vaccinated: 59.5% (1,566,835 fully vaccinated)
— -0.7% lower vaccination rate than Texas
Larry D. Moore // Wikimedia Commons
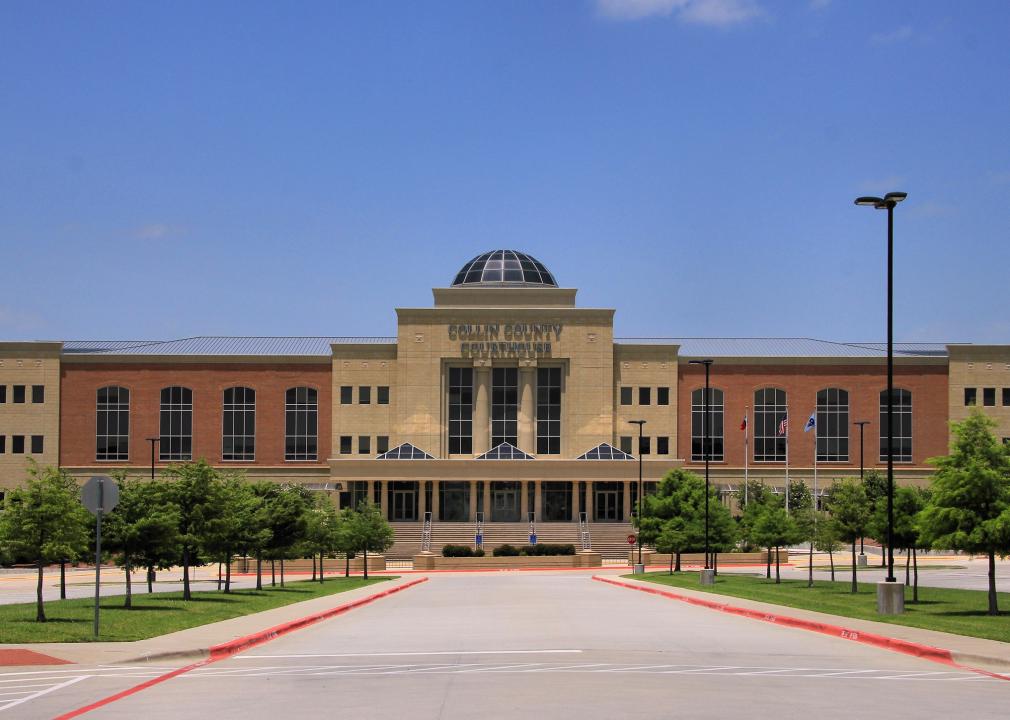
#14. Collin County, TX
– Inpatient beds occupied: 92.0% (8.0% by COVID-19 patients)
— 13.6% more full than Texas overall
– ICU beds occupied: 94.0% (15.0% by COVID-19 patients)
— 1.1% more availability than Texas overall
– Cases per 100k in last 7 days: 159 (1,642 cases)
– Population that is fully vaccinated: 66.3% (686,223 fully vaccinated)
— 10.7% higher vaccination rate than Texas
Aualliso // Wikimedia Commons
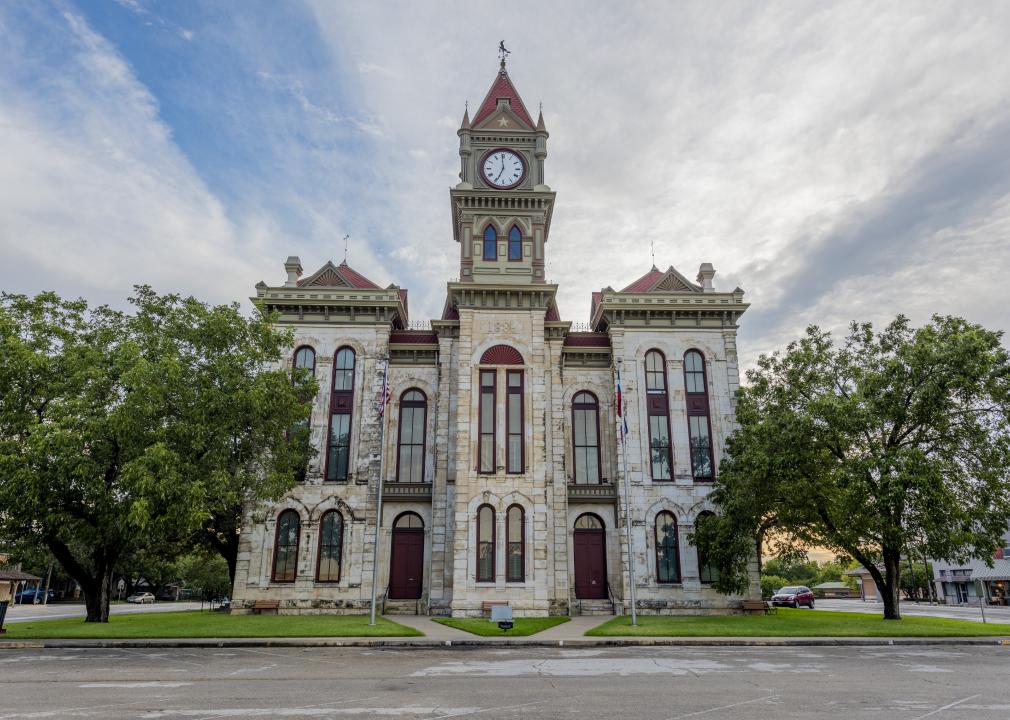
#13. Bell County, TX
– Inpatient beds occupied: 93.0% (10.0% by COVID-19 patients)
— 14.8% more full than Texas overall
– ICU beds occupied: 85.0% (23.0% by COVID-19 patients)
— 10.5% more availability than Texas overall
– Cases per 100k in last 7 days: 74 (270 cases)
– Population that is fully vaccinated: 59.0% (214,014 fully vaccinated)
— -1.5% lower vaccination rate than Texas

Larry D. Moore // Wikimedia Commons
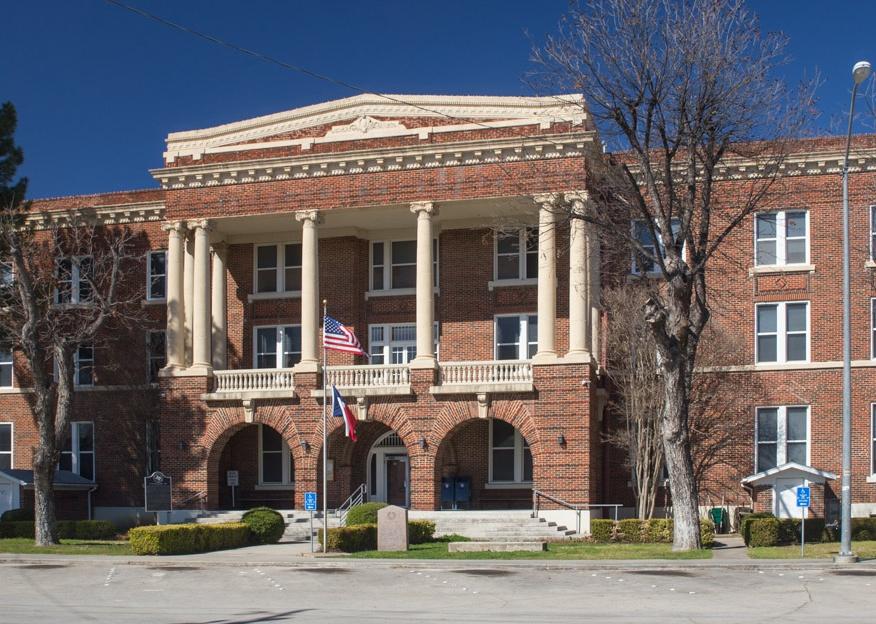
#12. Jim Wells County, TX
– Inpatient beds occupied: 93.0% (13.0% by COVID-19 patients)
— 14.8% more full than Texas overall
– ICU beds occupied: 94.0% (2.0% by COVID-19 patients)
— 1.1% more availability than Texas overall
– Cases per 100k in last 7 days: 225 (91 cases)
– Population that is fully vaccinated: 53.0% (21,458 fully vaccinated)
— -11.5% lower vaccination rate than Texas
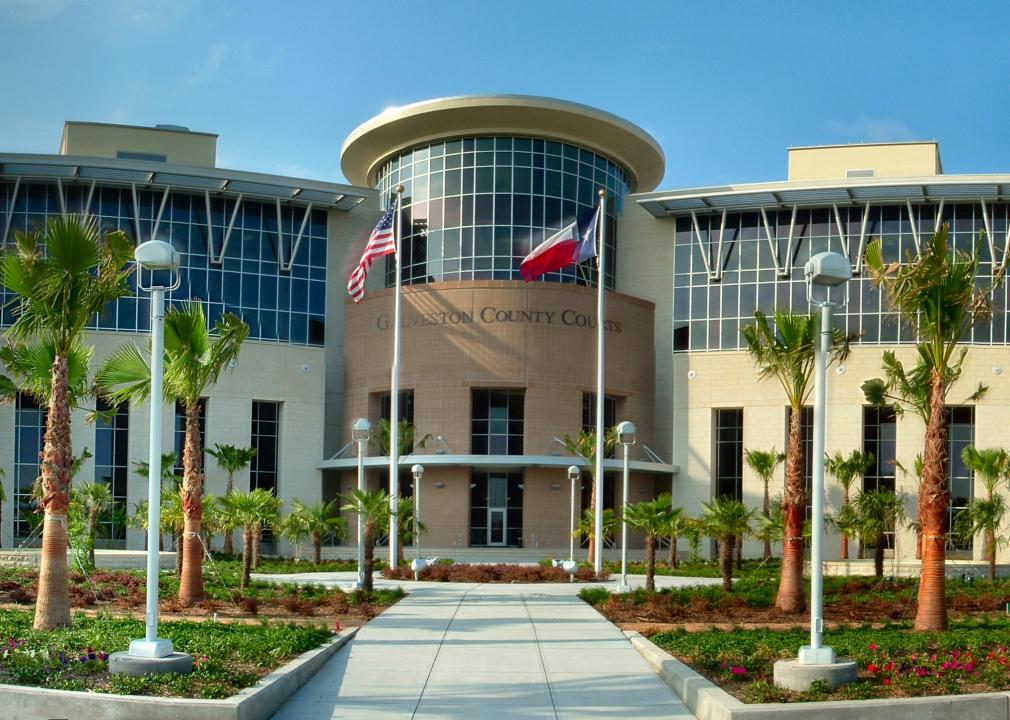
Nsaum75 // Wikimedia Commons
#11. Galveston County, TX
– Inpatient beds occupied: 93.0% (11.0% by COVID-19 patients)
— 14.8% more full than Texas overall
– ICU beds occupied: 95.0% (18.0% by COVID-19 patients)
— 0.0% more availability than Texas overall
– Cases per 100k in last 7 days: 160 (546 cases)
– Population that is fully vaccinated: 59.2% (202,675 fully vaccinated)
— -1.2% lower vaccination rate than Texas
Travis K. Witt // Wikimedia Commons
#10. Wichita County, TX
– Inpatient beds occupied: 93.0% (20.0% by COVID-19 patients)
— 14.8% more full than Texas overall
– ICU beds occupied: 97.0% (43.0% by COVID-19 patients)
— 2.1% more full than Texas overall
– Cases per 100k in last 7 days: 54 (71 cases)
– Population that is fully vaccinated: 52.0% (68,762 fully vaccinated)
— -13.2% lower vaccination rate than Texas
Larry D. Moore // Wikimedia Commons
#9. Walker County, TX
– Inpatient beds occupied: 94.0% (22.0% by COVID-19 patients)
— 16.0% more full than Texas overall
– ICU beds occupied: 87.0% (37.0% by COVID-19 patients)
— 8.4% more availability than Texas overall
– Cases per 100k in last 7 days: 274 (200 cases)
– Population that is fully vaccinated: 47.5% (34,641 fully vaccinated)
— -20.7% lower vaccination rate than Texas
Larry D. Moore // Wikimedia Commons
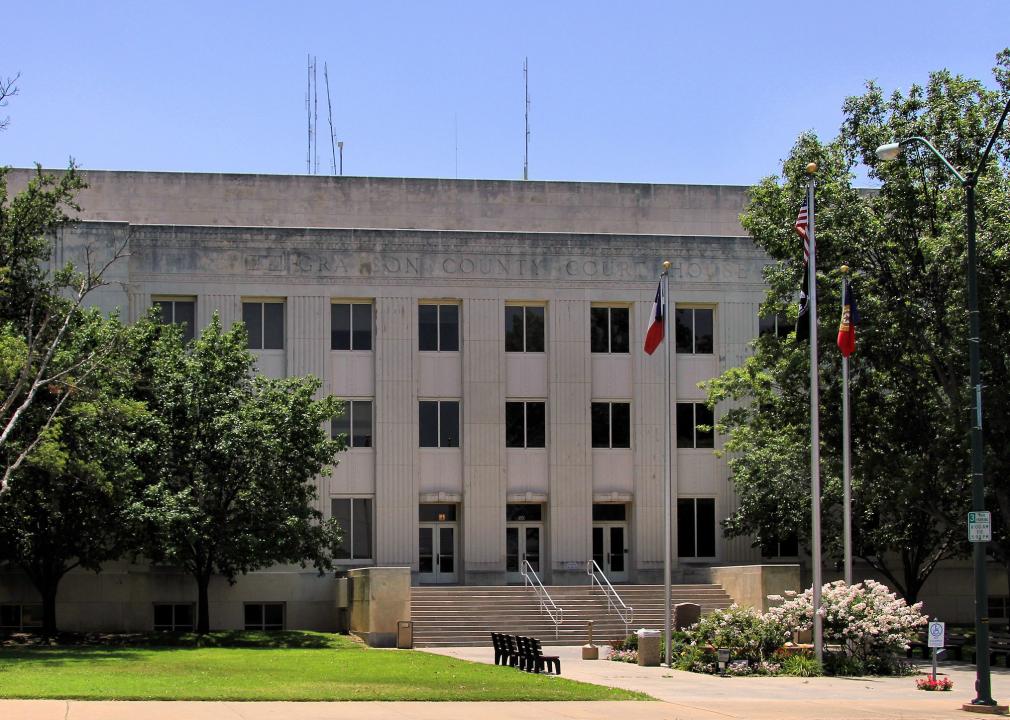
#8. Grayson County, TX
– Inpatient beds occupied: 94.0% (11.0% by COVID-19 patients)
— 16.0% more full than Texas overall
– ICU beds occupied: 100.0% (33.0% by COVID-19 patients)
— 5.3% more full than Texas overall
– Cases per 100k in last 7 days: 48 (65 cases)
– Population that is fully vaccinated: 44.4% (60,428 fully vaccinated)
— -25.9% lower vaccination rate than Texas

Jim Evans // Wikimedia Commons
#7. Polk County, TX
– Inpatient beds occupied: 97.0% (16.0% by COVID-19 patients)
— 19.8% more full than Texas overall
– ICU beds occupied: 95.0% (17.0% by COVID-19 patients)
— 0.0% more availability than Texas overall
– Cases per 100k in last 7 days: 92 (47 cases)
– Population that is fully vaccinated: 46.7% (23,995 fully vaccinated)
— -22.0% lower vaccination rate than Texas
Billy Hathorn // Wikimedia Commons
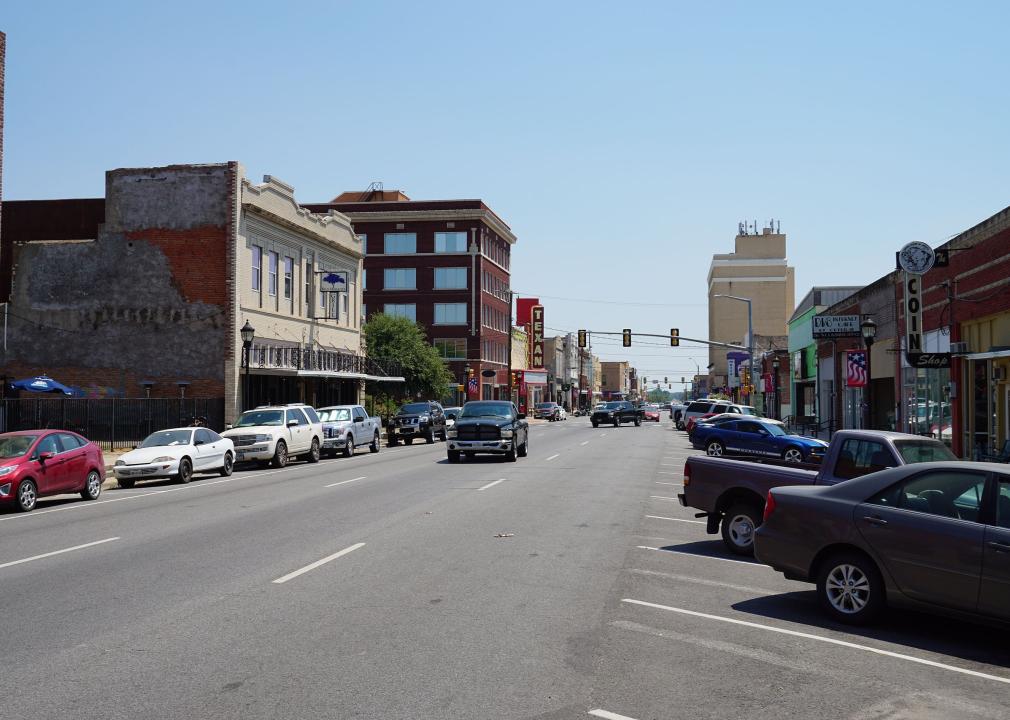
#6. Webb County, TX
– Inpatient beds occupied: 97.0% (14.0% by COVID-19 patients)
— 19.8% more full than Texas overall
– ICU beds occupied: 98.0% (30.0% by COVID-19 patients)
— 3.2% more full than Texas overall
– Cases per 100k in last 7 days: 390 (1,078 cases)
– Population that is fully vaccinated: 88.1% (243,630 fully vaccinated)
— 47.1% higher vaccination rate than Texas
Renelibrary // Wikimedia Commons
#5. Brown County, TX
– Inpatient beds occupied: 98.0% (11.0% by COVID-19 patients)
— 21.0% more full than Texas overall
– ICU beds occupied: 100.0% (33.0% by COVID-19 patients)
— 5.3% more full than Texas overall
– Cases per 100k in last 7 days: 407 (154 cases)
– Population that is fully vaccinated: 41.1% (15,574 fully vaccinated)
— -31.4% lower vaccination rate than Texas
Michael Barera // Wikimedia Commons
#4. Hunt County, TX
– Inpatient beds occupied: 98.0% (14.0% by COVID-19 patients)
— 21.0% more full than Texas overall
– ICU beds occupied: 100.0% (32.0% by COVID-19 patients)
— 5.3% more full than Texas overall
– Cases per 100k in last 7 days: 64 (63 cases)
– Population that is fully vaccinated: 42.3% (41,676 fully vaccinated)
— -29.4% lower vaccination rate than Texas
Michael Barera // Wikimedia Commons
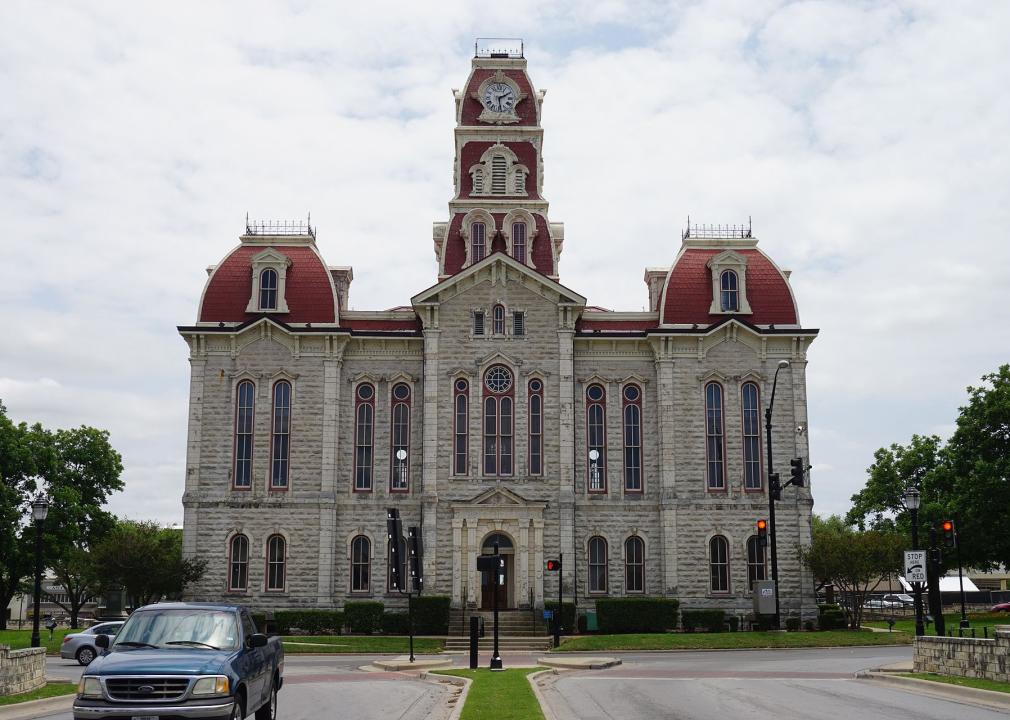
#3. Parker County, TX
– Inpatient beds occupied: 99.0% (20.0% by COVID-19 patients)
— 22.2% more full than Texas overall
– ICU beds occupied: 99.0% (23.0% by COVID-19 patients)
— 4.2% more full than Texas overall
– Cases per 100k in last 7 days: 101 (144 cases)
– Population that is fully vaccinated: 53.4% (76,299 fully vaccinated)
— -10.9% lower vaccination rate than Texas
Carol M. Highsmith // Wikimedia Commons
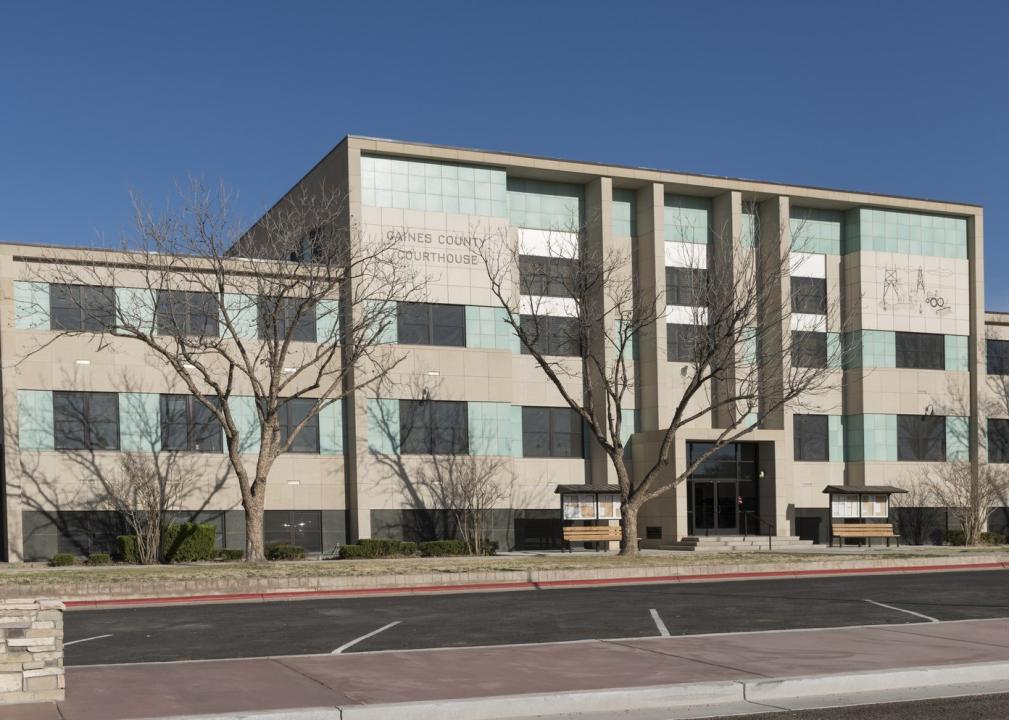
#2. Gaines County, TX
– Inpatient beds occupied: 100.0% (0.0% by COVID-19 patients)
— 23.5% more full than Texas overall
– ICU beds occupied: data not available
— 95% full in Texas overall
– Cases per 100k in last 7 days: 242 (52 cases)
– Population that is fully vaccinated: 21.6% (4,640 fully vaccinated)
— -63.9% lower vaccination rate than Texas
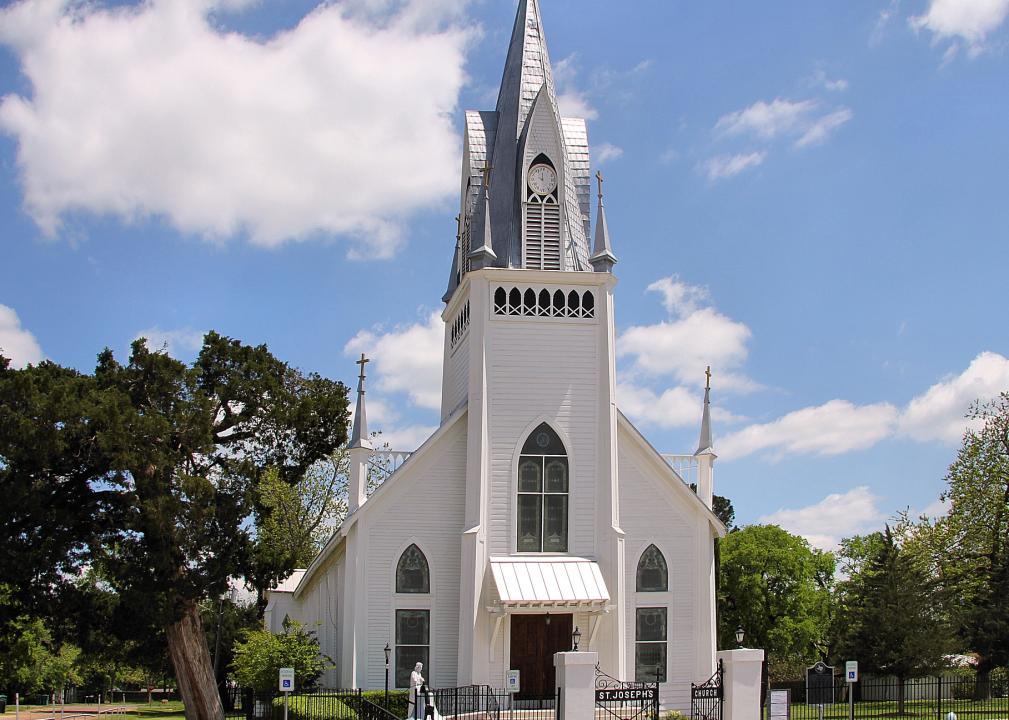
Larry D. Moore // Wikimedia Commons
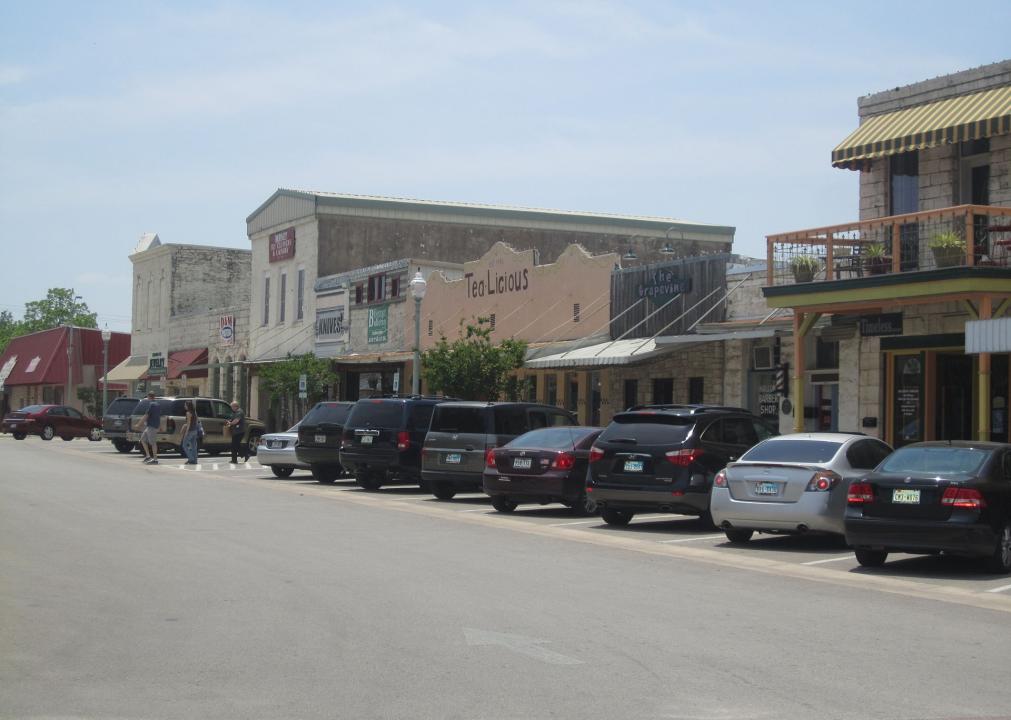
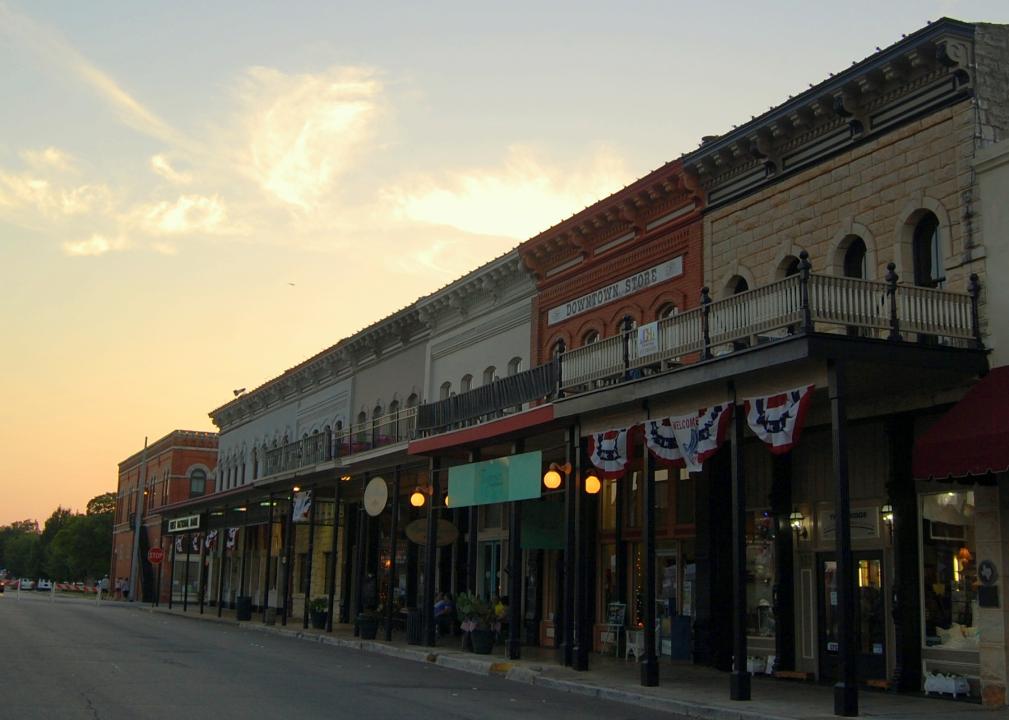
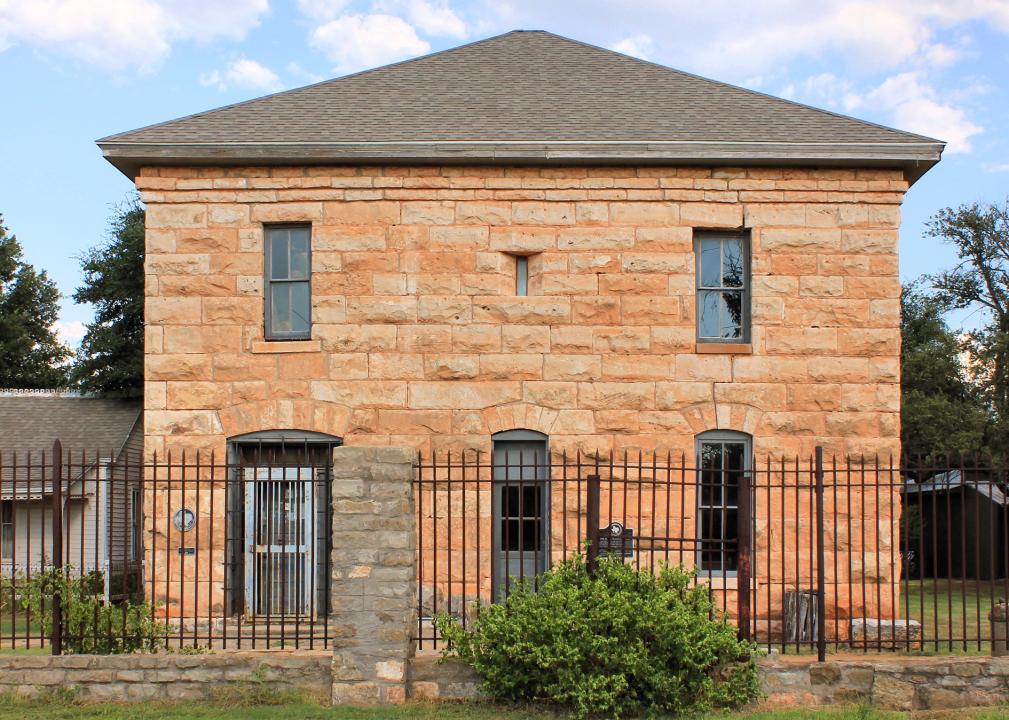
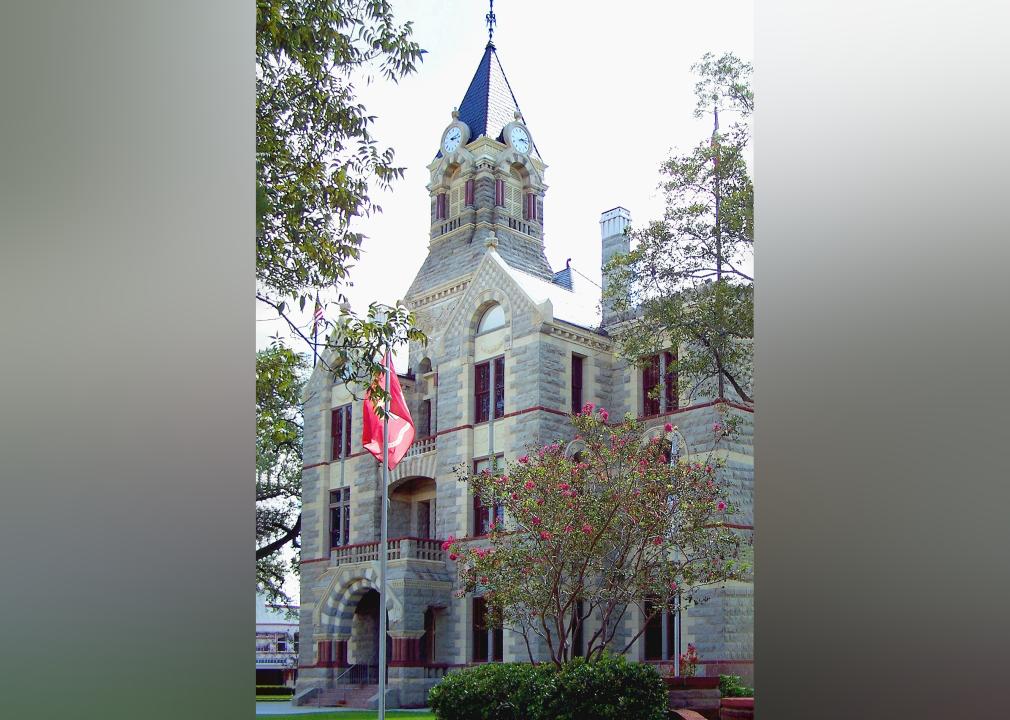
#1. Fayette County, TX
– Inpatient beds occupied: 100.0% (30.0% by COVID-19 patients)
— 23.5% more full than Texas overall
– ICU beds occupied: data not available
— 95% full in Texas overall
– Cases per 100k in last 7 days: 67 (17 cases)
– Population that is fully vaccinated: 49.5% (12,550 fully vaccinated)
— -17.4% lower vaccination rate than Texas
