How the rate of uninsured drivers has changed over time in every state
Canva
How the rate of uninsured drivers has changed over time in every state
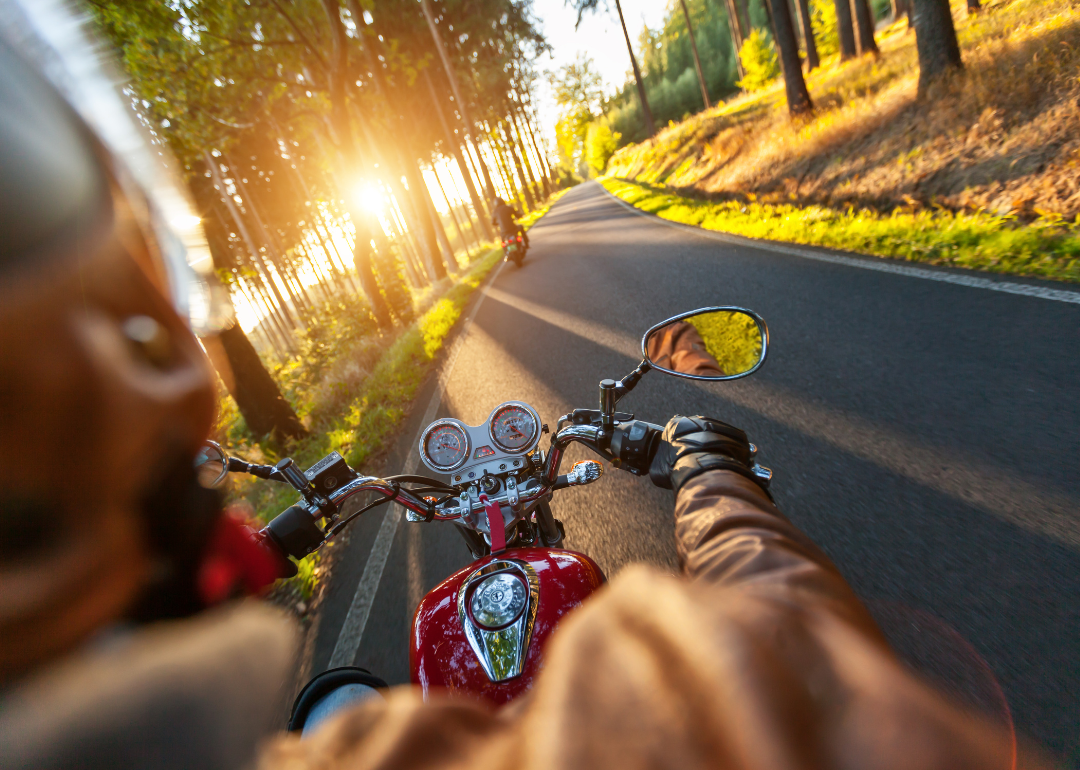
Two motorcycles ride on a tree-lined road.
Are you driving in a state where the number of uninsured drivers on roads is growing? A car wreck is never a happy event, but a collision involving a driver without auto insurance can make repairs and recovery significantly more difficult.
The General used Insurance Research Council data to visualize and describe how the rates of uninsured drivers changed in each state over time.
The 2019 data—the most recent available, released in 2021—is based on data from 11 insurers representing 60% of the private passenger auto insurance market. It represents the most thorough and up-to-date picture we have of uninsured drivers across the country.
Almost every state requires drivers to purchase an insurance policy and carry proof in their vehicles at all times. New Hampshire is the only state without a law specifically requiring auto insurance on the books but does require drivers to have enough money to cover the state’s minimum liability requirements in the event of a crash. Virginia drivers are generally required to have insurance but can pay a $500 annual fee to the state for permission not to have insurance—which makes them personally liable for any costs an insurance plan might cover.
Still, there will always be a proportion of drivers who elect to hit the road without the proper liability insurance. They typically do so to avoid the annual premium cost, which can increase based on a driver’s safety record. But driving without insurance is a gamble with the potential for financial disaster.
Insurance firms caution that for a driver, the annual premium can pale in comparison to the costs of being sued while uninsured for the full damages following an accident they caused. An insured driver will often need to pay for uninsured motorist insurance on top of their typical coverage, or else resort to recouping the damages in court, in case they are hit by an uninsured driver.
The good news is fewer drivers are making that gamble these days, according to the latest data. The Insurance Research Council estimated the countrywide uninsured motorist rate was 12.6% in 2019, down from an estimated 13.8% in 2009 and 14.3% in 2008.
Still, there are disparities among states and certain parts of the country have seen the rate of uninsured motorists tick up.
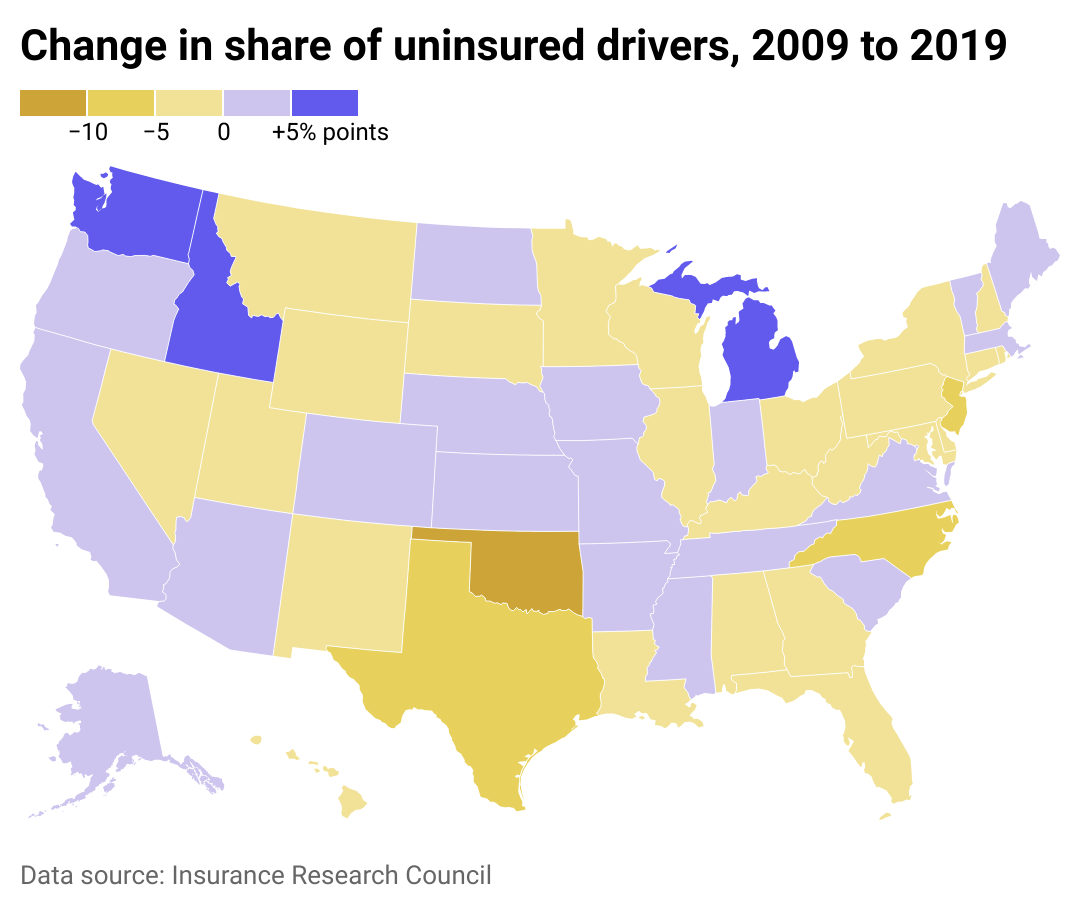
![]()
The General
Uninsured driver rates remained consistent across much of the US
A heat map of the U.S., showing the percentage point change by state in the share of drivers who were uninsured.
States in the Great Lakes and the Pacific Northwest regions have seen the largest growth in uninsured drivers on the road while Oklahoma, Texas, and South Carolina have seen their rates decrease. Mississippi, which boasts the highest rate of uninsured drivers in the country, saw its rate grow over the 10 years measured.
Oklahoma, which has been more successful in reducing the number of uninsured drivers on roads than any other state, began a program called the Uninsured Vehicle Enforcement Diversion Program in 2018. It’s run by the administrative agency that oversees the state’s local prosecutors.
Cameras positioned around the state photograph license plates and match them against a database of registered insurance policies, kicking a notice out to any driver without one. The driver is then able to avoid going to court for criminal charges if they agree to pay a $190 diversion fee and enroll in insurance for at least two years. The aim of the program was to divert uninsured motorist cases away from courts while helping drivers avoid a criminal conviction.
Sabrina Janelle Gordon // Shutterstock
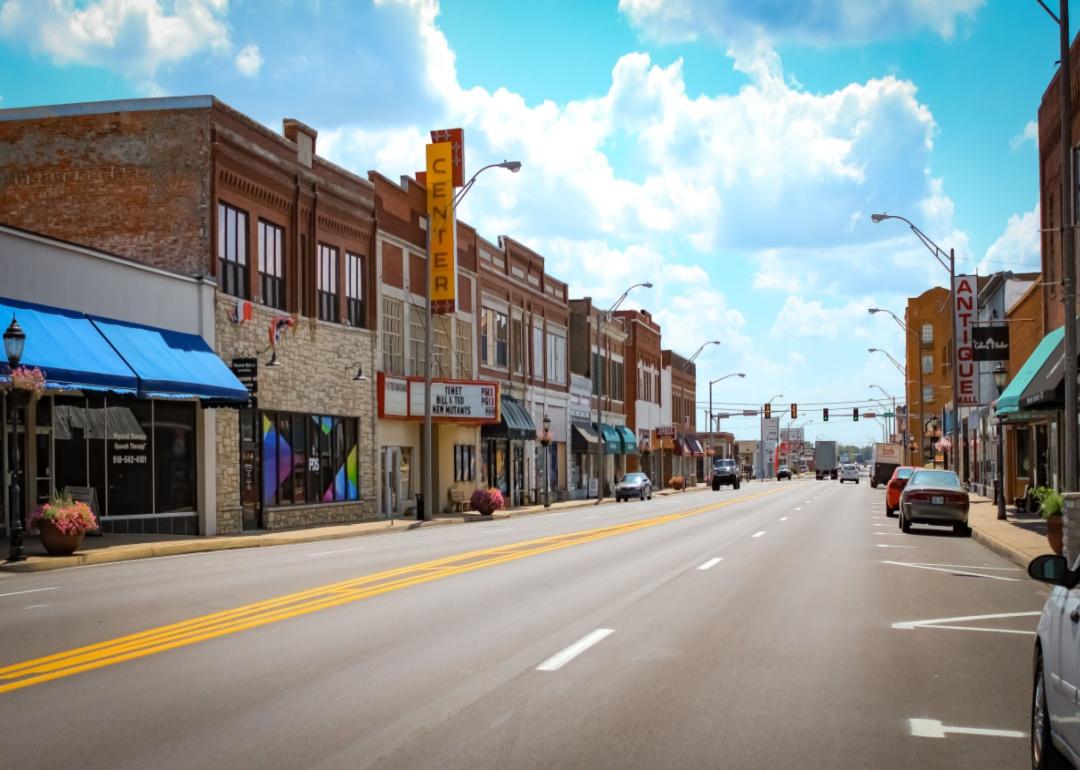
Oklahoma
A small town main street.
– Share of drivers who were uninsured, 2019: 13%
– Share of drivers who were uninsured, 2009: 24%
– Percentage point change: -11 percentage points
Canva
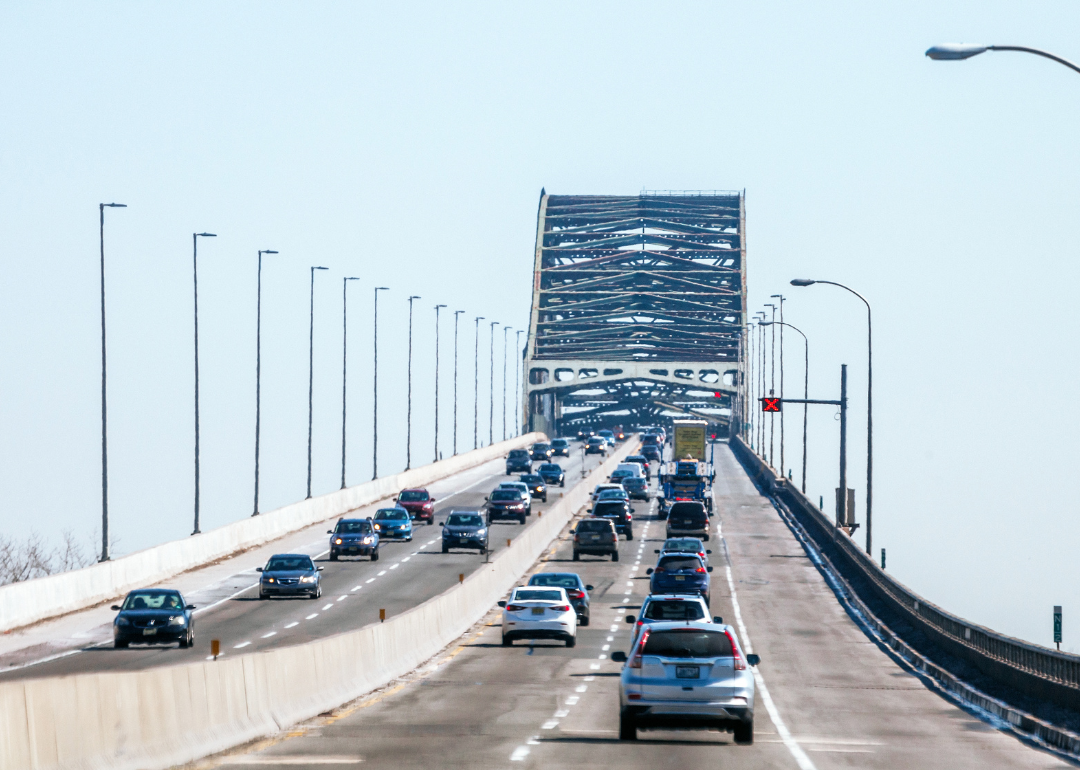
New Jersey
Cars driving across a tall bridge.
– Share of drivers who were uninsured, 2019: 3%
– Share of drivers who were uninsured, 2009: 11%
– Percentage point change: -8 percentage points
Canva
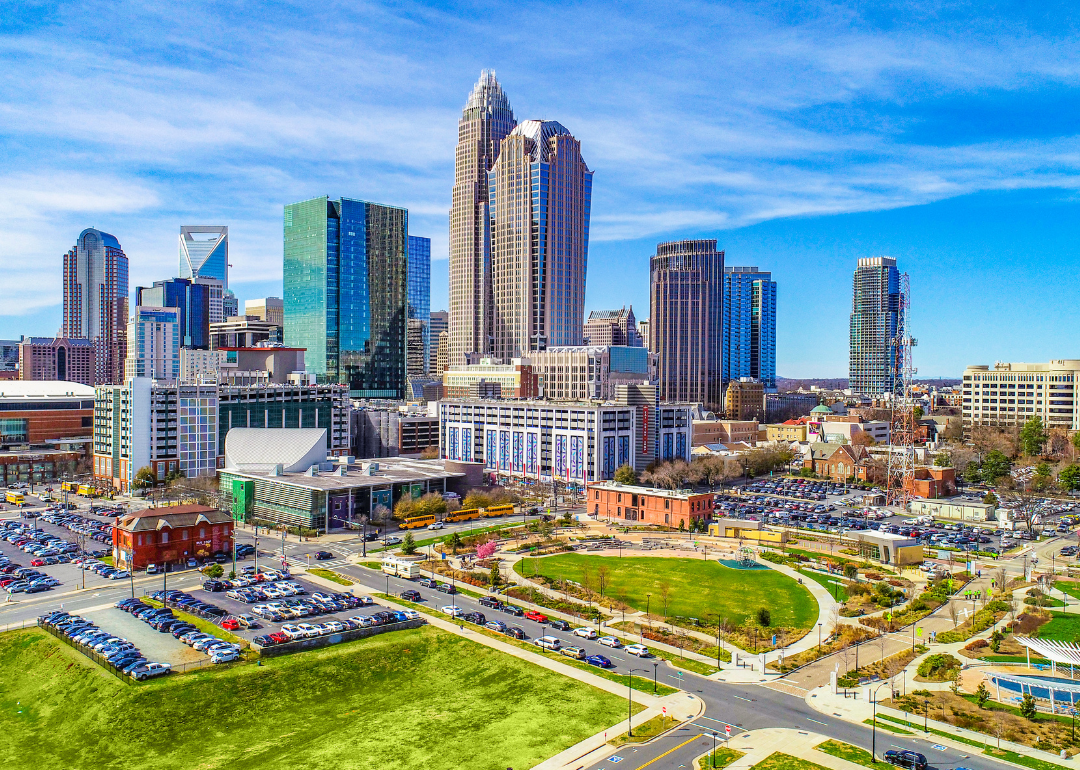
North Carolina
The downtown skyline in Charlotte.
– Share of drivers who were uninsured, 2019: 7%
– Share of drivers who were uninsured, 2009: 14%
– Percentage point change: -7 percentage points
Canva
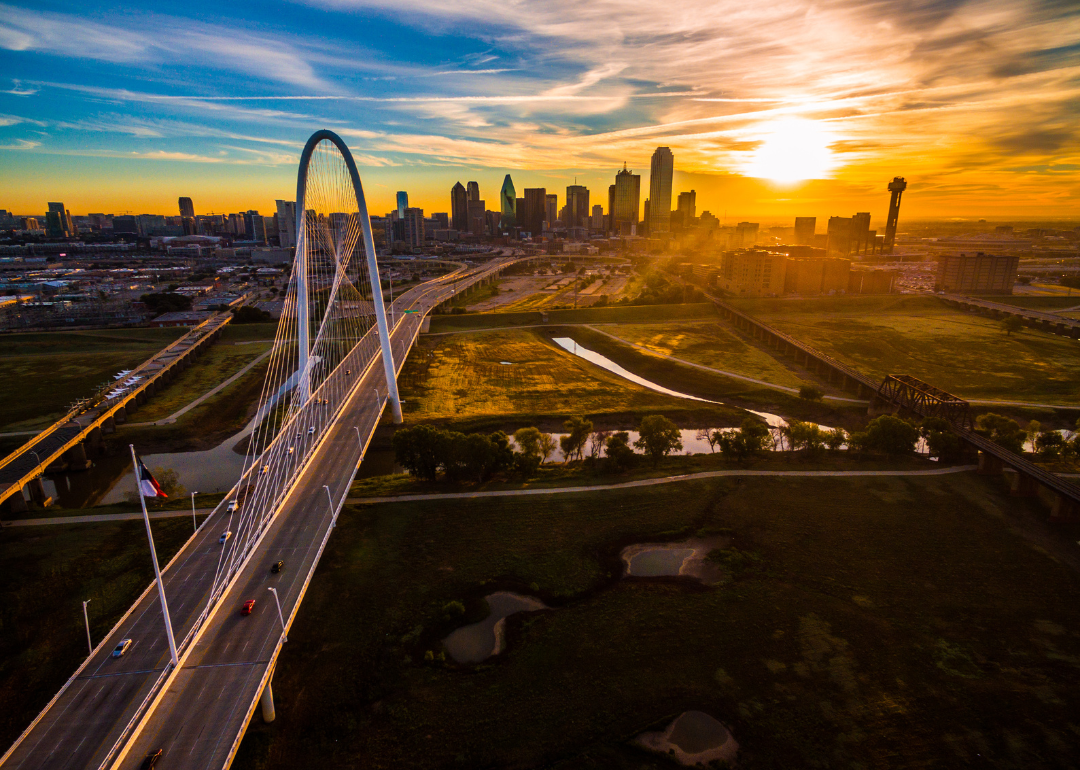
Texas
Cars on a large bridge with the Dallas skyline and sun setting in the background.
– Share of drivers who were uninsured, 2019: 8%
– Share of drivers who were uninsured, 2009: 15%
– Percentage point change: -7 percentage points
Canva
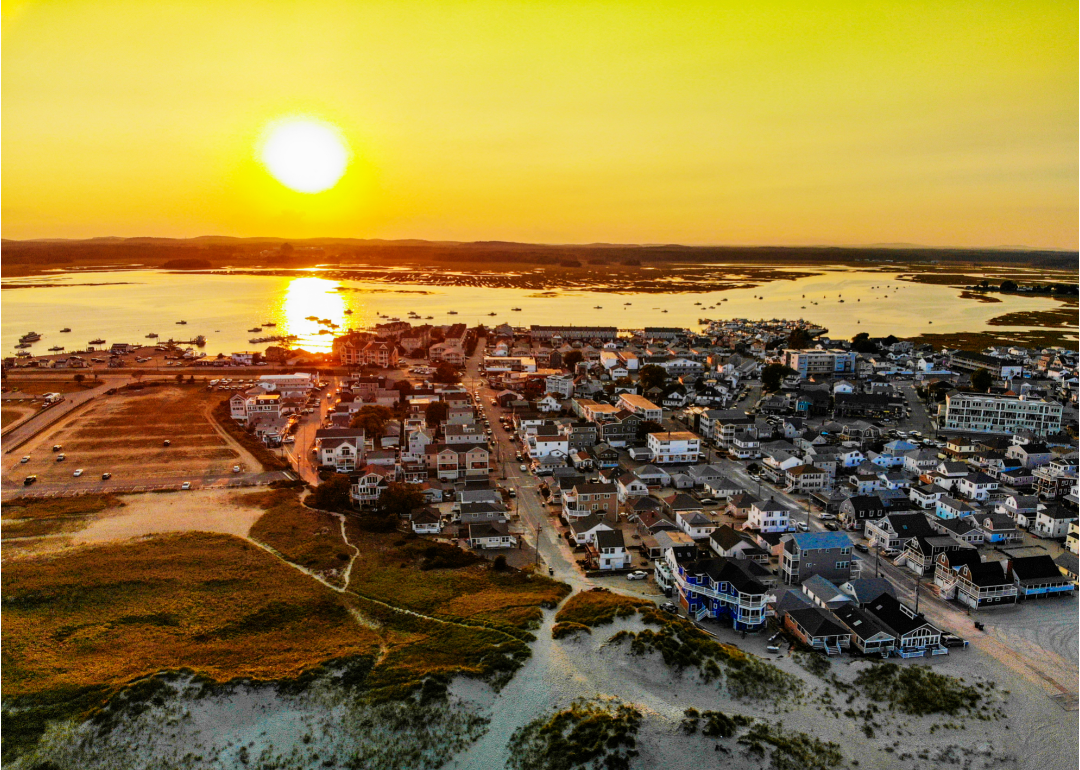
New Hampshire
An orange sunset over homes on the water.
– Share of drivers who were uninsured, 2019: 6%
– Share of drivers who were uninsured, 2009: 11%
– Percentage point change: -5 percentage points
Canva
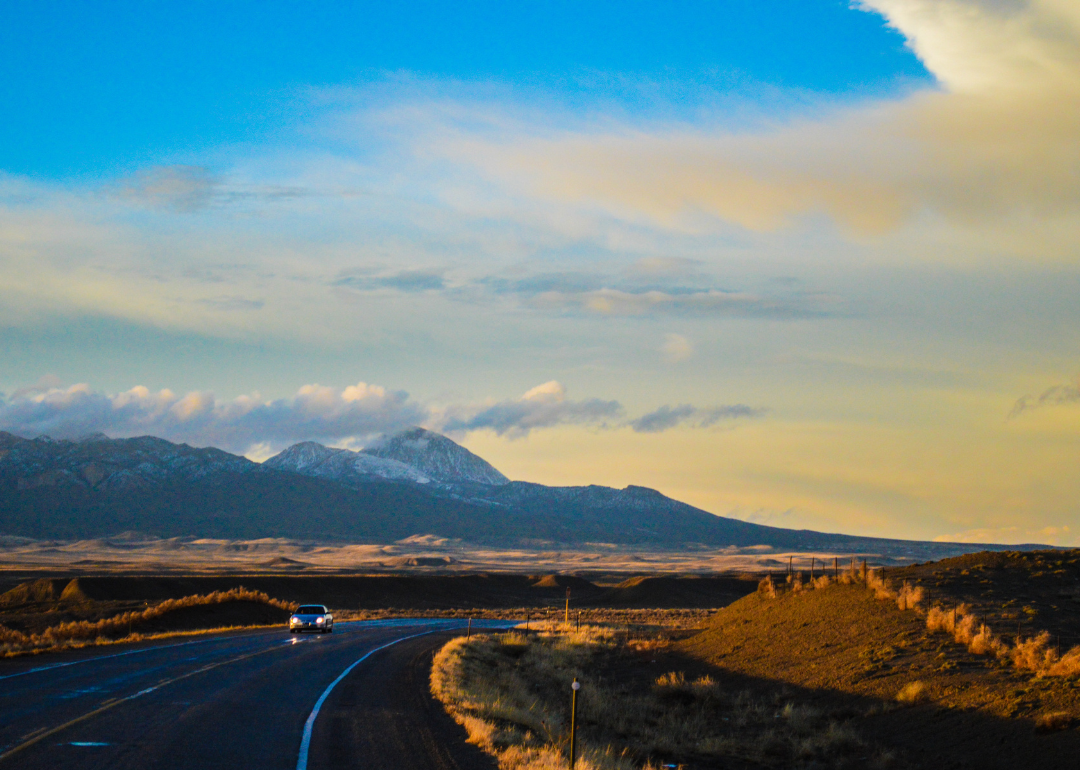
New Mexico
A car driving on a road with mountains in the background in the evening.
– Share of drivers who were uninsured, 2019: 22%
– Share of drivers who were uninsured, 2009: 26%
– Percentage point change: -4 percentage points
Canva
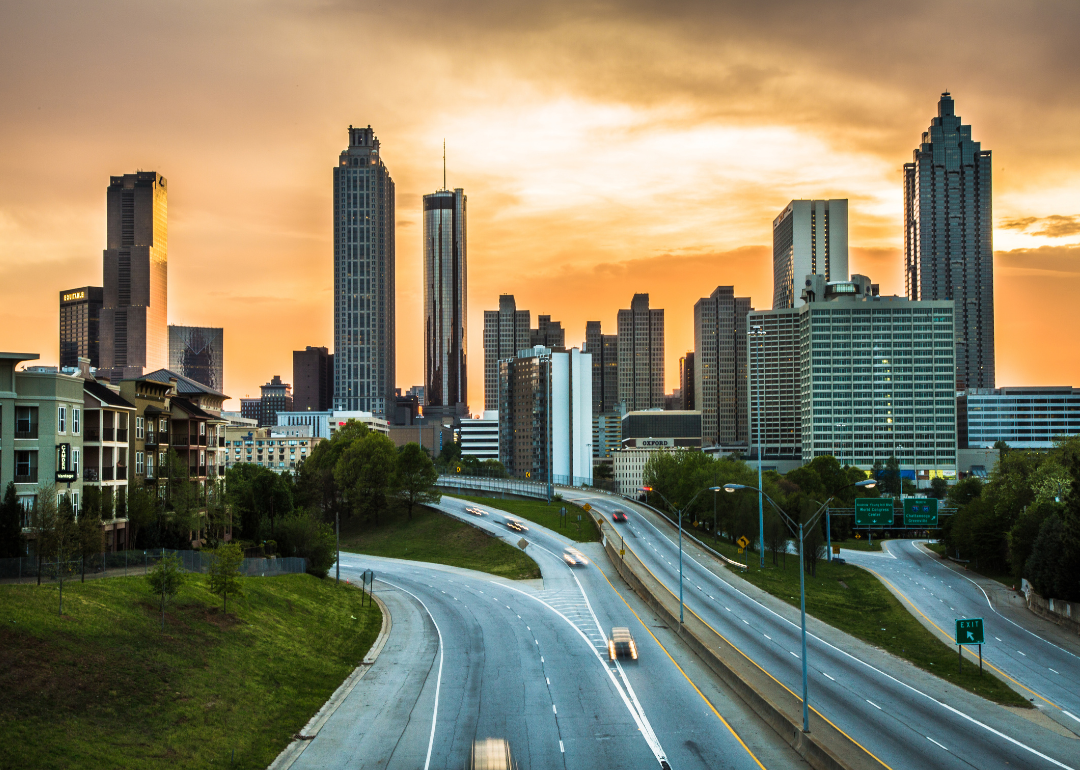
Georgia
Cars on the highway with the Atlanta skyline in the background.
– Share of drivers who were uninsured, 2019: 12%
– Share of drivers who were uninsured, 2009: 16%
– Percentage point change: -4 percentage points
Canva
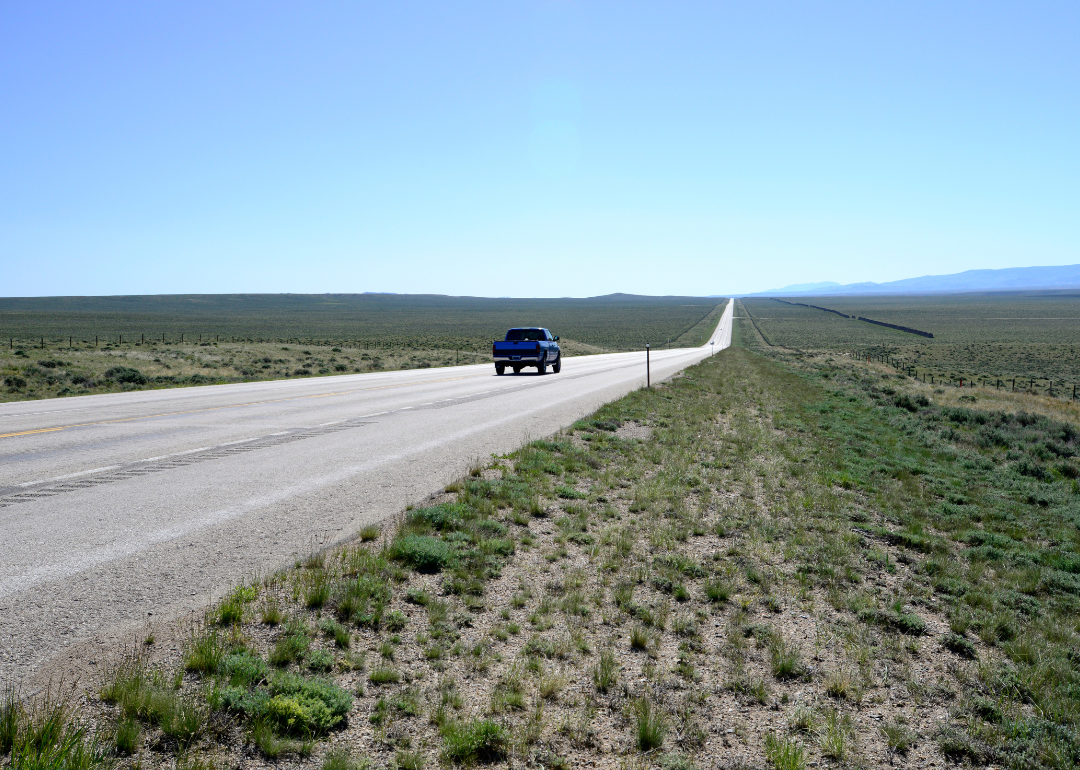
Wyoming
A truck on a country road with mountains in the distance.
– Share of drivers who were uninsured, 2019: 6%
– Share of drivers who were uninsured, 2009: 10%
– Percentage point change: -4 percentage points
Canva
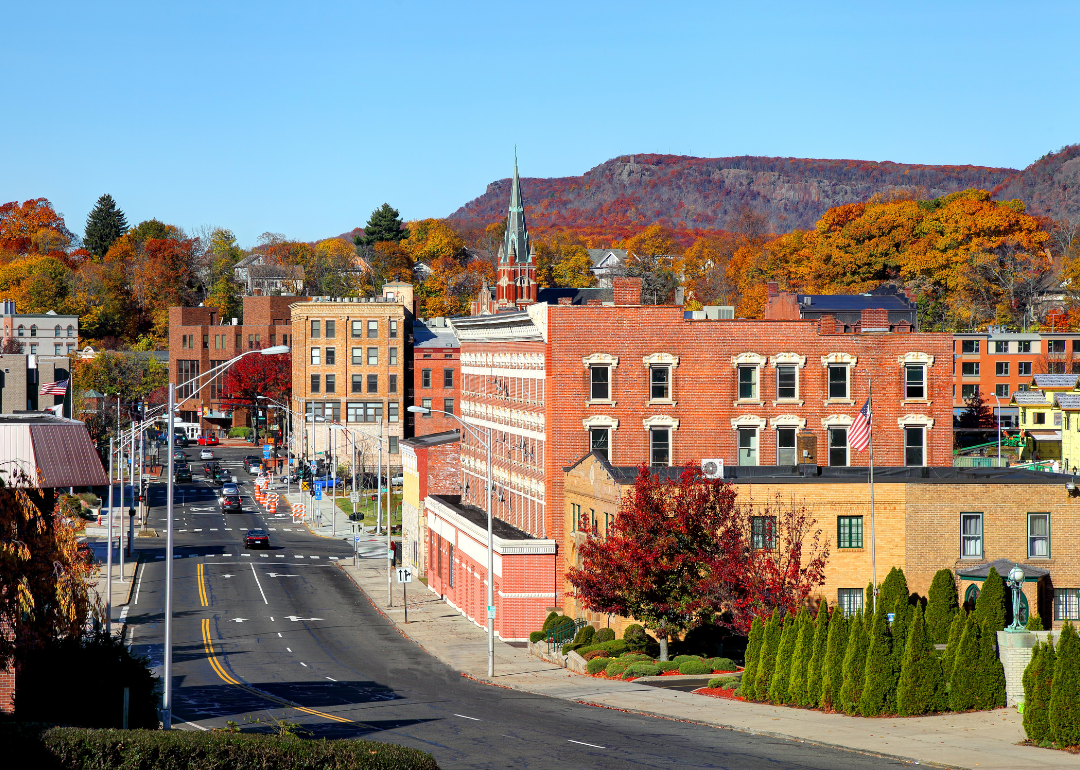
Connecticut
A small road lined with historic buildings and surrounded by fall foliage.
– Share of drivers who were uninsured, 2019: 6%
– Share of drivers who were uninsured, 2009: 10%
– Percentage point change: -4 percentage points
Canva
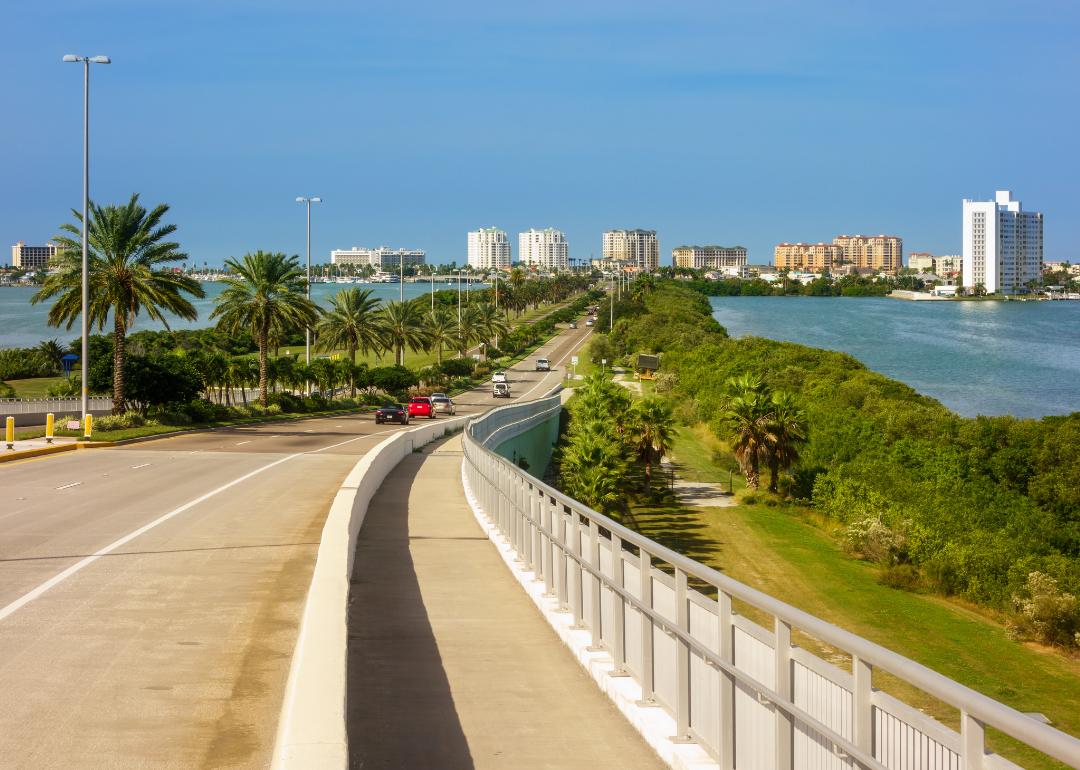
Florida
A highway lined with palm trees and water on both sides.
– Share of drivers who were uninsured, 2019: 20%
– Share of drivers who were uninsured, 2009: 24%
– Percentage point change: -4 percentage points
Canva
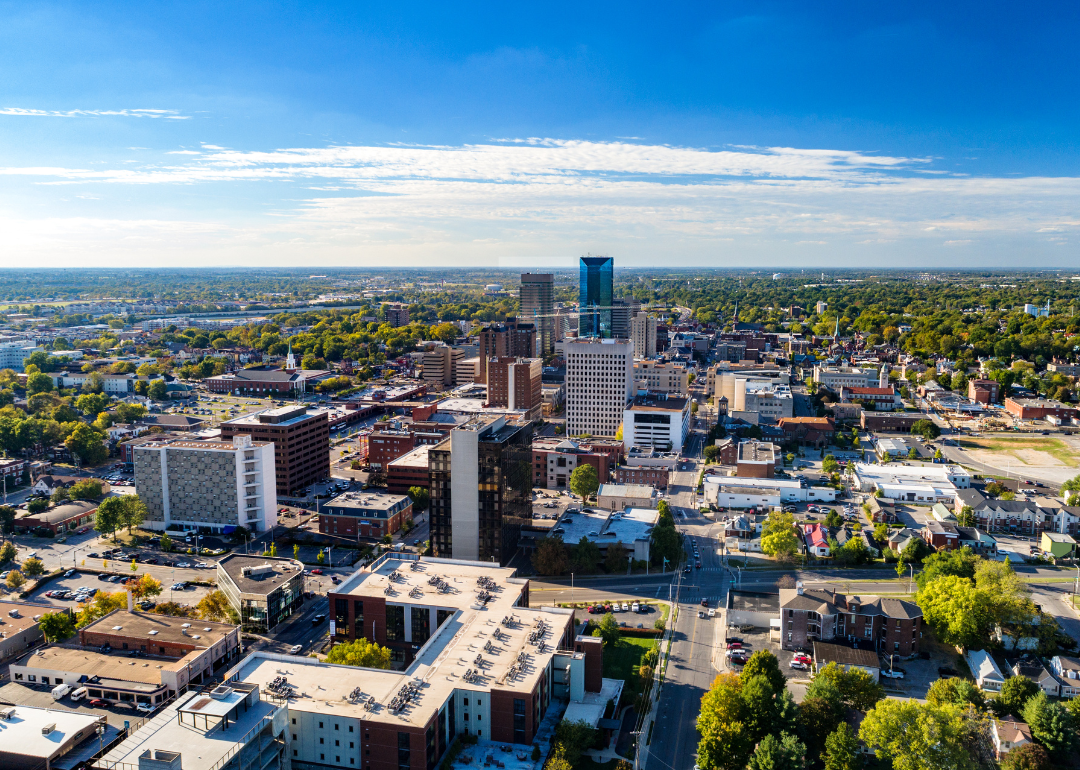
Kentucky
An aerial view of downtown Lexington.
– Share of drivers who were uninsured, 2019: 14%
– Share of drivers who were uninsured, 2009: 18%
– Percentage point change: -4 percentage points
Canva
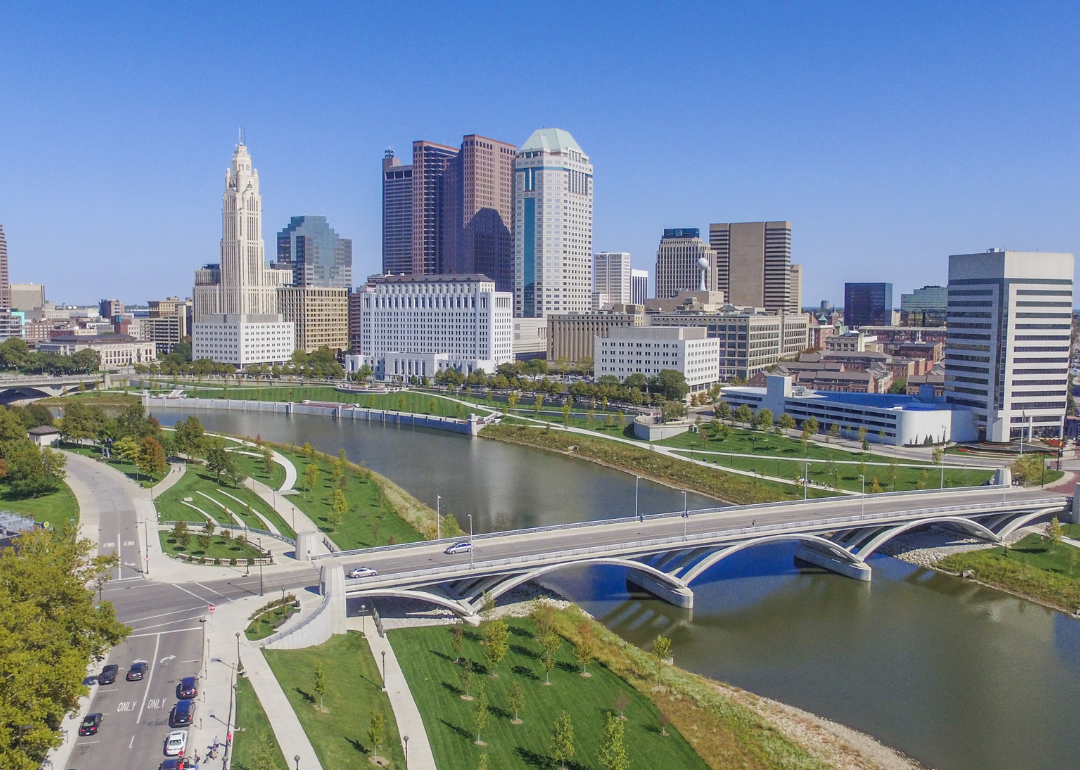
Ohio
An aerial view of downtown Columbus.
– Share of drivers who were uninsured, 2019: 13%
– Share of drivers who were uninsured, 2009: 16%
– Percentage point change: -3 percentage points
Canva
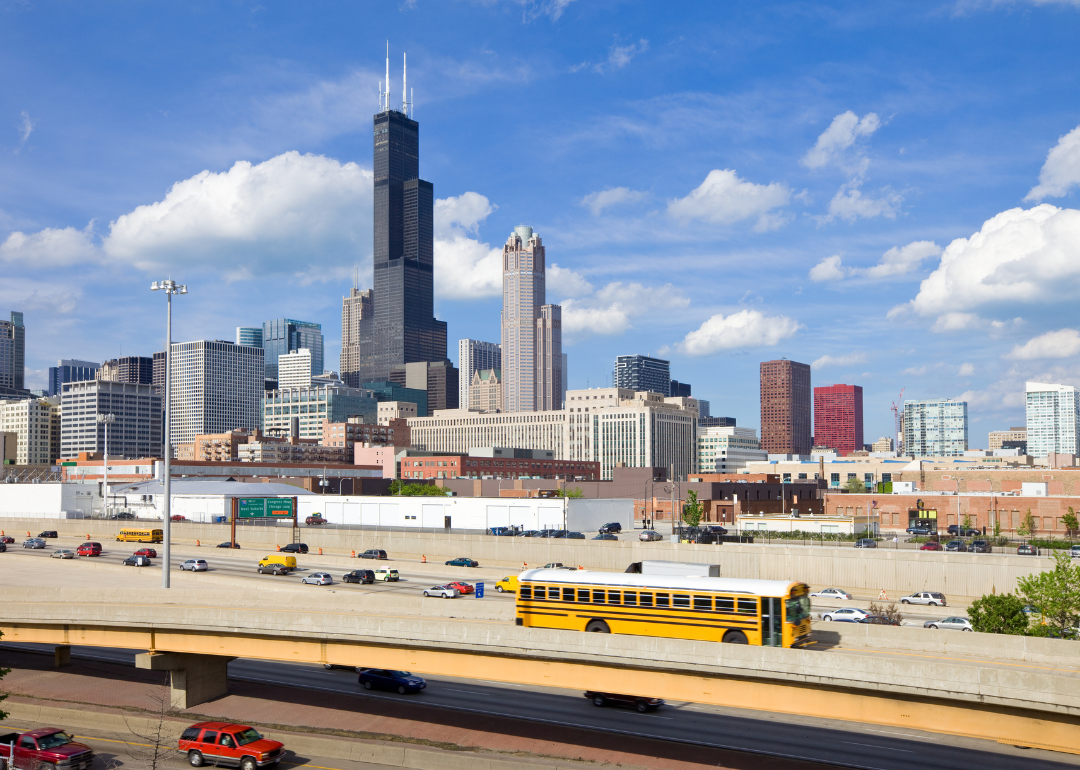
Illinois
A busy overpass with downtown Chicago in the background.
– Share of drivers who were uninsured, 2019: 12%
– Share of drivers who were uninsured, 2009: 15%
– Percentage point change: -3 percentage points
Canva
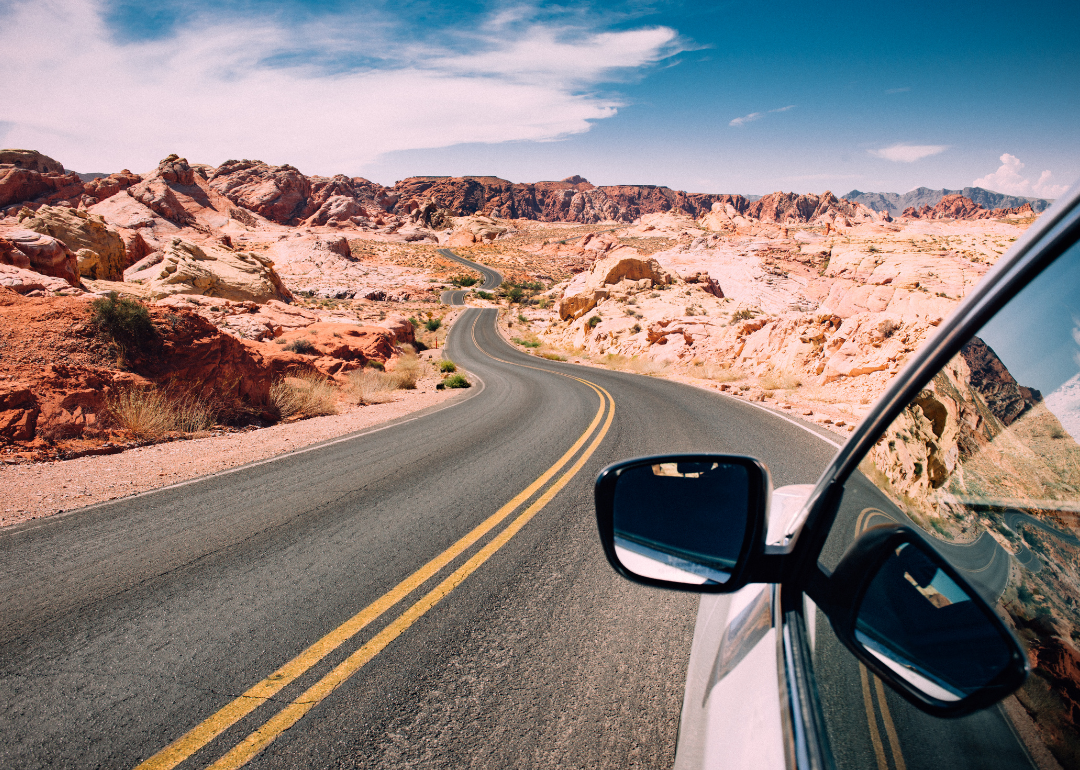
Nevada
A car on a road winding through rugged mountains.
– Share of drivers who were uninsured, 2019: 10%
– Share of drivers who were uninsured, 2009: 13%
– Percentage point change: -3 percentage points
Canva
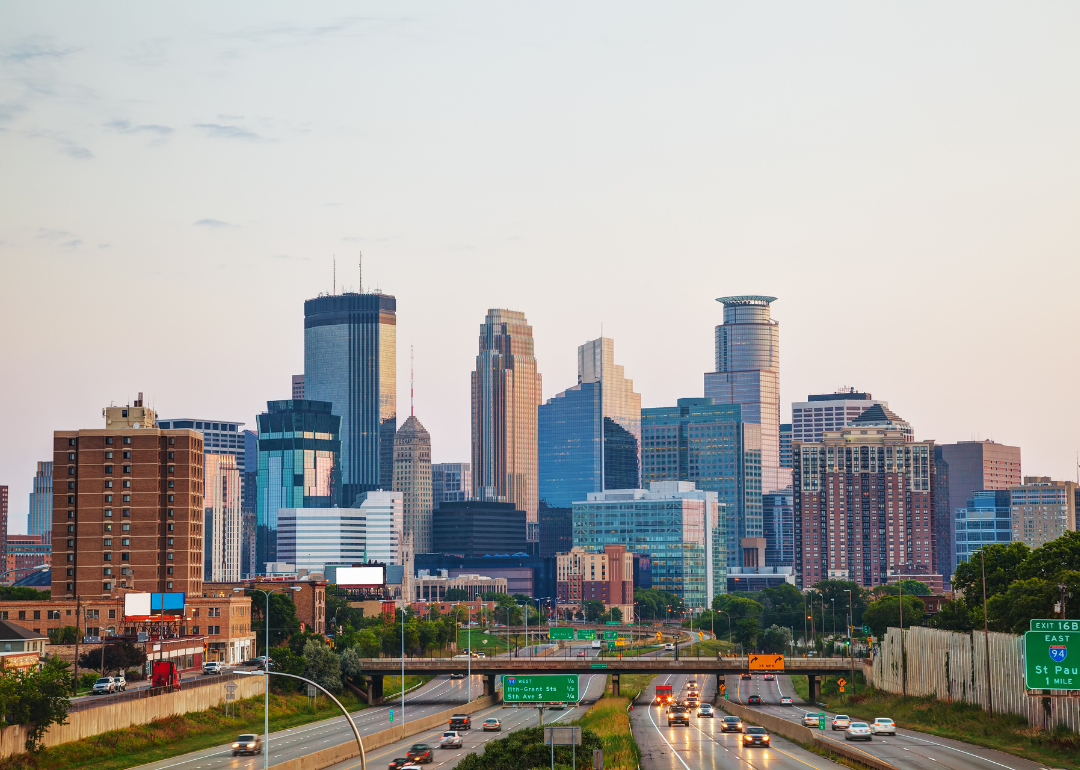
Minnesota
A highway with the Minneapolis skyline in the background.
– Share of drivers who were uninsured, 2019: 10%
– Share of drivers who were uninsured, 2009: 13%
– Percentage point change: -3 percentage points
Canva
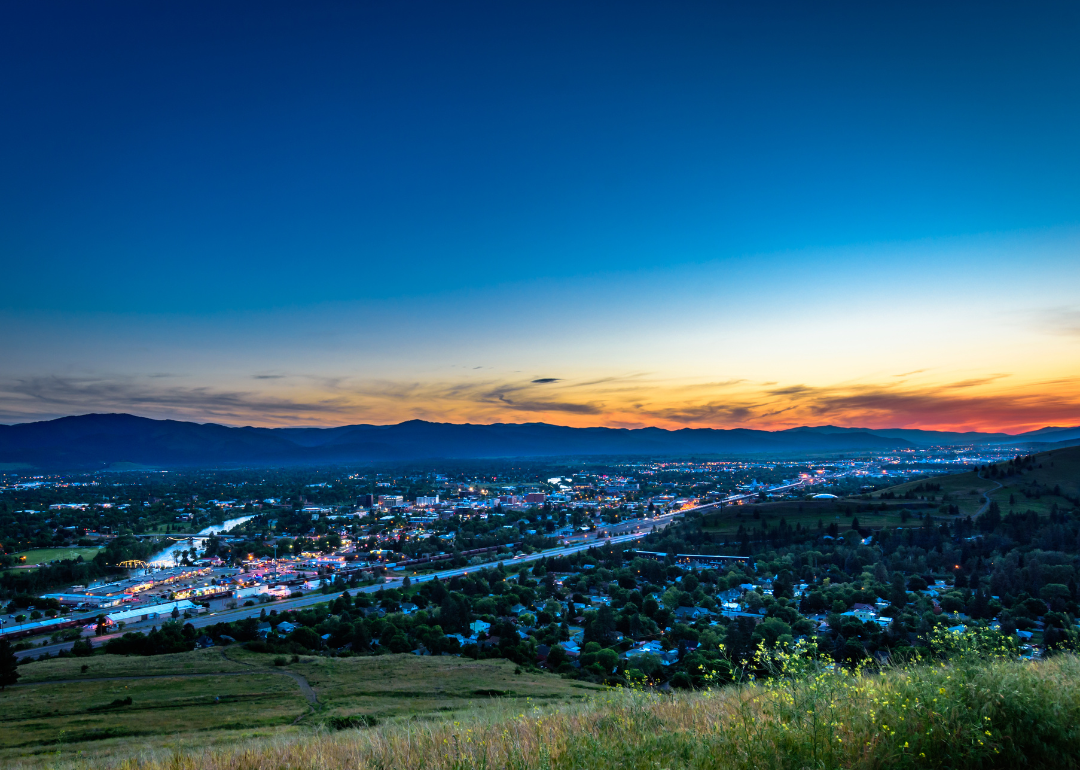
Montana
A faraway view of Missoula from an overlook at night.
– Share of drivers who were uninsured, 2019: 9%
– Share of drivers who were uninsured, 2009: 11%
– Percentage point change: -2 percentage points
Canva
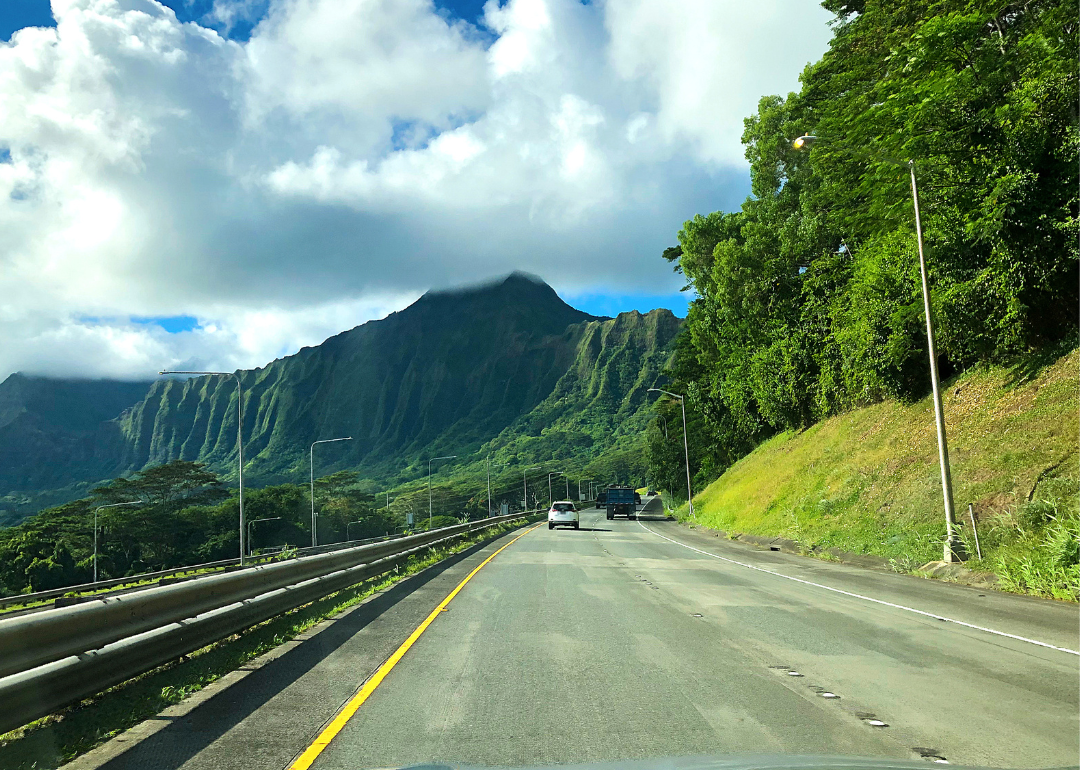
Hawaii
A highway going through green mountains.
– Share of drivers who were uninsured, 2019: 9%
– Share of drivers who were uninsured, 2009: 11%
– Percentage point change: -2 percentage points
Canva
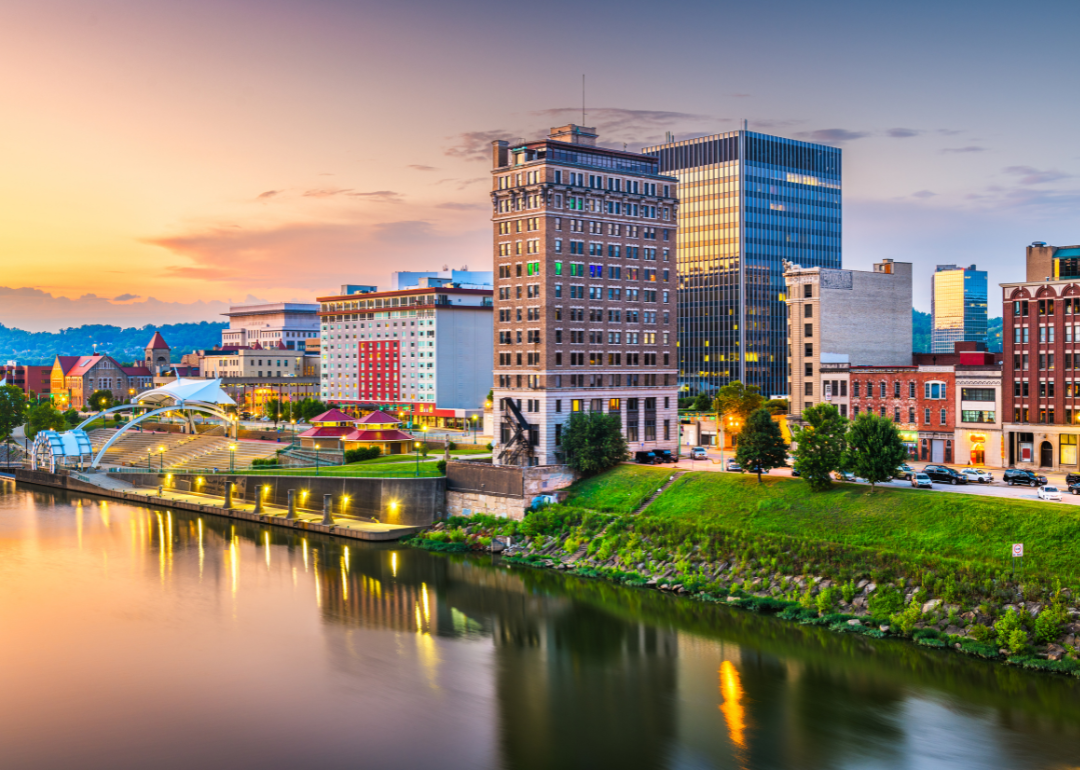
West Virginia
Charleston, West Virginia on the water.
– Share of drivers who were uninsured, 2019: 9%
– Share of drivers who were uninsured, 2009: 11%
– Percentage point change: -2 percentage points
Canva
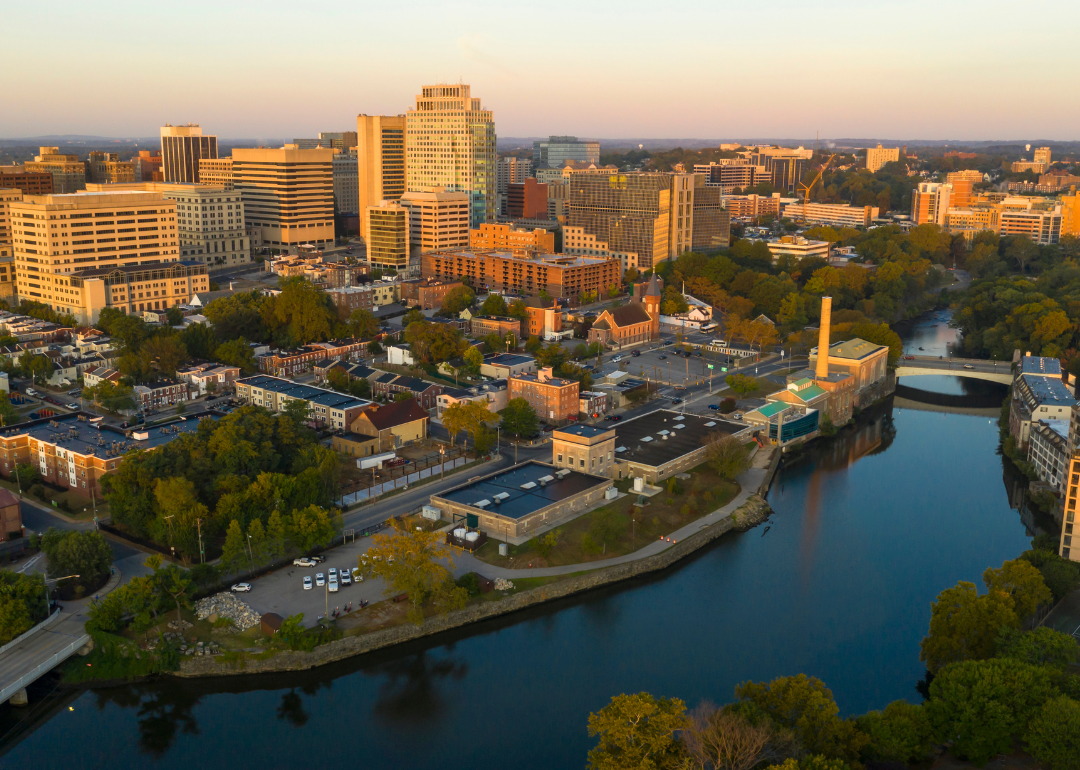
Delaware
An aerial view of downtown Wilmington.
– Share of drivers who were uninsured, 2019: 9%
– Share of drivers who were uninsured, 2009: 11%
– Percentage point change: -2 percentage points
Canva
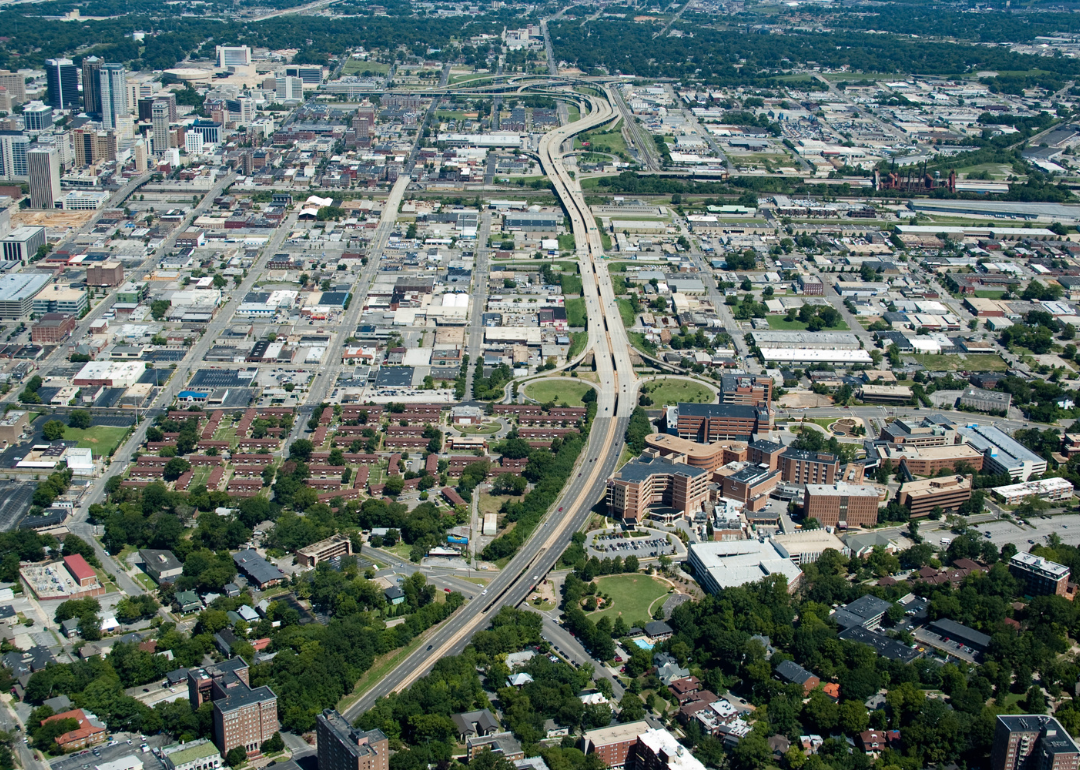
Alabama
An aerial view of Birmingham.
– Share of drivers who were uninsured, 2019: 20%
– Share of drivers who were uninsured, 2009: 22%
– Percentage point change: -2 percentage points
Canva
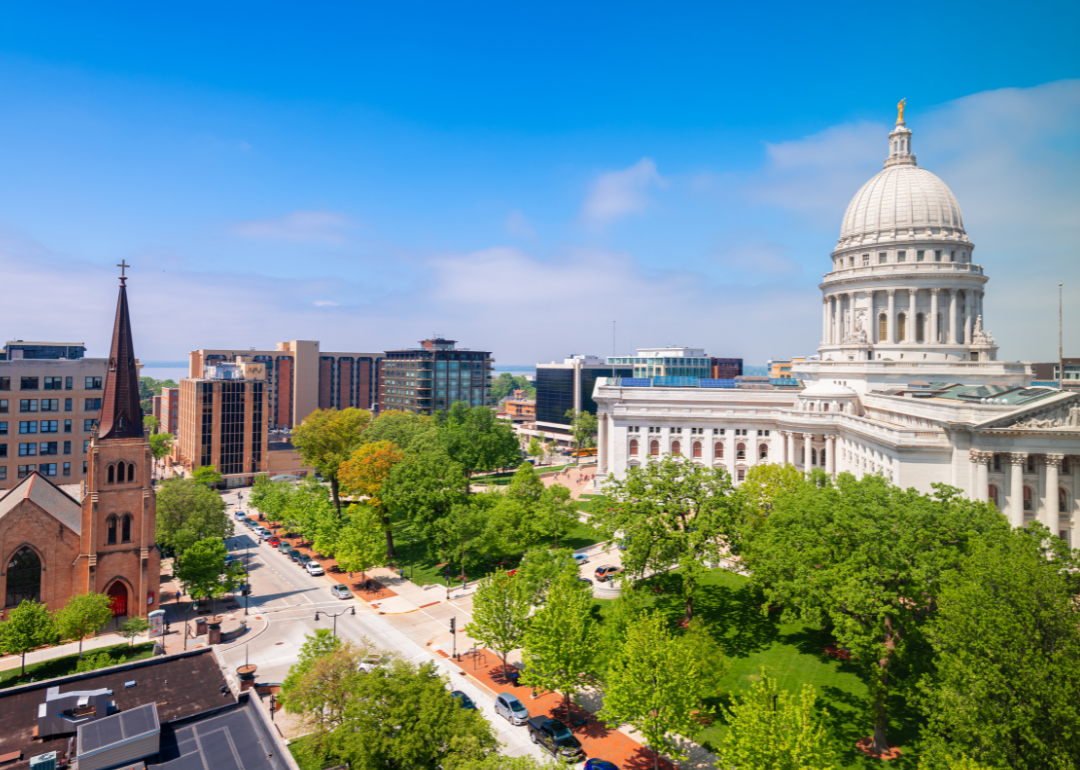
Wisconsin
The state capitol and downtown Madison.
– Share of drivers who were uninsured, 2019: 13%
– Share of drivers who were uninsured, 2009: 15%
– Percentage point change: -2 percentage points
Canva
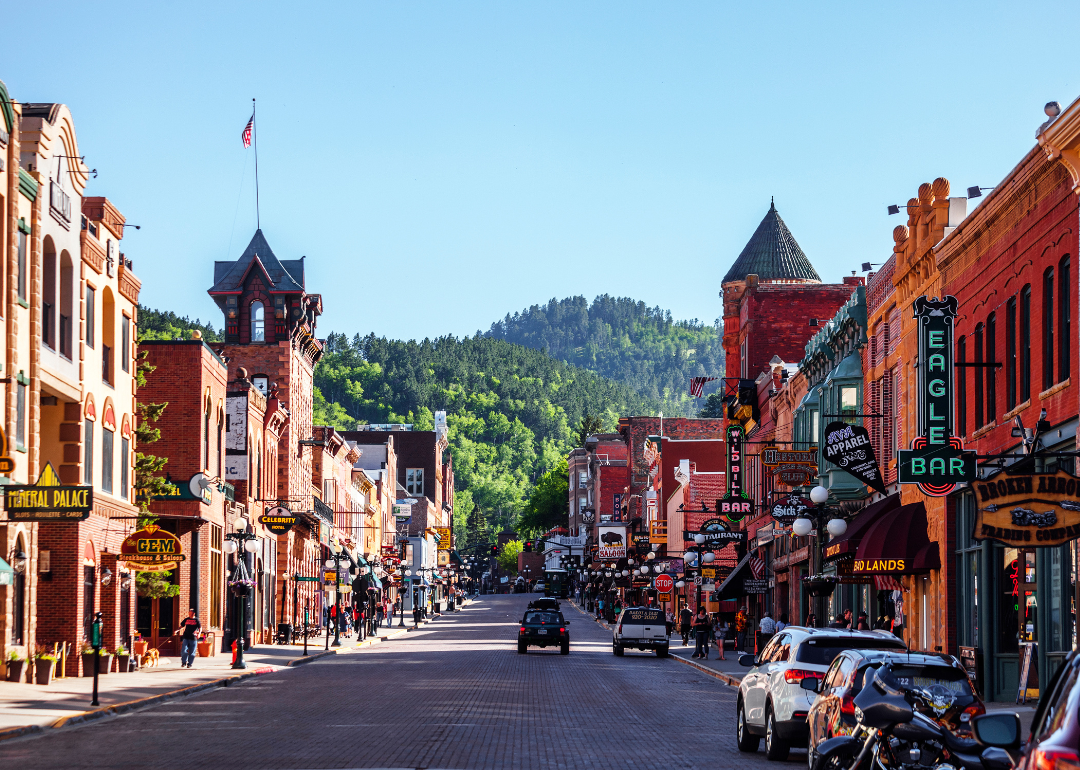
South Dakota
Historic Deadwood main street.
– Share of drivers who were uninsured, 2019: 7%
– Share of drivers who were uninsured, 2009: 9%
– Percentage point change: -2 percentage points
Canva
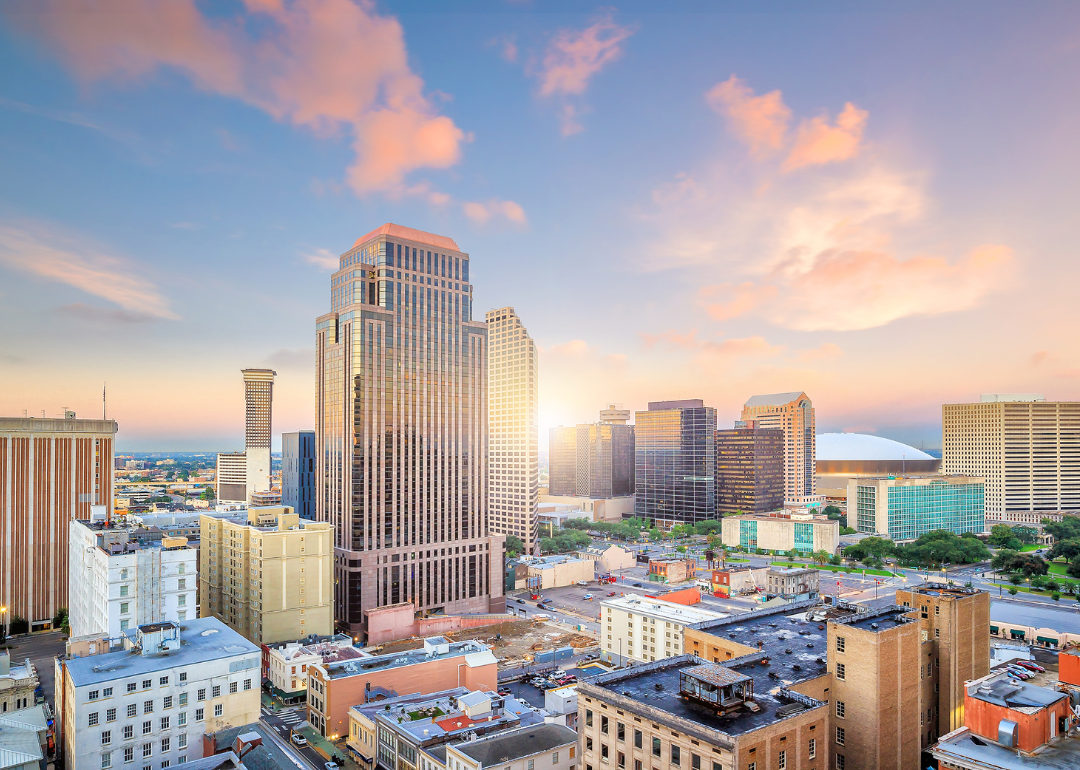
Louisiana
An aerial view of New Orleans.
– Share of drivers who were uninsured, 2019: 12%
– Share of drivers who were uninsured, 2009: 13%
– Percentage point change: -1 percentage points
Canva
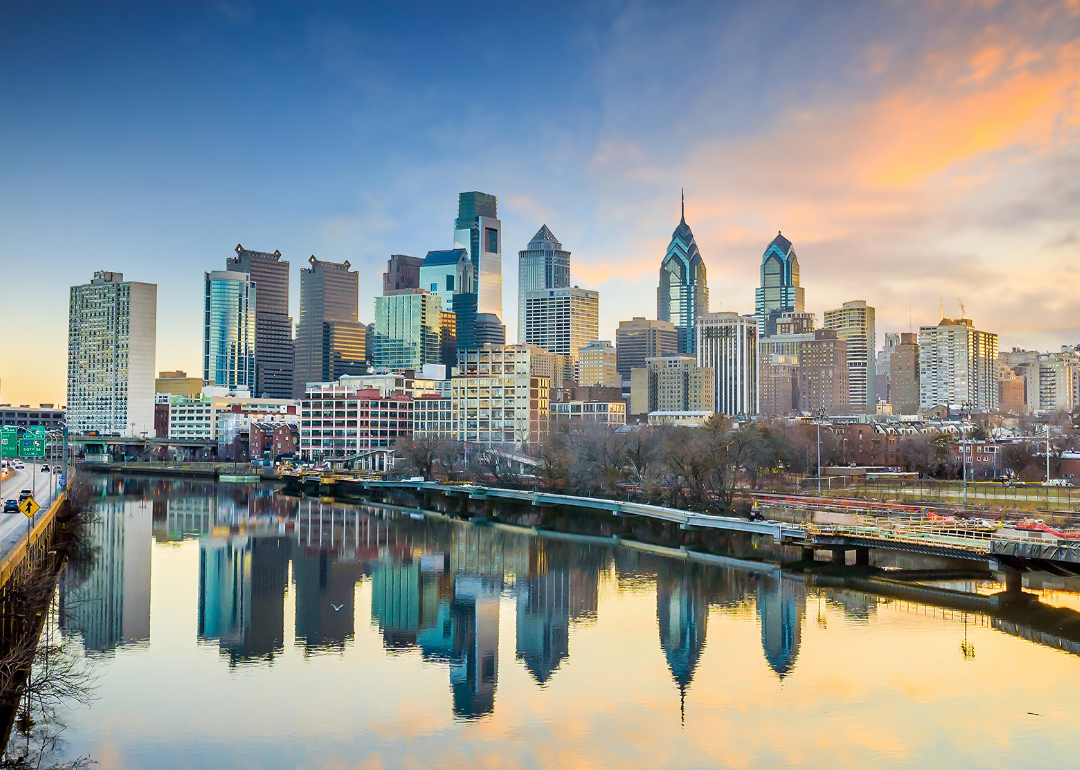
Pennsylvania
The downtown skyline of Philadelphia.
– Share of drivers who were uninsured, 2019: 6%
– Share of drivers who were uninsured, 2009: 7%
– Percentage point change: -1 percentage points

Canva
New York
A cyclist riding through heavy traffic.
– Share of drivers who were uninsured, 2019: 4%
– Share of drivers who were uninsured, 2009: 5%
– Percentage point change: -1 percentage points
Canva
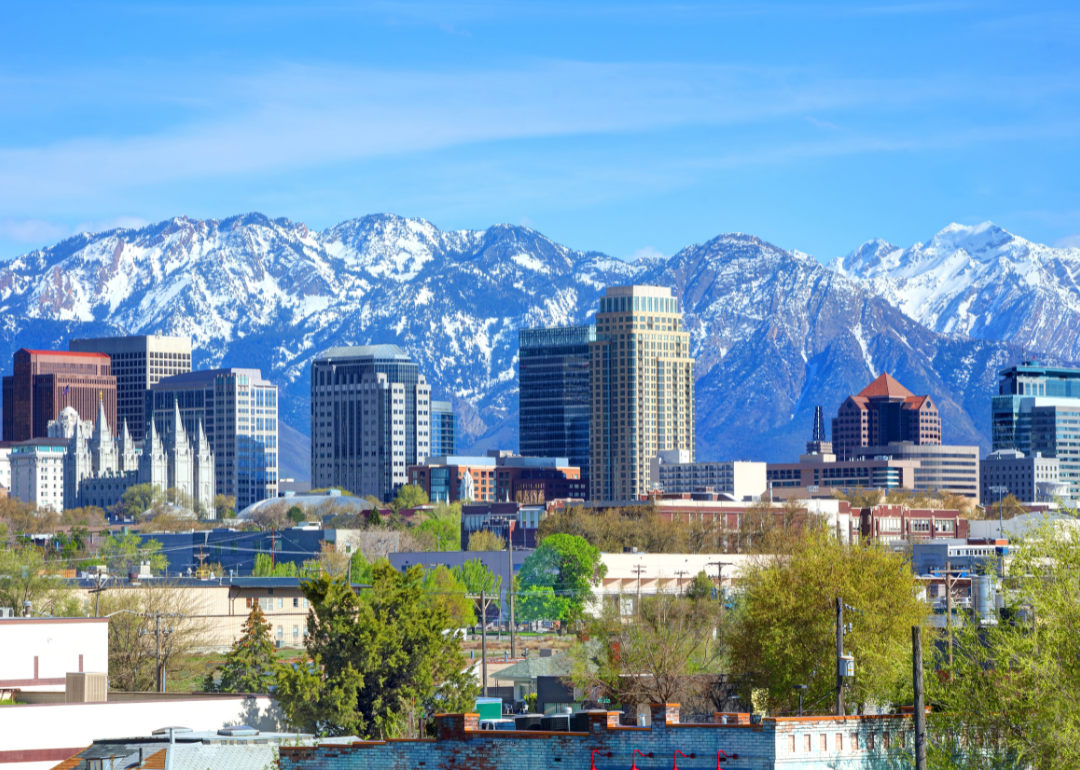
Utah
The Salt Lake City skyline with mountains in the background.
– Share of drivers who were uninsured, 2019: 7%
– Share of drivers who were uninsured, 2009: 8%
– Percentage point change: -1 percentage points
Canva
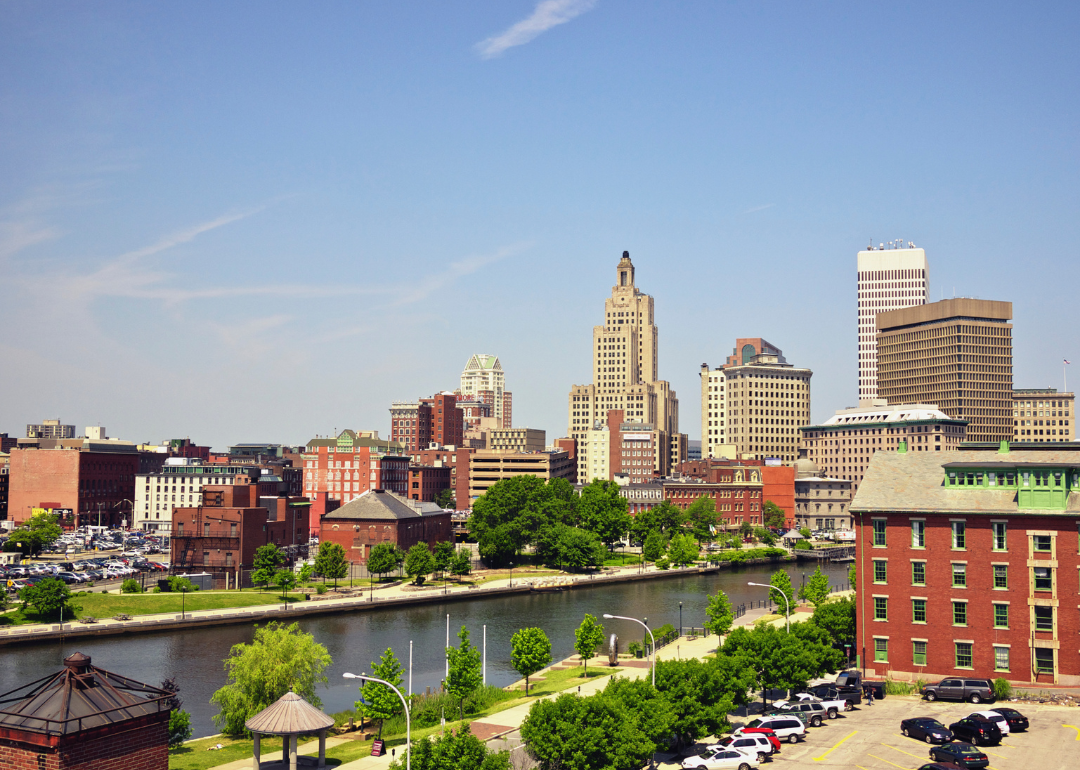
Rhode Island
The Providence skyline.
– Share of drivers who were uninsured, 2019: 17%
– Share of drivers who were uninsured, 2009: 18%
– Percentage point change: -1 percentage points
Canva
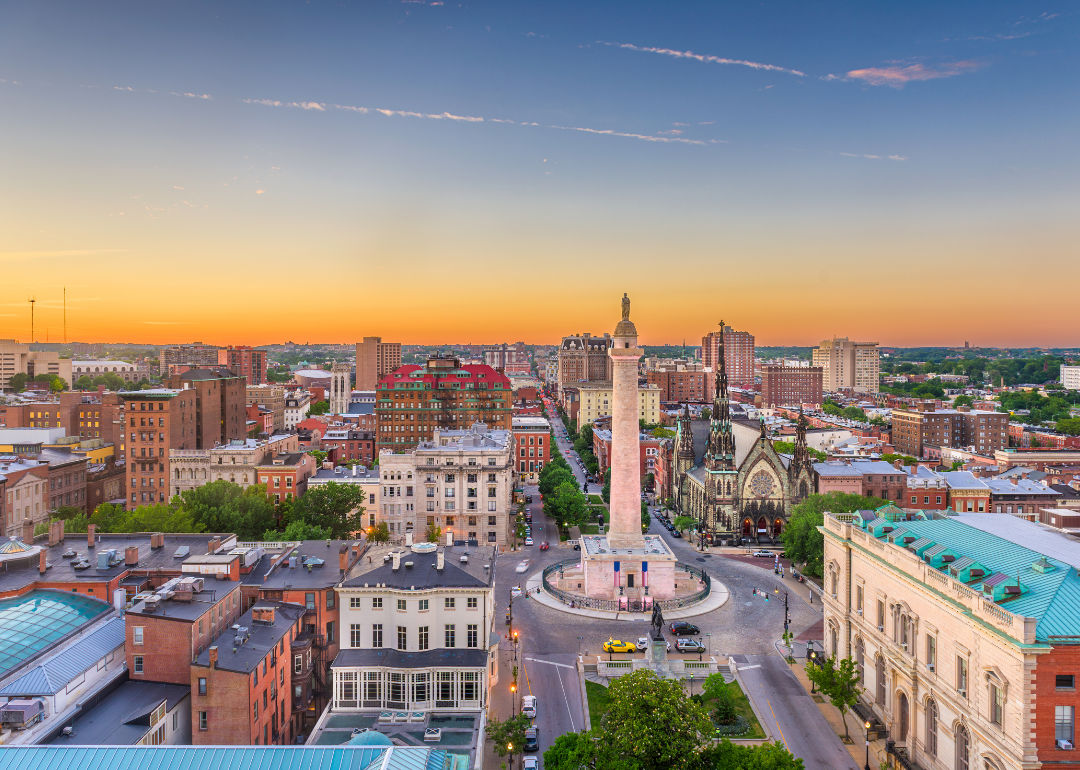
Maryland
An aerial view of downtown Baltimore.
– Share of drivers who were uninsured, 2019: 14%
– Share of drivers who were uninsured, 2009: 15%
– Percentage point change: -1 percentage points
Canva
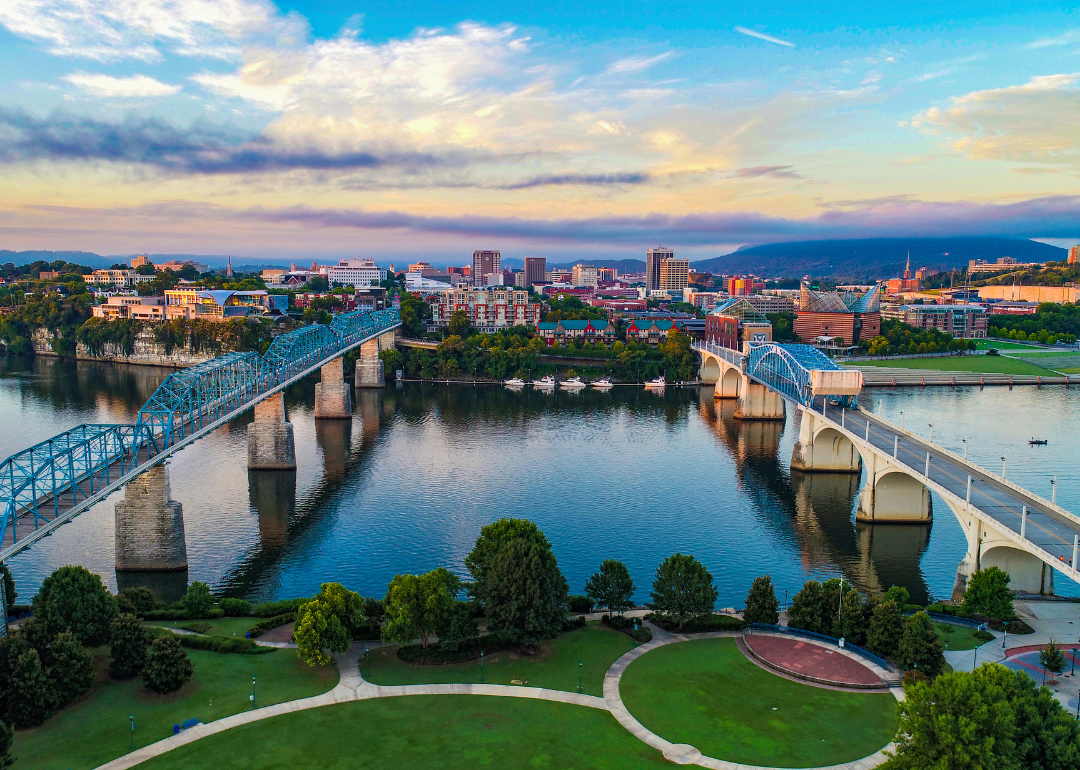
Tennessee
An aerial view of bridges going into downtown Chattanooga.
– Share of drivers who were uninsured, 2019: 24%
– Share of drivers who were uninsured, 2009: 24%
– Percentage point change: No change
Canva
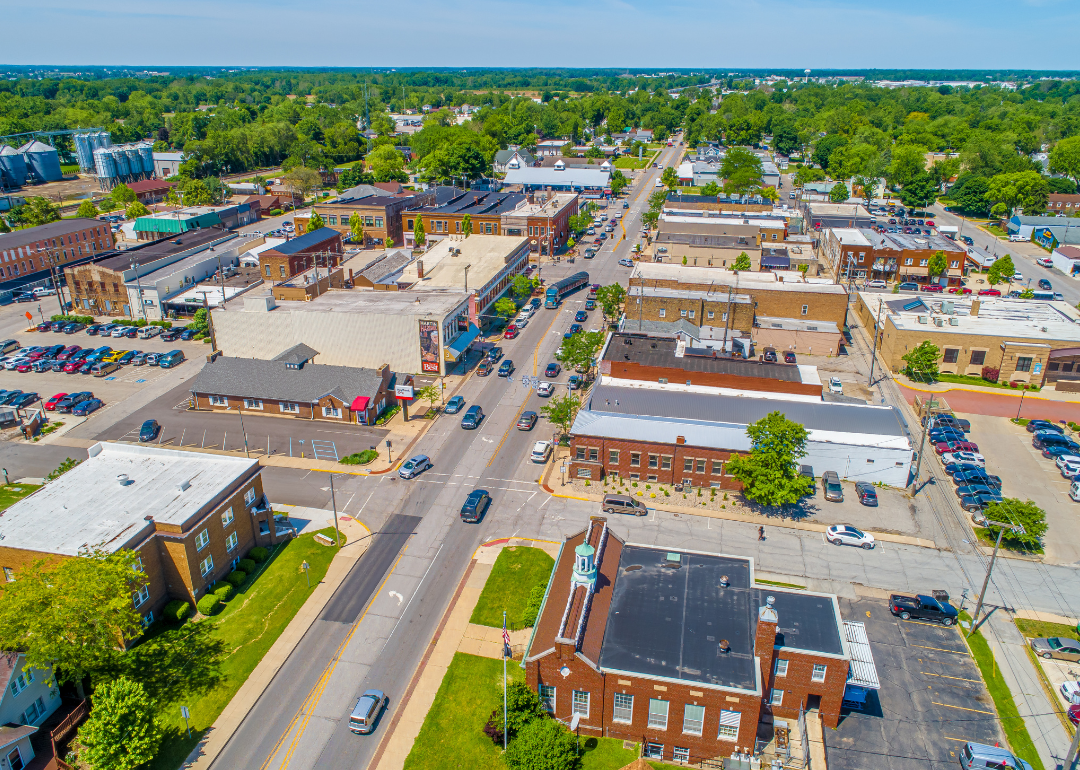
Indiana
An aerial view of small town Nappanee.
– Share of drivers who were uninsured, 2019: 16%
– Share of drivers who were uninsured, 2009: 16%
– Percentage point change: No change
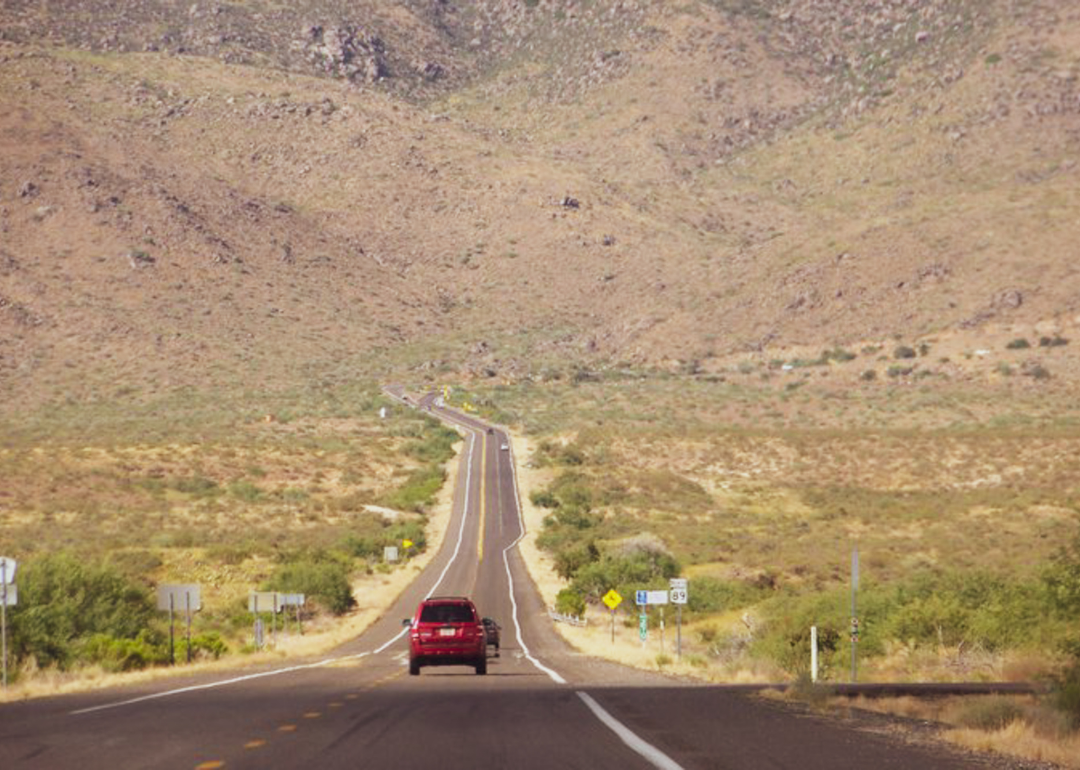
Canva
Arizona
Cars on a highway heading towards a dry mountain landscape.
– Share of drivers who were uninsured, 2019: 12%
– Share of drivers who were uninsured, 2009: 12%
– Percentage point change: No change
Canva
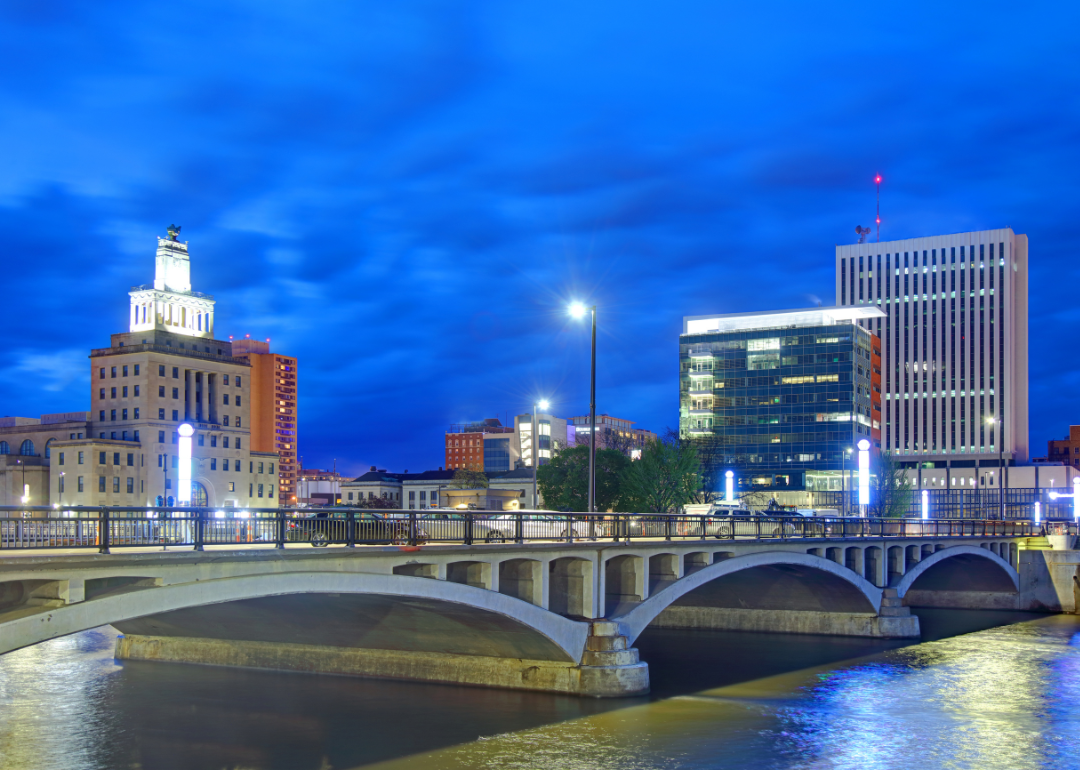
Iowa
A bridge in downtown Cedar Rapids.
– Share of drivers who were uninsured, 2019: 11%
– Share of drivers who were uninsured, 2009: 11%
– Percentage point change: No change
Canva
Virginia
Cars in downtown Virginia Beach.
– Share of drivers who were uninsured, 2019: 11%
– Share of drivers who were uninsured, 2009: 11%
– Percentage point change: No change
Canva
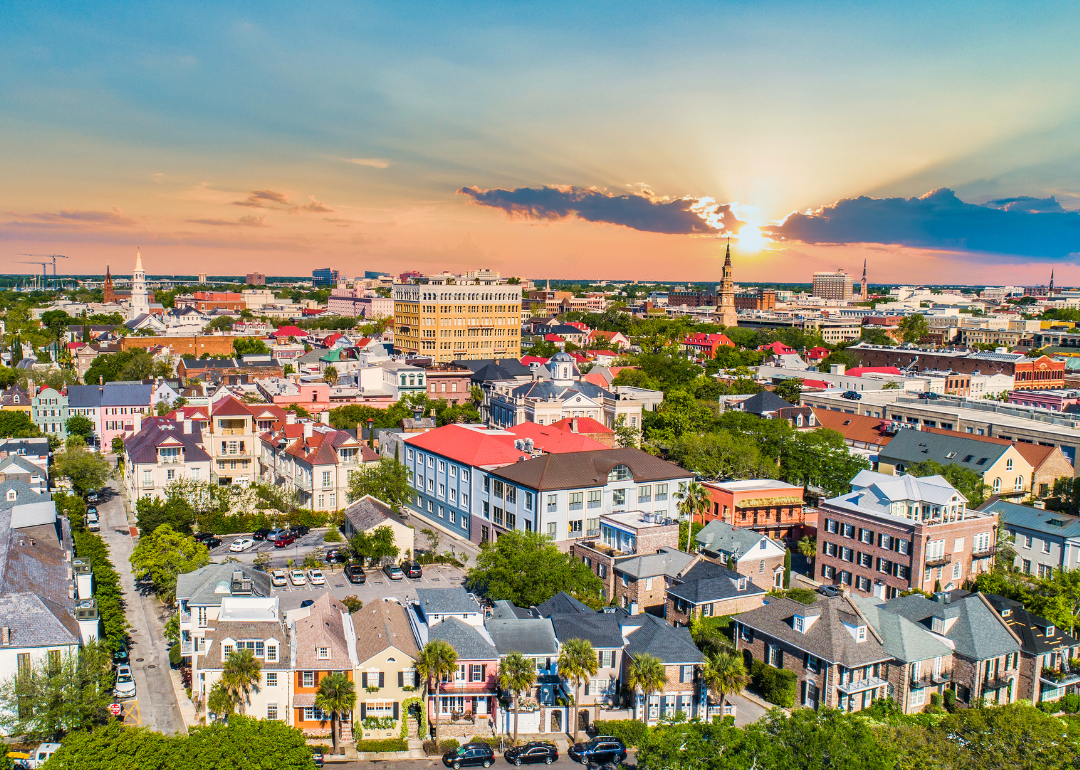
South Carolina
An aerial view of homes and downtown Charleston.
– Share of drivers who were uninsured, 2019: 11%
– Share of drivers who were uninsured, 2009: 11%
– Percentage point change: No change
Canva
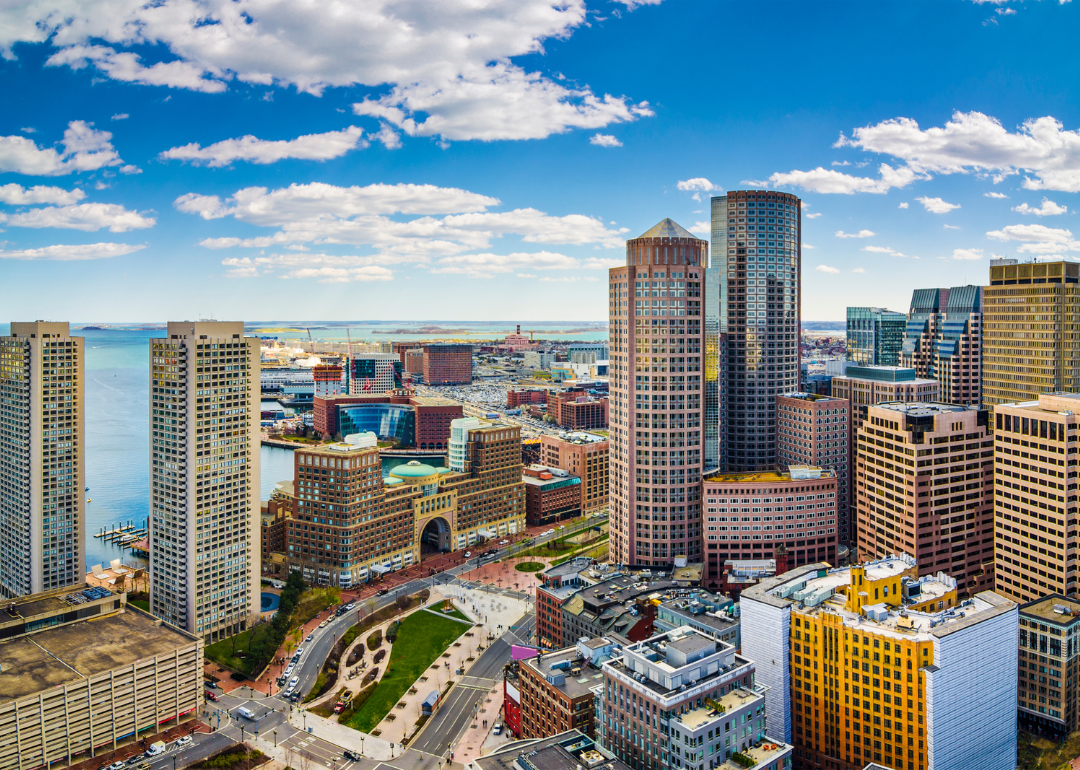
Massachusetts
An aerial view of downtown Boston on the water.
– Share of drivers who were uninsured, 2019: 4%
– Share of drivers who were uninsured, 2009: 4%
– Percentage point change: No change
Canva
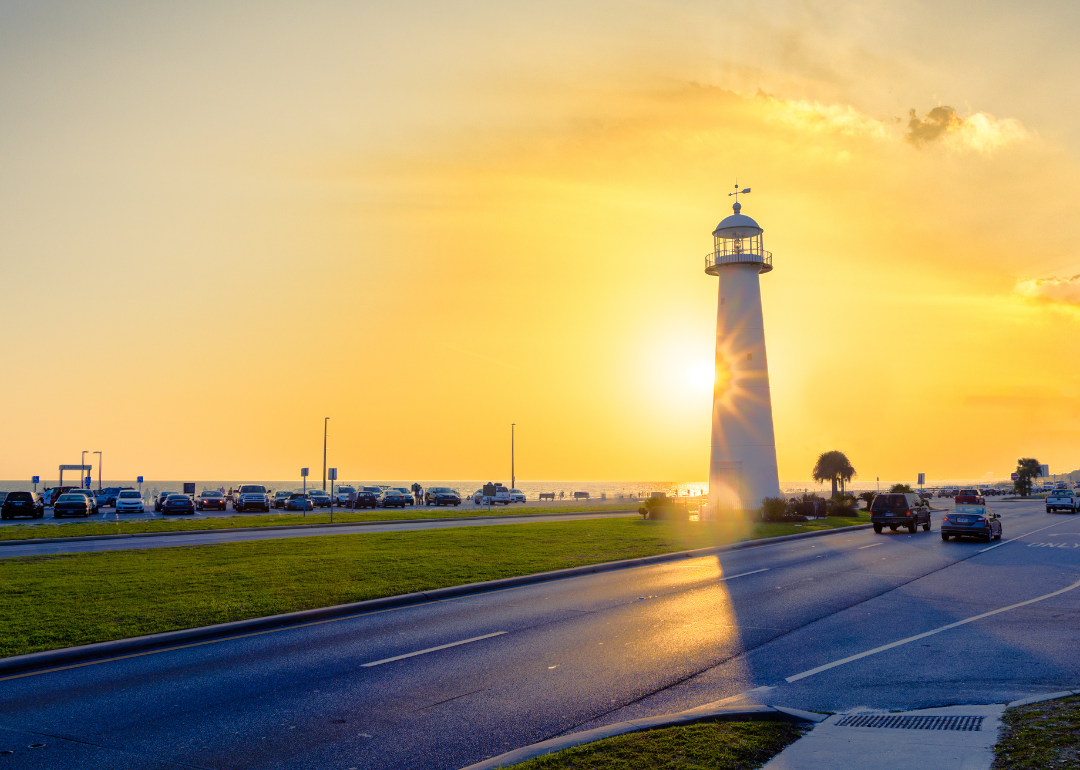
Mississippi
A road passing a lighthouse at sunset in Biloxi.
– Share of drivers who were uninsured, 2019: 29%
– Share of drivers who were uninsured, 2009: 28%
– Percentage point change: +1 percentage points
Canva
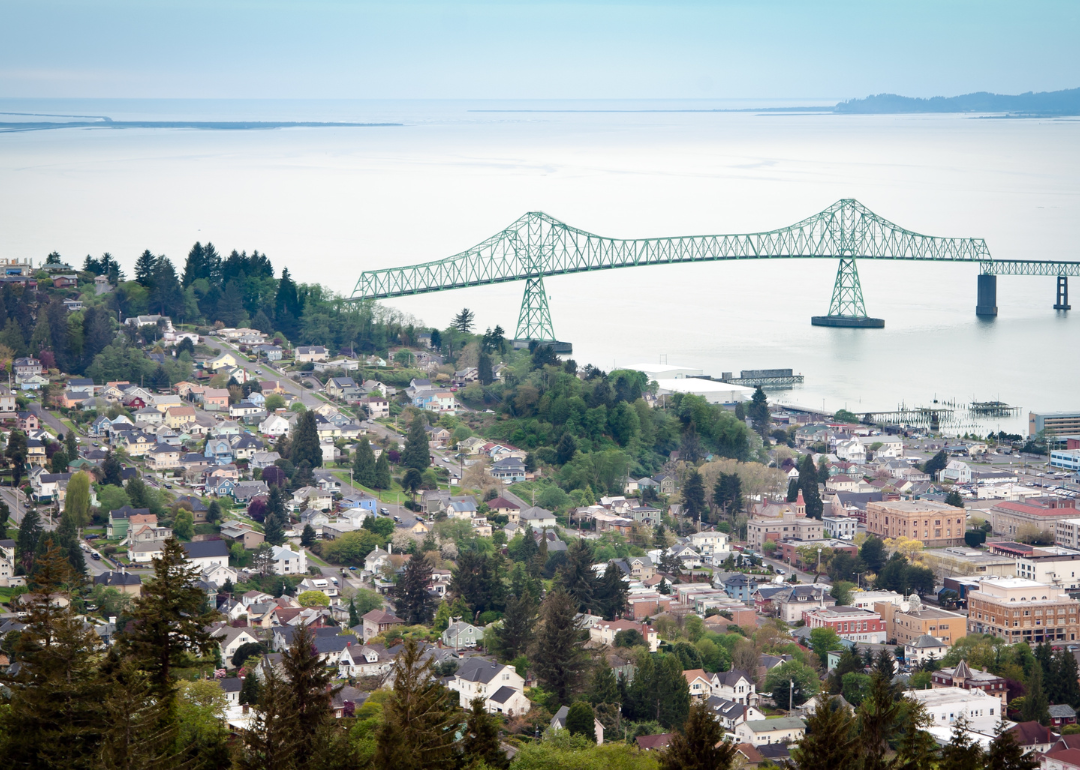
Oregon
An aerial view of a bridge going to Astoria.
– Share of drivers who were uninsured, 2019: 11%
– Share of drivers who were uninsured, 2009: 10%
– Percentage point change: +1 percentage points
Canva
Kansas
A four lane road lined with small buildings in Wichita.
– Share of drivers who were uninsured, 2019: 11%
– Share of drivers who were uninsured, 2009: 10%
– Percentage point change: +1 percentage points
Canva
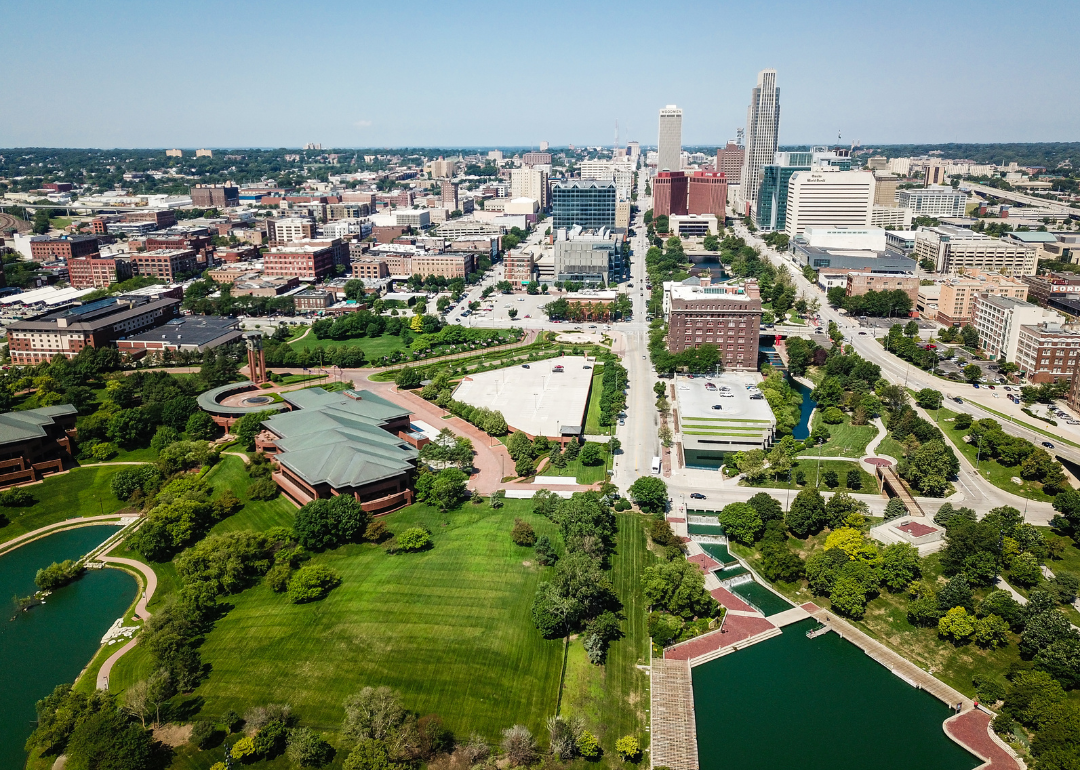
Nebraska
An aerial view of downtown Omaha.
– Share of drivers who were uninsured, 2019: 9%
– Share of drivers who were uninsured, 2009: 8%
– Percentage point change: +1 percentage points
Canva
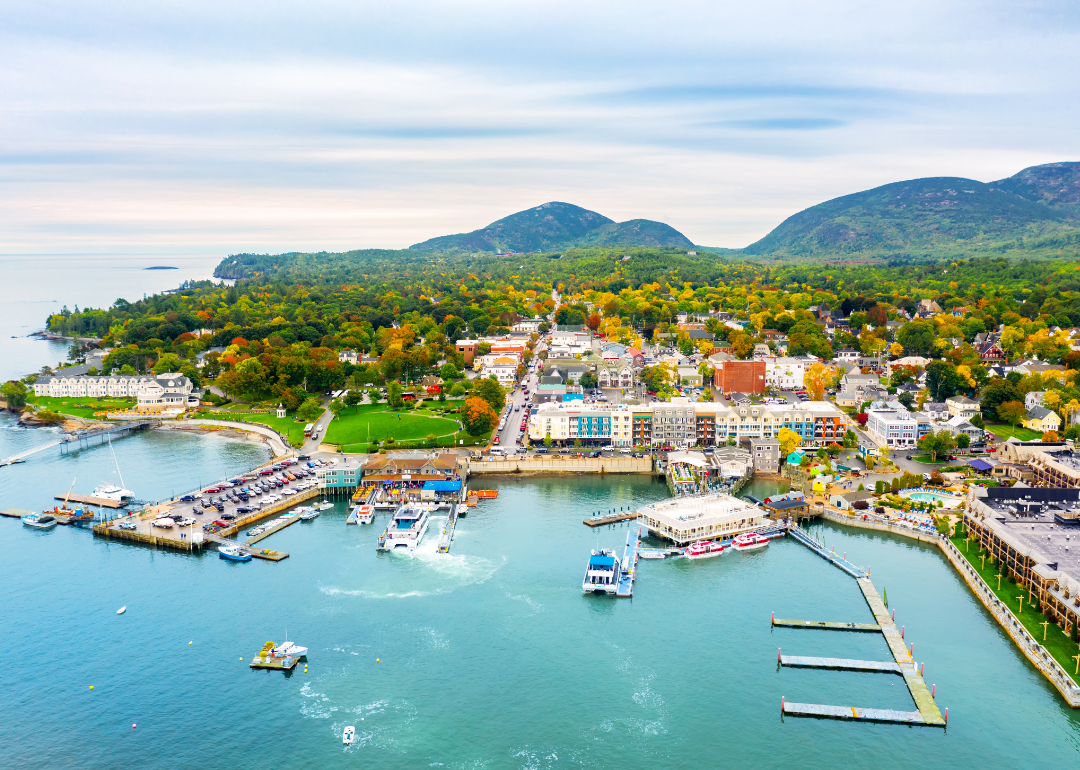
Maine
An aerial view of homes and boats in Bar Harbor on the water.
– Share of drivers who were uninsured, 2019: 5%
– Share of drivers who were uninsured, 2009: 4%
– Percentage point change: +1 percentage points
Canva
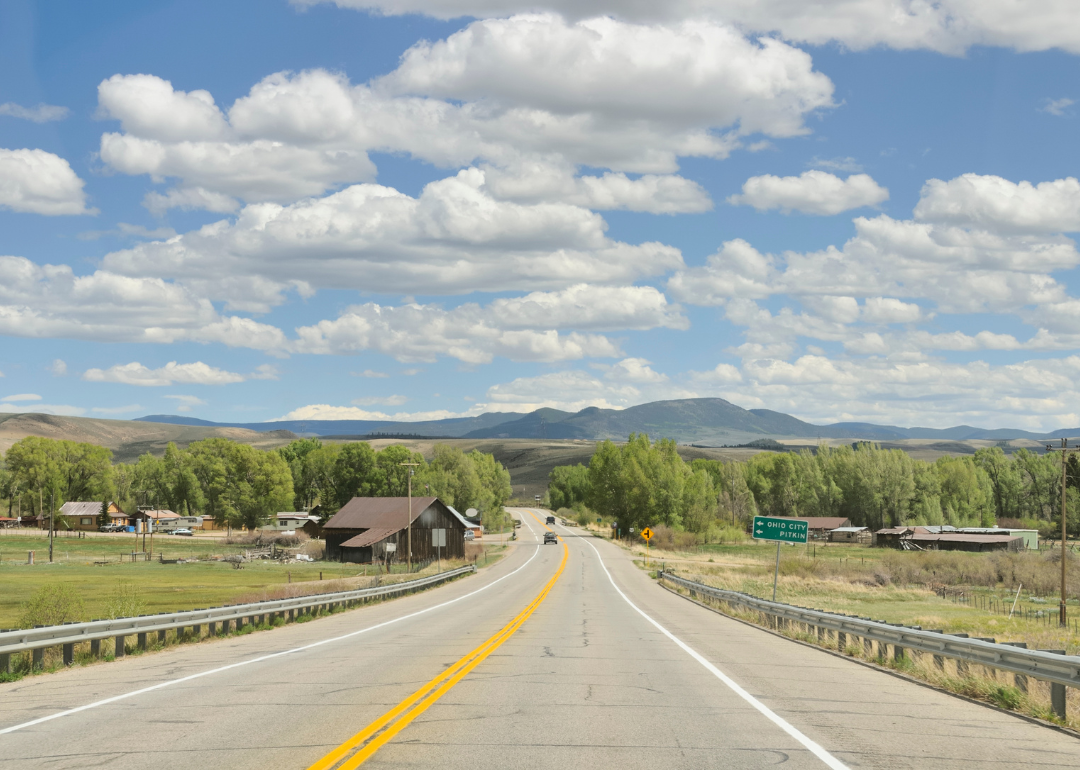
Colorado
A country road heading to the mountains.
– Share of drivers who were uninsured, 2019: 16%
– Share of drivers who were uninsured, 2009: 15%
– Percentage point change: +1 percentage points
Canva
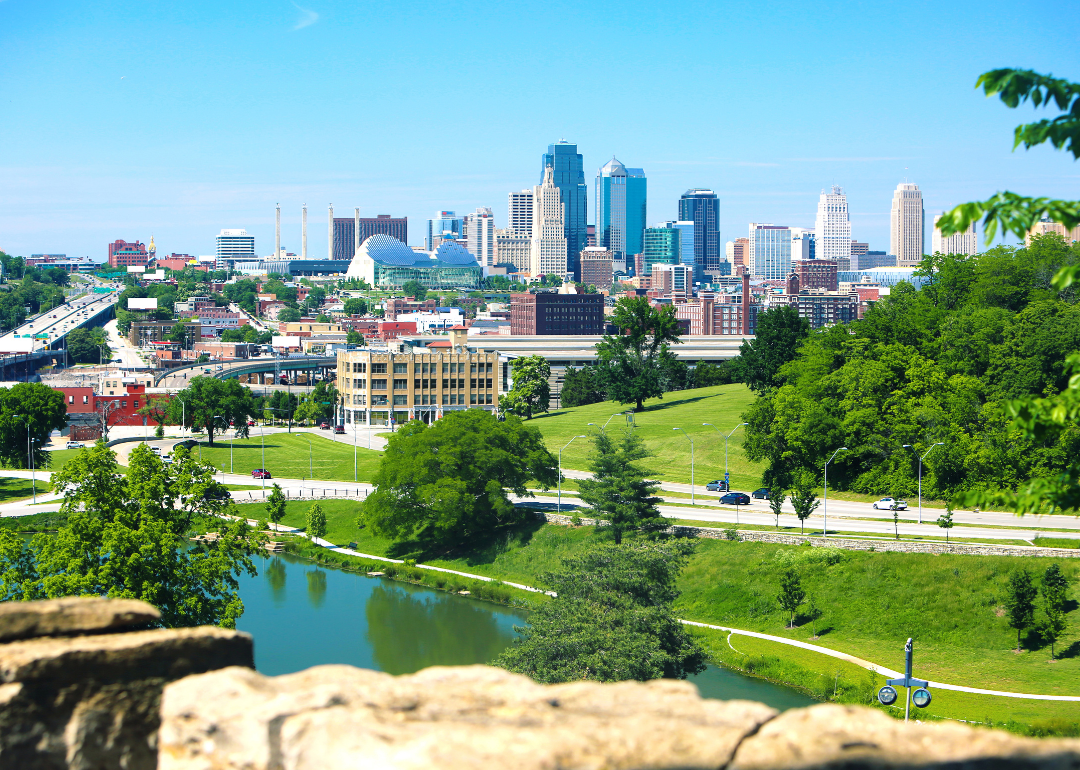
Missouri
The Kansas City skyline.
– Share of drivers who were uninsured, 2019: 16%
– Share of drivers who were uninsured, 2009: 14%
– Percentage point change: +2 percentage points
Canva
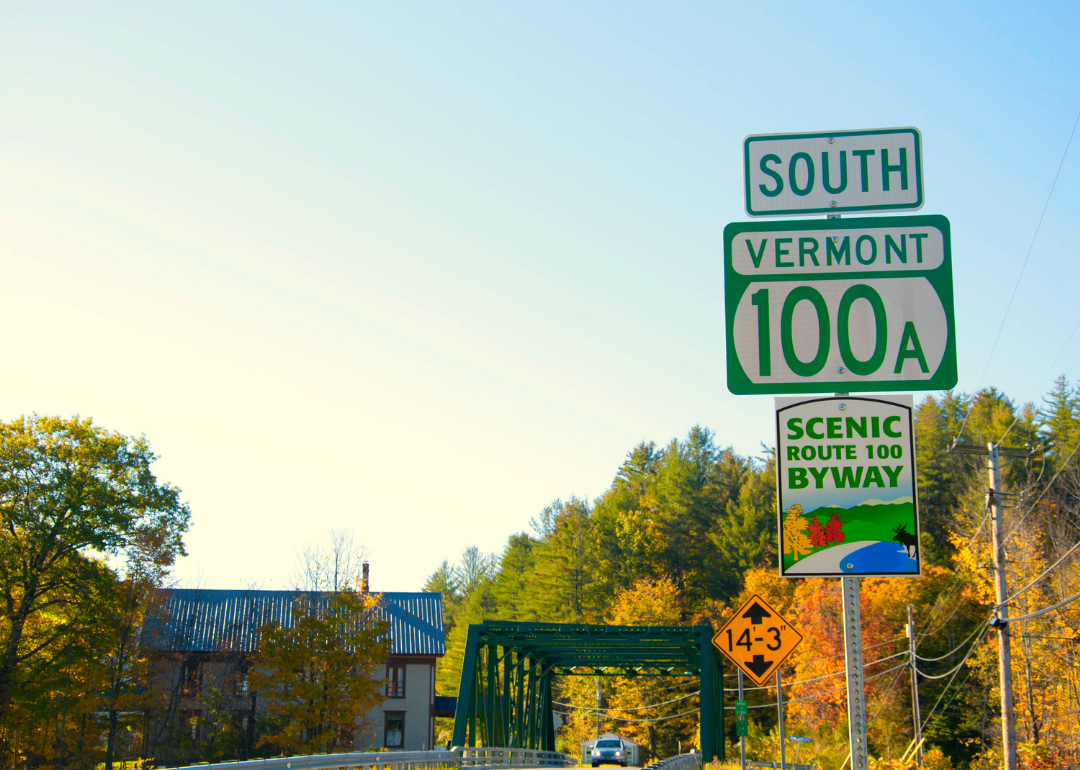
Vermont
A car driving across a bridge on a scenic road.
– Share of drivers who were uninsured, 2019: 9%
– Share of drivers who were uninsured, 2009: 7%
– Percentage point change: +2 percentage points
Canva
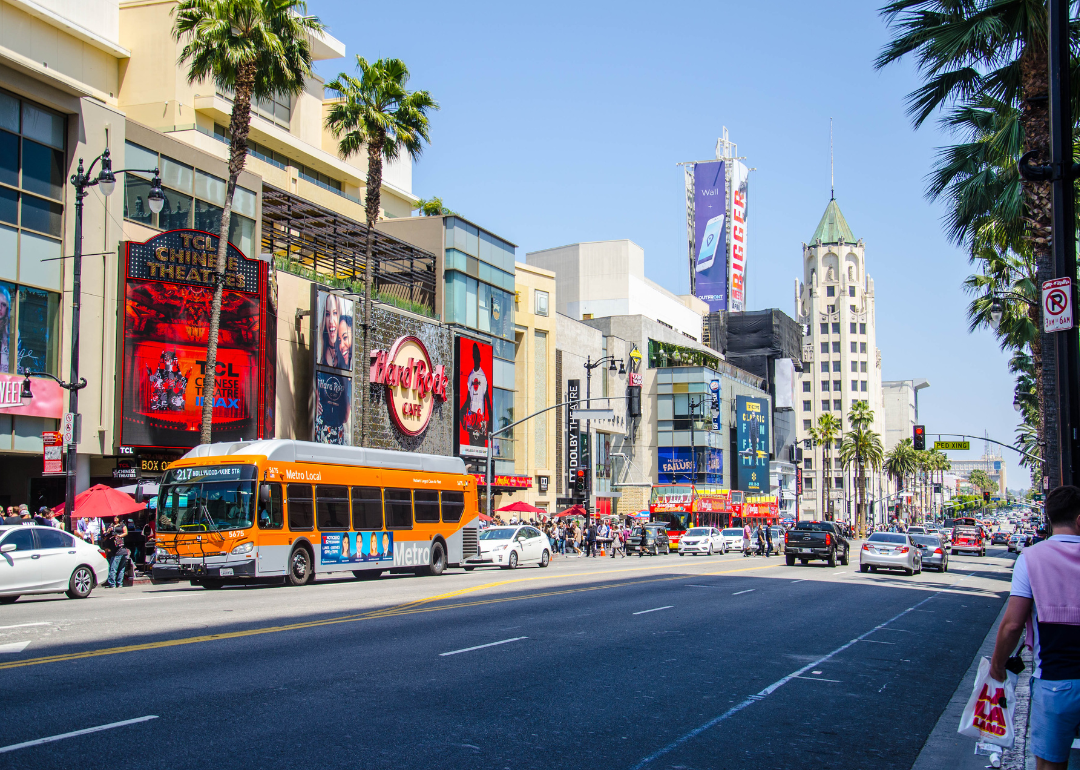
California
Busy streets in Hollywood.
– Share of drivers who were uninsured, 2019: 17%
– Share of drivers who were uninsured, 2009: 15%
– Percentage point change: +2 percentage points
Canva
Arkansas
Traffic in the small town of Fort Smith.
– Share of drivers who were uninsured, 2019: 19%
– Share of drivers who were uninsured, 2009: 16%
– Percentage point change: +3 percentage points
Canva
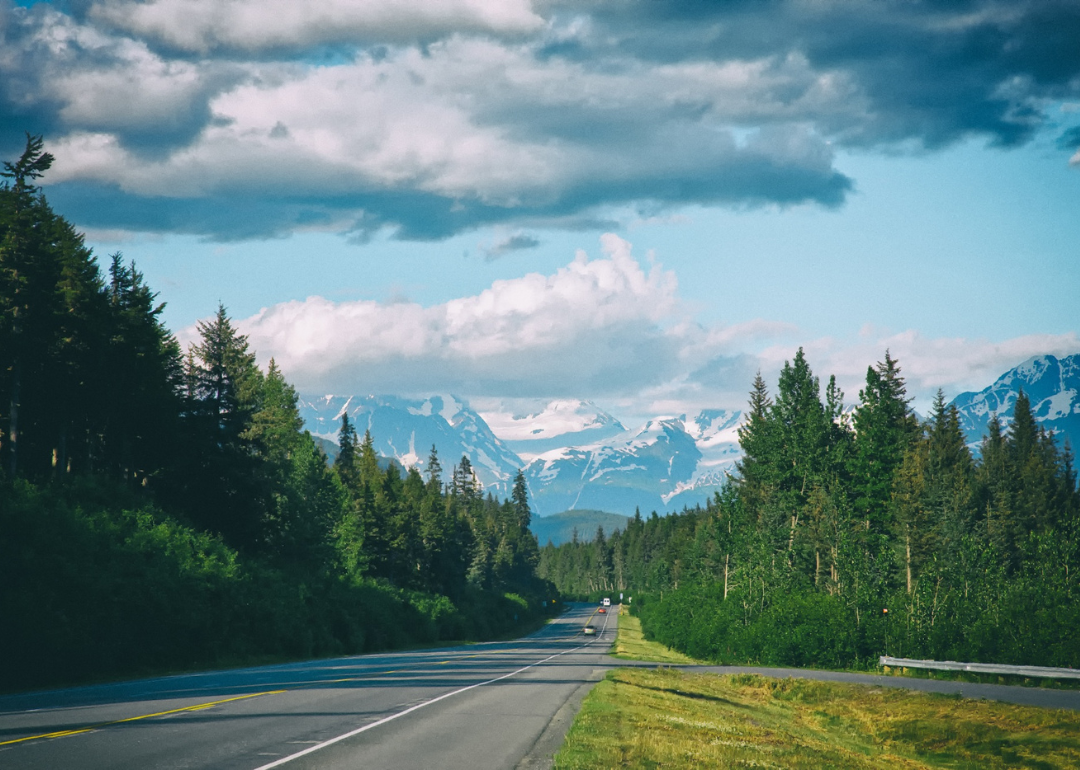
Alaska
A highway lined with evergreen trees heading towards snowy mountains.
– Share of drivers who were uninsured, 2019: 16%
– Share of drivers who were uninsured, 2009: 13%
– Percentage point change: +3 percentage points
Canva
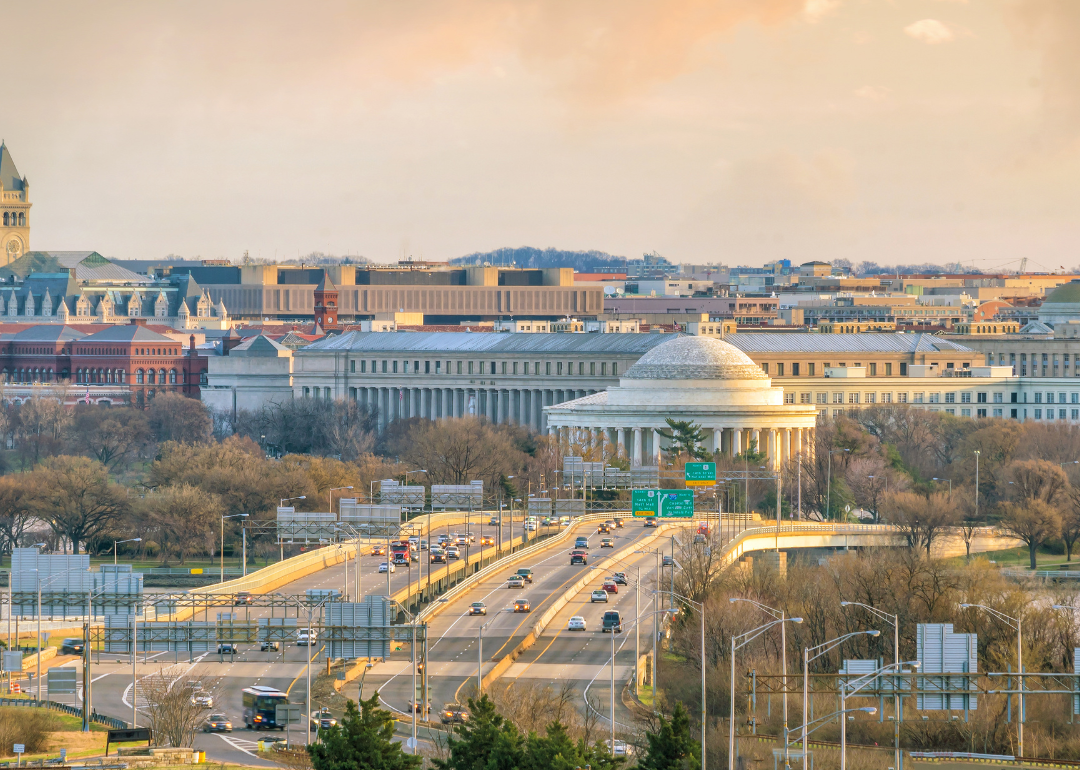
Washington D.C.
Highways and the city skyline in D.C.
– Share of drivers who were uninsured, 2019: 19%
– Share of drivers who were uninsured, 2009: 15%
– Percentage point change: +4 percentage points
Canva
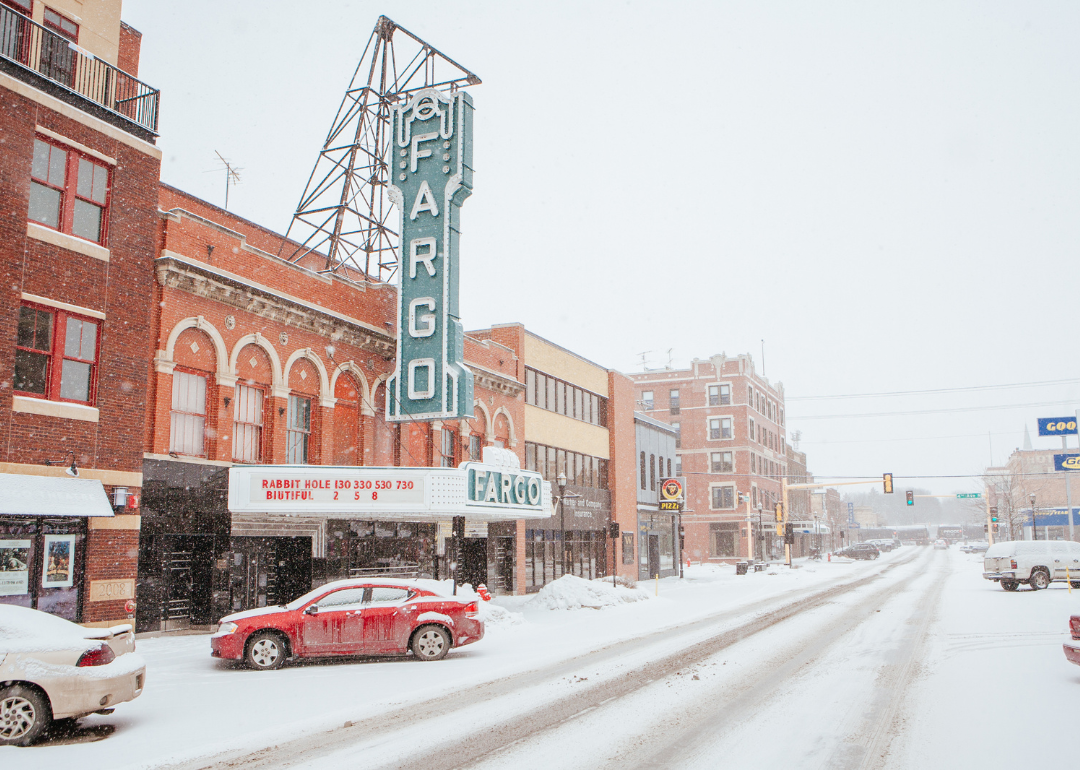
North Dakota
Historic downtown Fargo in the snow.
– Share of drivers who were uninsured, 2019: 13%
– Share of drivers who were uninsured, 2009: 9%
– Percentage point change: +4 percentage points
Canva
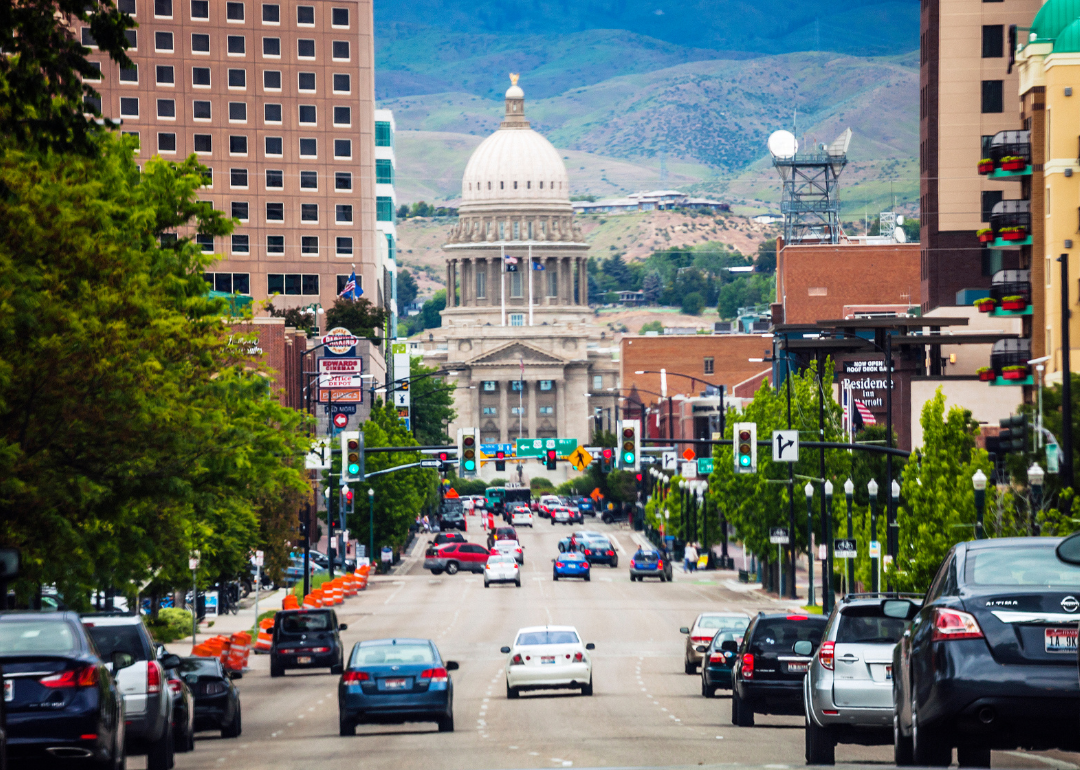
Idaho
A busy road to the capitol in Boise.
– Share of drivers who were uninsured, 2019: 13%
– Share of drivers who were uninsured, 2009: 8%
– Percentage point change: +5 percentage points
Canva
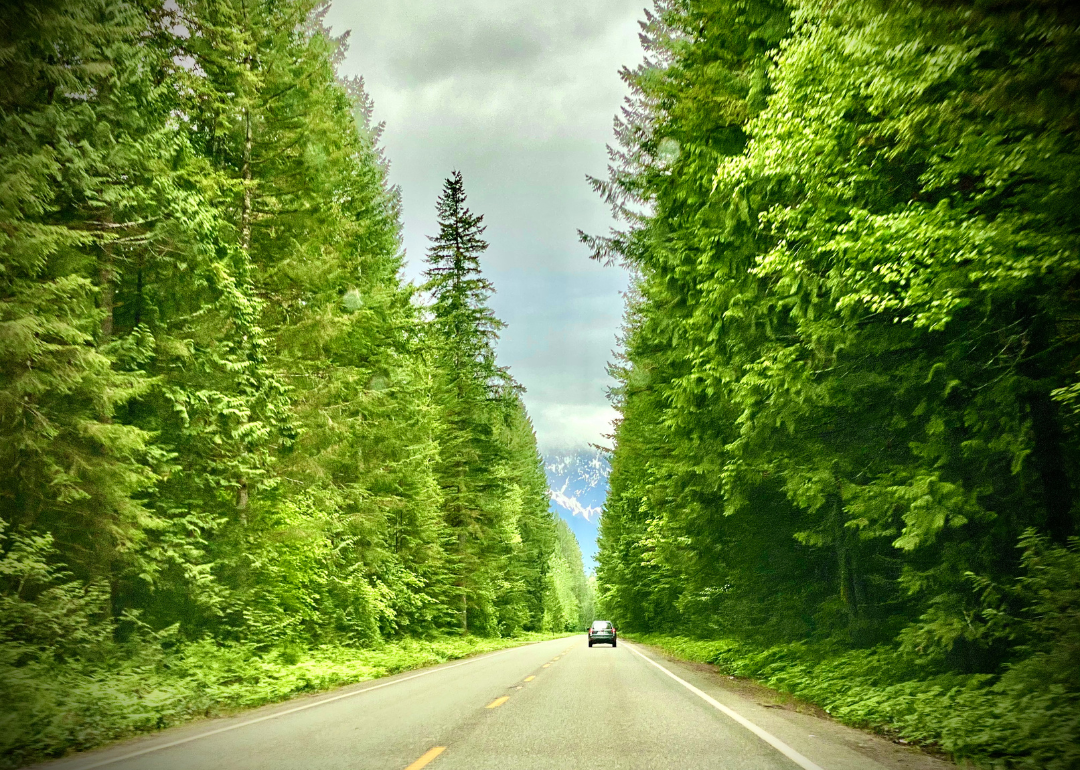
Washington
A car on a road lined with tall evergreen trees.
– Share of drivers who were uninsured, 2019: 22%
– Share of drivers who were uninsured, 2009: 16%
– Percentage point change: +6 percentage points
Canva
Michigan
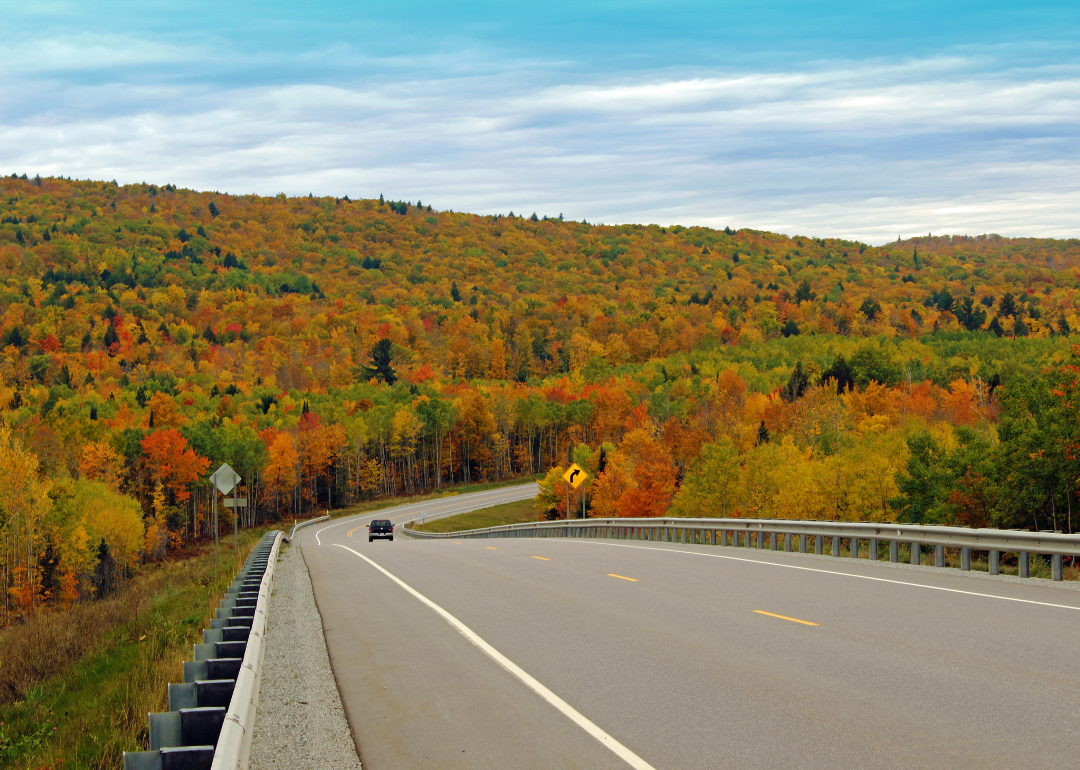
A truck on the highway surrounded by fall foliage.
– Share of drivers who were uninsured, 2019: 26%
– Share of drivers who were uninsured, 2009: 19%
– Percentage point change: +7 percentage points
This story originally appeared on The General and was produced and
distributed in partnership with Stacker Studio.