The most dangerous cities to drive in America
Bilanol // Shutterstock
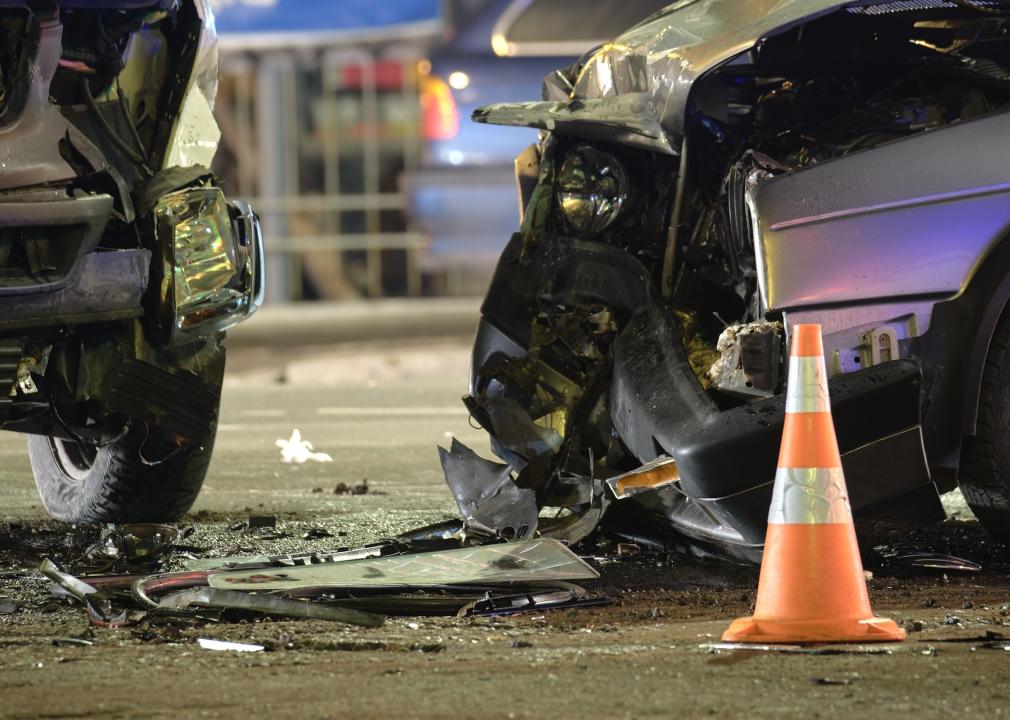
The most dangerous cities to drive in America
Two crashed cars and an orange traffic cone on a city street at night.
More than 42,000 Americans died in car crashes in 2022, making these accidents a leading cause of death in the U.S.
These deaths occurred during over 39,000 crashes that year—about one crash per 10,000 U.S. residents, according to National Highway Traffic Safety Administration tallies. But in some cities, the roads are even more deadly.
Truck Parking Club used data from the National Highway Traffic Safety Administration to rank the 25 cities with the highest accident rates, measured as accidents per 10,000 residents in 2022. Only cities with at least 10 fatal crashes and 20,000 residents were included in the analysis. Cities without available Census Bureau population estimates were not included.
Fatal car crash rates fell for several decades as federal and state governments adopted safety regulations for vehicle manufacturers and occupants. But rates went up in 2020 and 2021, with increases in fatalities related to alcohol and speeding. When COVID-19 restrictions decreased the number of cars on the road, many drivers adopted risky driving behaviors that have persisted even as traffic returned to normal. While fatalities decreased in 2022, they remain higher than they’ve been in over a decade.
Nearly all of the top 25 cities for fatal crashes were in the Southeast. Most were smaller cities: Over half had populations of fewer than 50,000, while only three had more than 100,000 residents. They also tended to be far from major cities. Geographic hazards exist in most, including hilly terrain, winding rivers, and dense forests. Nearly all have some type of waterfront—rivers, lakes, coasts, and the like—which are likely to pose distractions for drivers taking in the view.
About half of the deadliest cities ranked here are in Georgia—nearly half of which sit within the Atlanta metro area. Though these may be considered suburbs of Atlanta, most are far from the city’s downtown. Few are serviced by Atlanta’s public transit systems, meaning anyone commuting to the city will almost certainly drive for at least part of their trip. In addition, Atlanta ranks as one of the worst highest-populated cities to drive in, according to a 2024 Forbes analysis. These factors add to the risk of accidents.
Overall, Georgia ranks #14 in traffic fatalities per capita. Georgia Department of Transportation data suggests this is due to speeding, aggressive driving, and people not using seatbelts. Efforts are underway to minimize Georgia’s traffic deaths. The state’s transportation department received a $2.5 million grant to mitigate and decrease crashes, funding car seat distribution, crash data analysis, and education efforts for drivers over 55. Atlanta’s Emory University and Grady Health System also received $4.4 million to study crashes in the metro area and research ways to reduce crashes.
Still, Georgia isn’t the full story. There were high-ranking cities for traffic fatalities in most U.S. regions. Read on to learn where.
![]()
Jacob Boomsma // Shutterstock
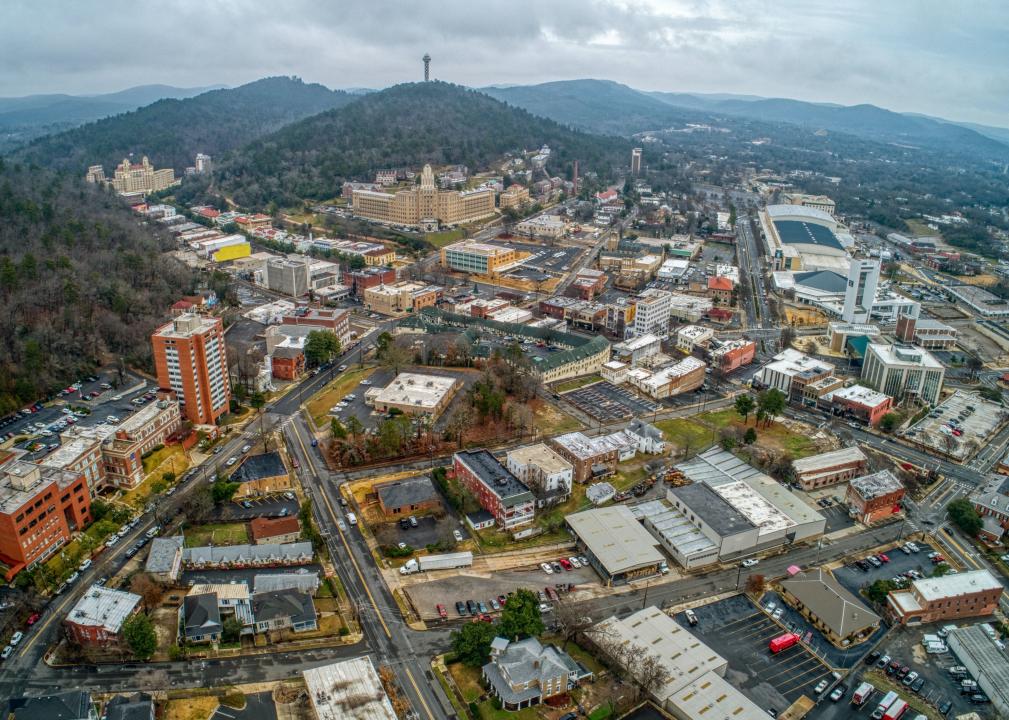
#25. Hot Springs, Arkansas
Aerial view of Downtown Hot Springs.
– Fatal accidents per 10,000 residents: 2.6 (2.2x the national average)
– Total fatal accidents: 10 (11 fatalities)
– Most common crash site: U.S. highways (5 fatal accidents)
Kristi Blokhin // Shutterstock
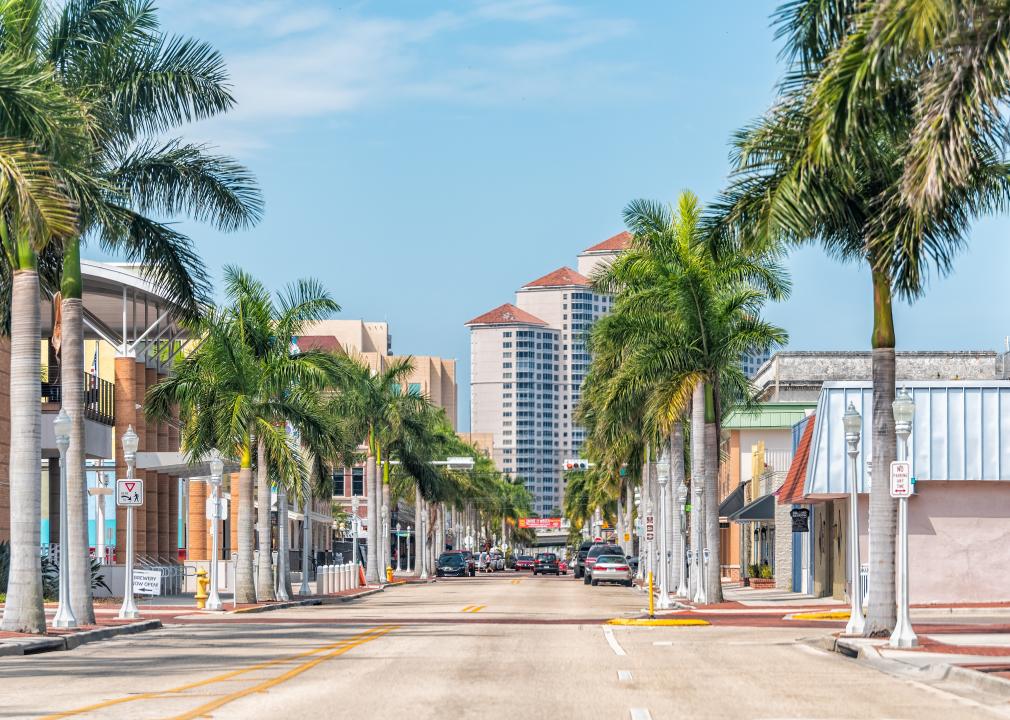
#24. Fort Myers, Florida
A Fort Myers city street lined with palm trees on a sunny day.
– Fatal accidents per 10,000 residents: 2.7 (2.3x the national average)
– Total fatal accidents: 26 (29 fatalities)
– Most common crash site: State highways (11 fatal accidents)
JHVEPhoto // Shutterstock
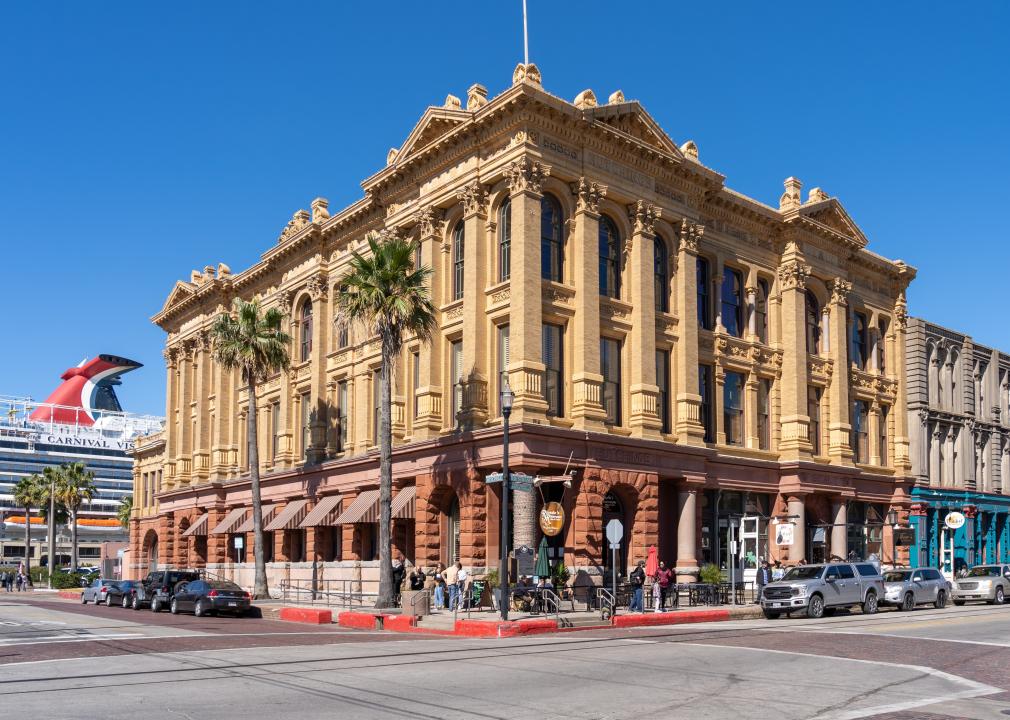
#23. Galveston, Texas
Strand Historic District with a docked Carnival cruise ship in the background.
– Fatal accidents per 10,000 residents: 2.8 (2.4x the national average)
– Total fatal accidents: 15 (19 fatalities)
– Most common crash site: Local city streets (7 fatal accidents)
airwayphoto // Shutterstock
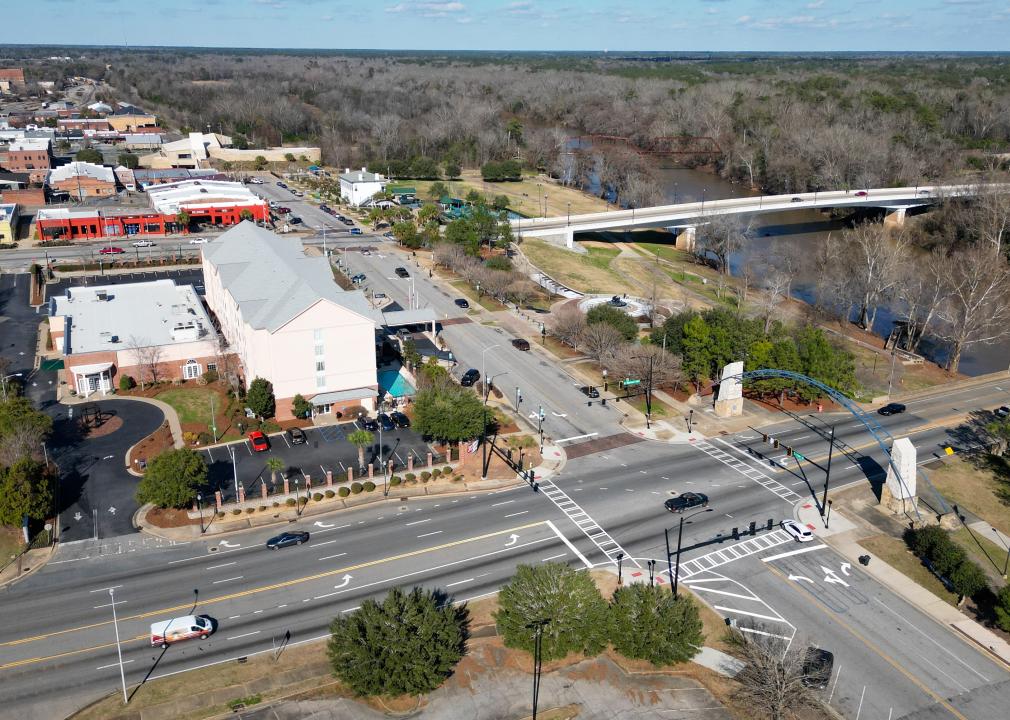
#22. Albany, Georgia
Aerial shot of downtown Albany.
– Fatal accidents per 10,000 residents: 2.8 (2.4x the national average)
– Total fatal accidents: 19 (19 fatalities)
– Most common crash site: State highways (8 fatal accidents)
Todamo // Shutterstock
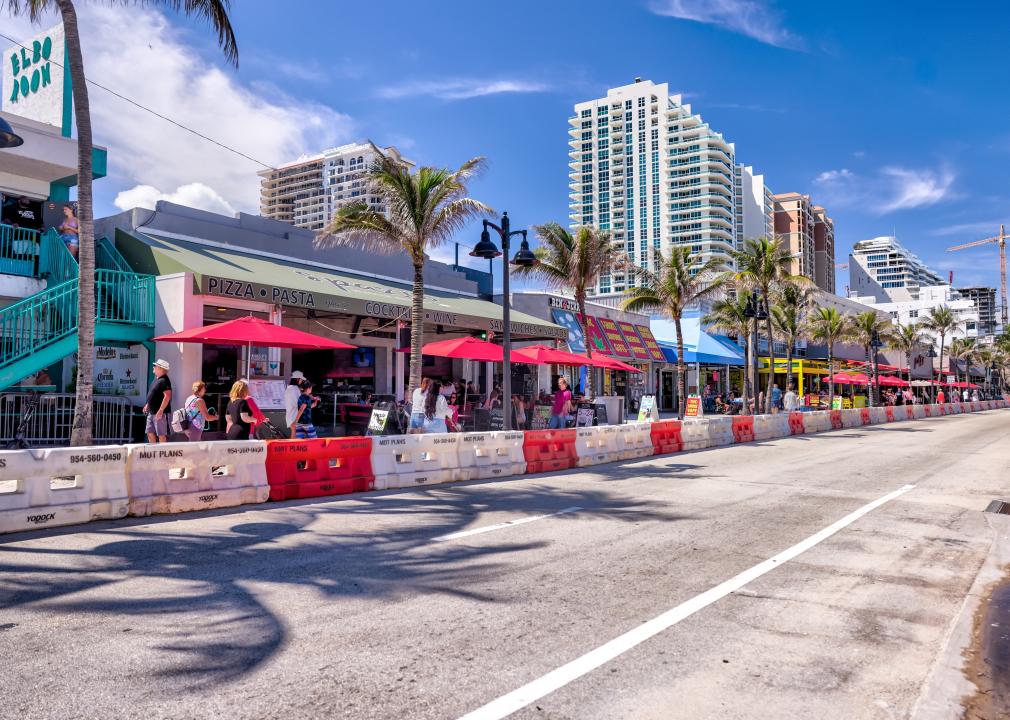
#21. Fort Lauderdale, Florida
Views along Beachfront Avenue in Fort Lauderdale.
– Fatal accidents per 10,000 residents: 2.9 (2.5x the national average)
– Total fatal accidents: 53 (54 fatalities)
– Most common crash site: U.S. highways (15 fatal accidents)
Sean Pavone // Shutterstock
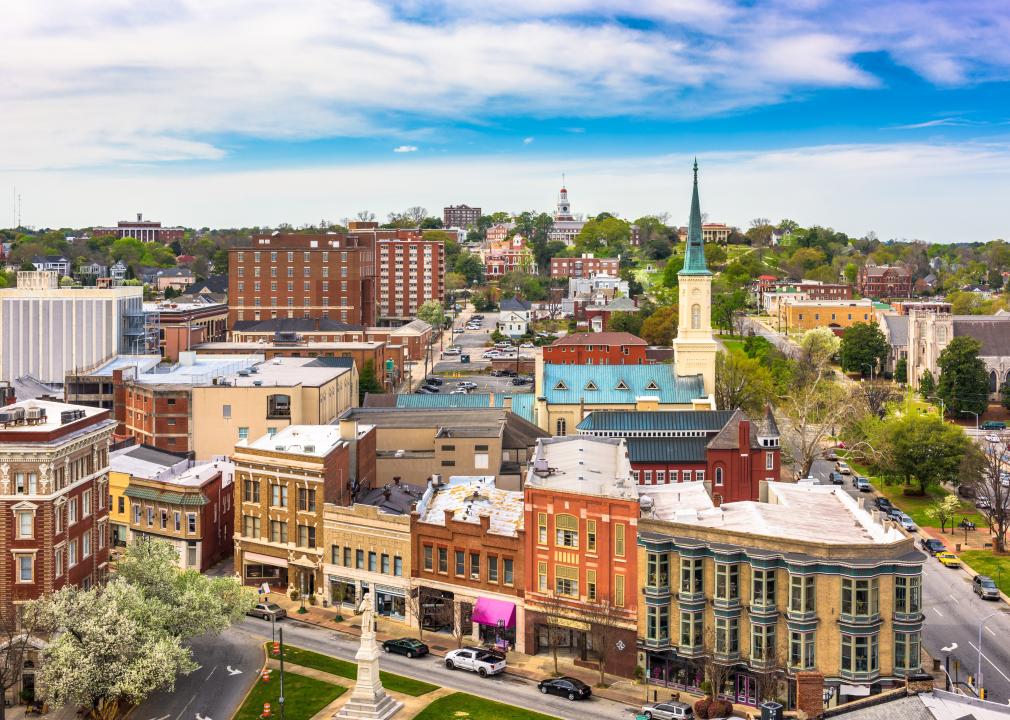
#20. Macon, Georgia
Macon, Georgia, downtown cityscape from a high angle.
– Fatal accidents per 10,000 residents: 2.9 (2.5x the national average)
– Total fatal accidents: 46 (51 fatalities)
– Most common crash site: State highways (21 fatal accidents)
Sunshower Shots // Shutterstock
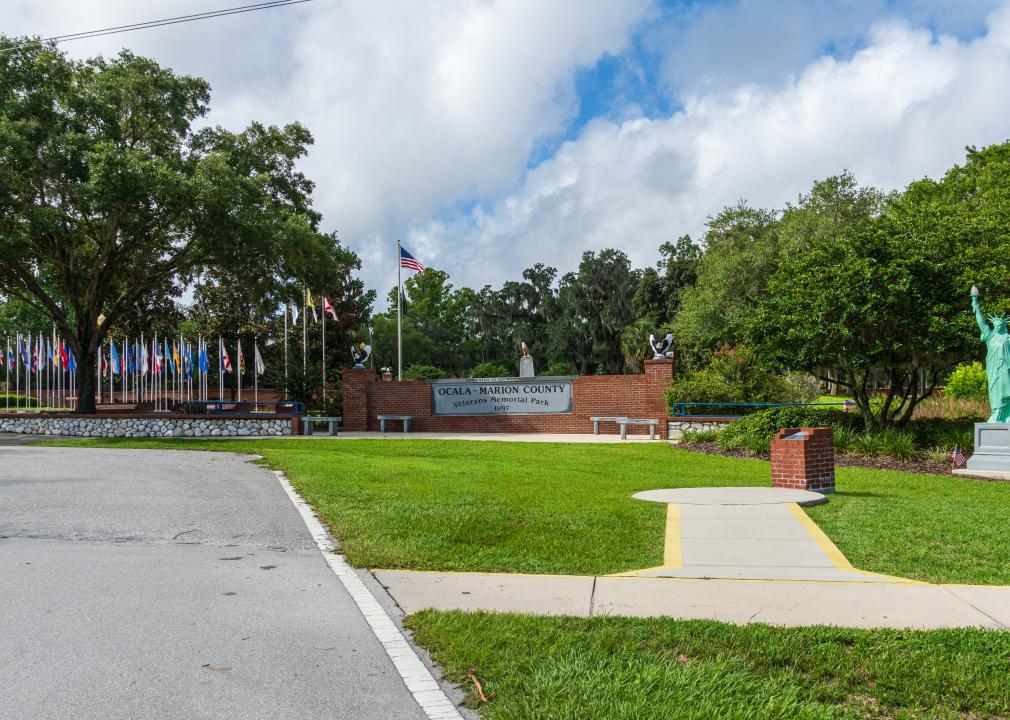
#19. Ocala, Florida
Ocala Marion County Veteran’s Memorial Park.
– Fatal accidents per 10,000 residents: 3.1 (2.6x the national average)
– Total fatal accidents: 20 (20 fatalities)
– Most common crash site: State highways (6 fatal accidents)
Sabrina Janelle Gordon // Shutterstock
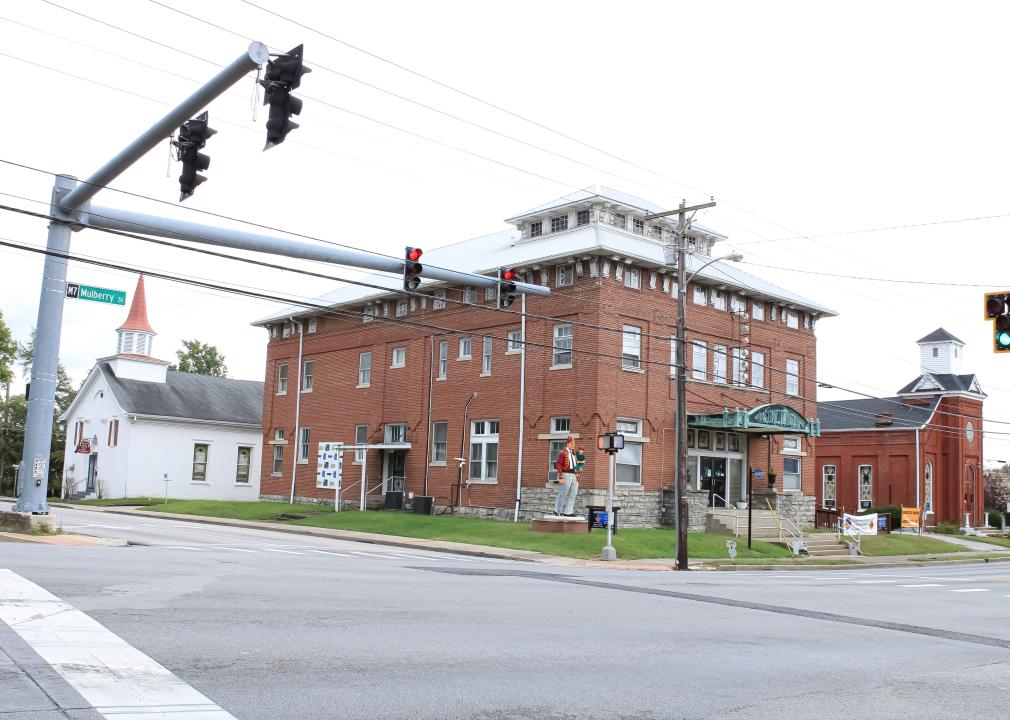
#18. Elizabethtown, Kentucky
Elizabethtown historic masonic temple building in the townscape.
– Fatal accidents per 10,000 residents: 3.1 (2.7x the national average)
– Total fatal accidents: 10 (10 fatalities)
– Most common crash site: U.S. highways (4 fatal accidents)
Sabrina Janelle Gordon // Shutterstock
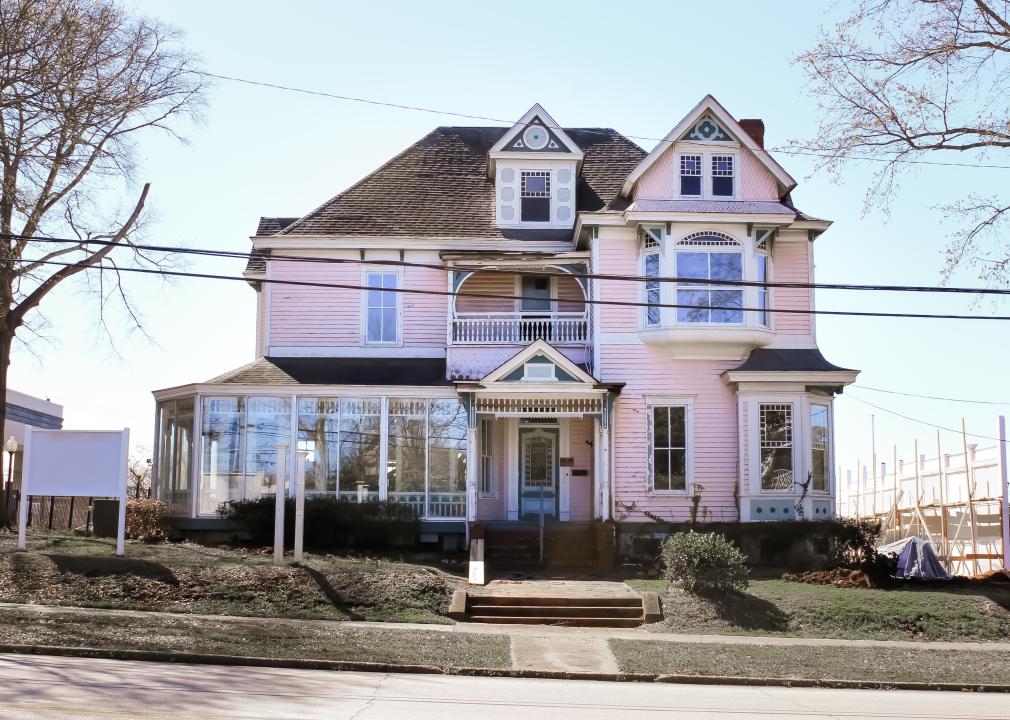
#17. LaGrange, Georgia
La Grange historic mansion on a sunny morning.
– Fatal accidents per 10,000 residents: 3.1 (2.7x the national average)
– Total fatal accidents: 10 (12 fatalities)
– Most common crash site: State highways (5 fatal accidents)
RodClementPhotography // Shutterstock
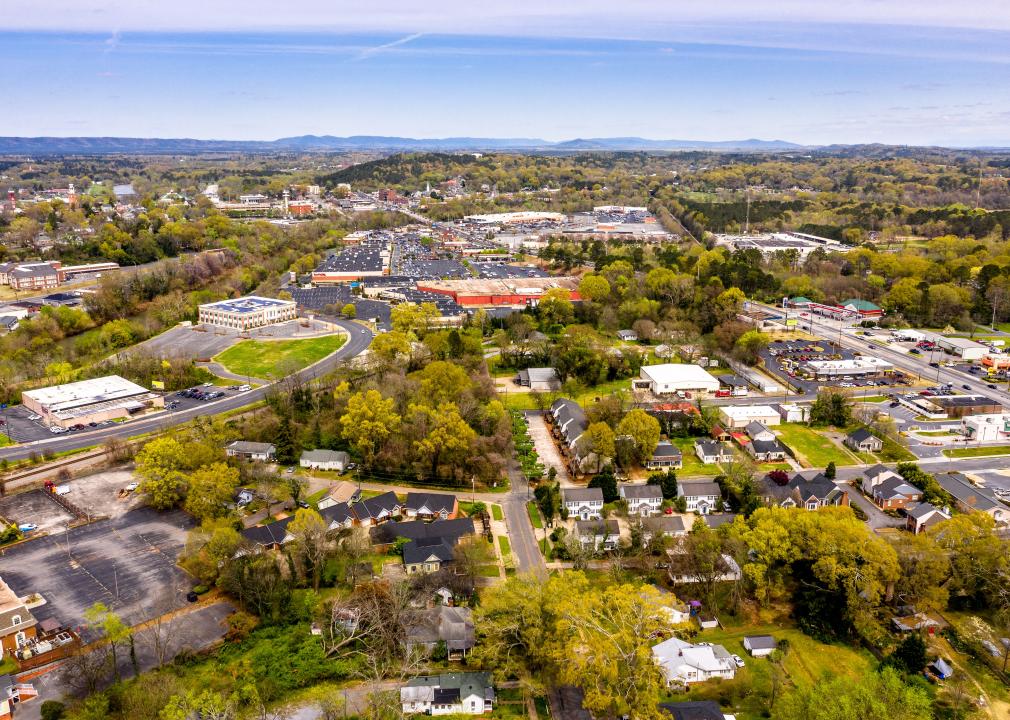
#16. Rome, Georgia
Aerial view of city of Rome, Georgia.
– Fatal accidents per 10,000 residents: 3.2 (2.7x the national average)
– Total fatal accidents: 12 (12 fatalities)
– Most common crash site: State highways (7 fatal accidents)
Dee Browning // Shutterstock
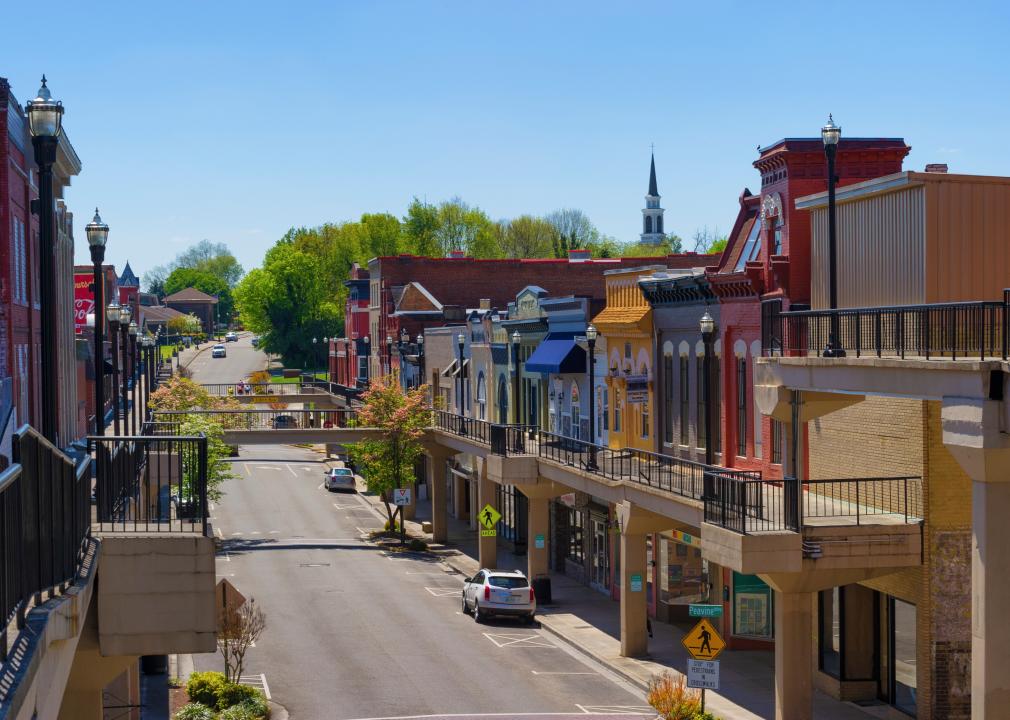
#15. Morristown, Tennessee
A quiet Morristown historical district street.
– Fatal accidents per 10,000 residents: 3.2 (2.7x the national average)
– Total fatal accidents: 10 (10 fatalities)
– Most common crash site: U.S. highways (4 fatal accidents)
Nick Fox // Shutterstock
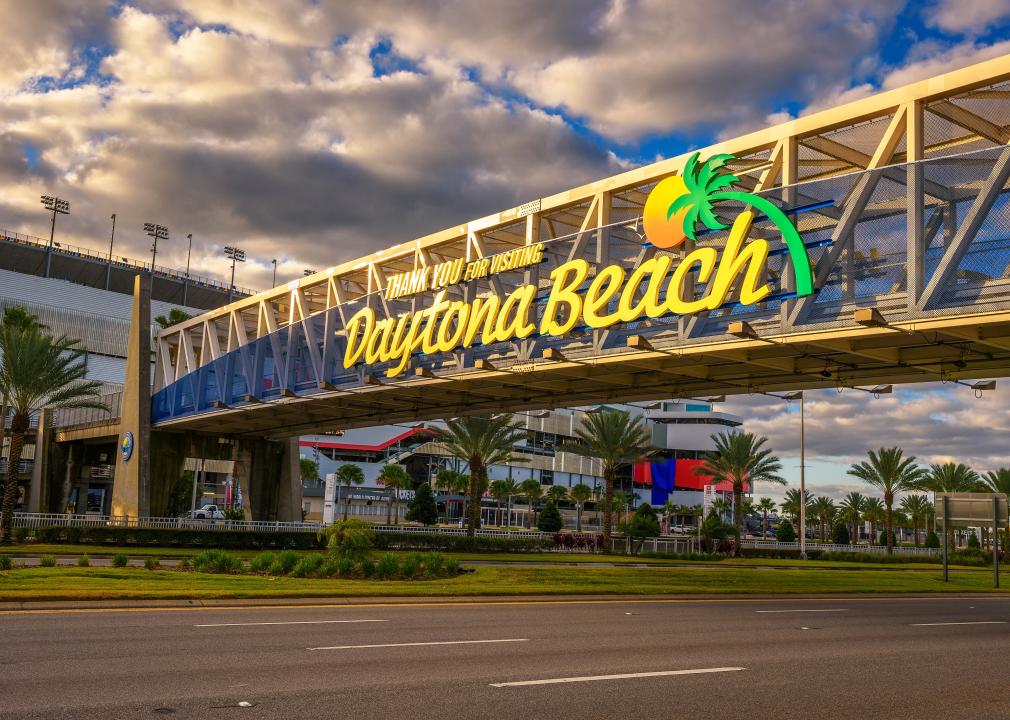
#14. Daytona Beach, Florida
A sign on an elevated catwalk going over a street that reads, Thank you for visiting Daytona Beach.
– Fatal accidents per 10,000 residents: 3.2 (2.7x the national average)
– Total fatal accidents: 25 (25 fatalities)
– Most common crash site: Local city streets (10 fatal accidents)
Jacob Boomsma // Shutterstock
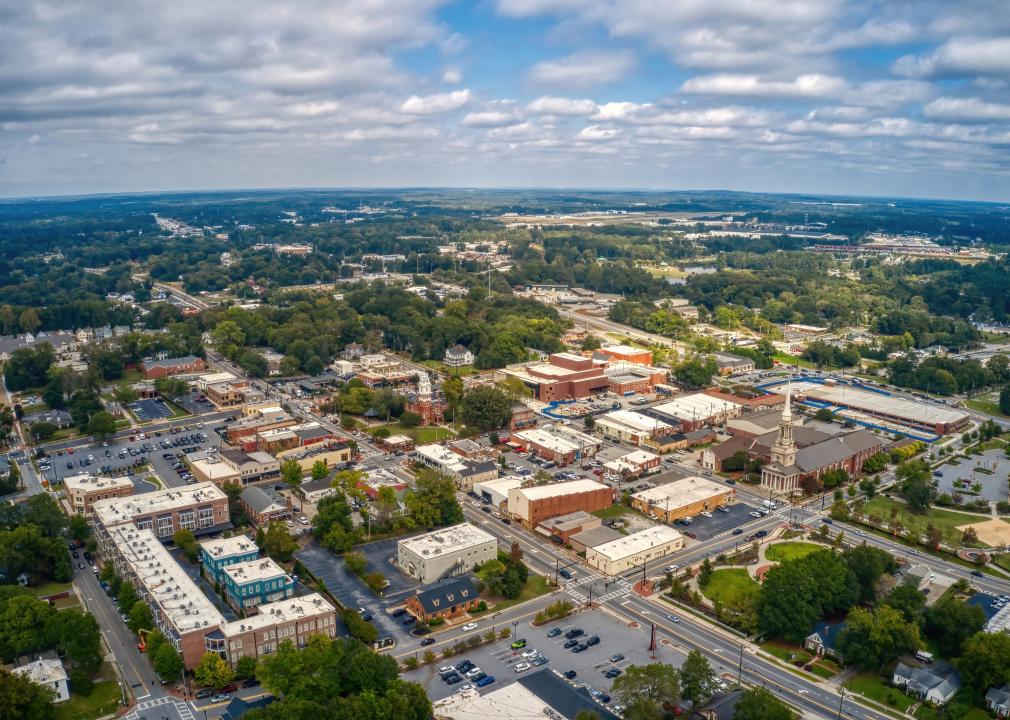
#13. Lawrenceville, Georgia
Aerial view of the Atlanta Outer Ring suburb of Lawrenceville, Georgia.
– Fatal accidents per 10,000 residents: 3.3 (2.8x the national average)
– Total fatal accidents: 10 (10 fatalities)
– Most common crash site: State highways (4 fatal accidents)
Steve Heap // Shutterstock
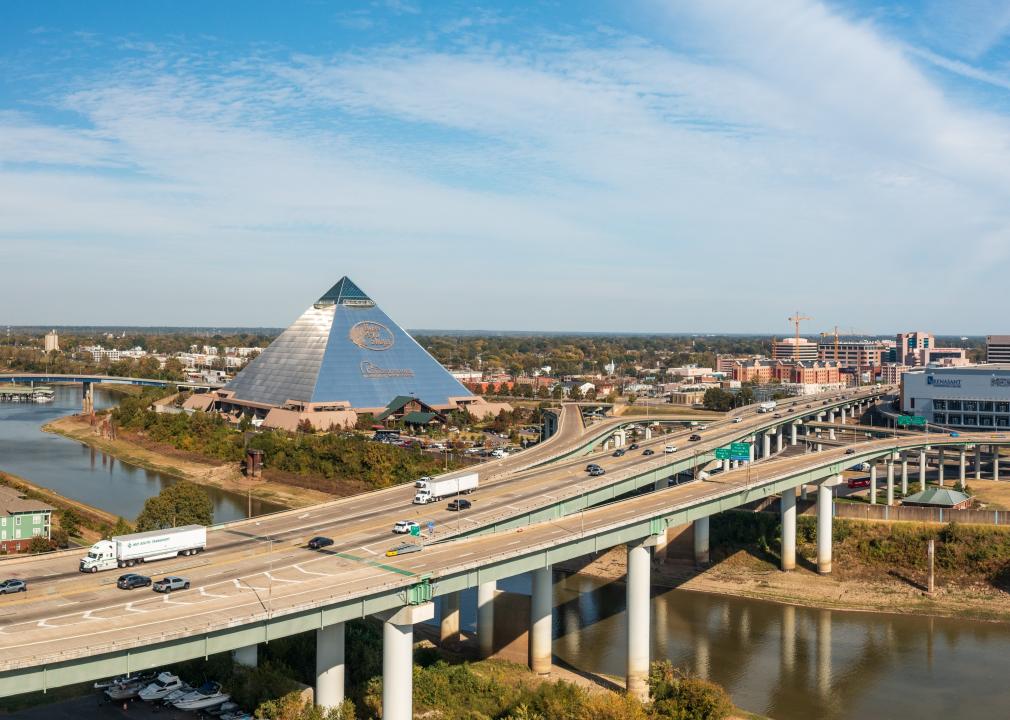
#12. Memphis, Tennessee
Panoramic view of Memphis, Tennessee, with the elevated Hernando de Soto bridge over the Mississippi River.
– Fatal accidents per 10,000 residents: 3.3 (2.8x the national average)
– Total fatal accidents: 207 (228 fatalities)
– Most common crash site: Local city streets (111 fatal accidents)
Jacob Boomsma // Shutterstock
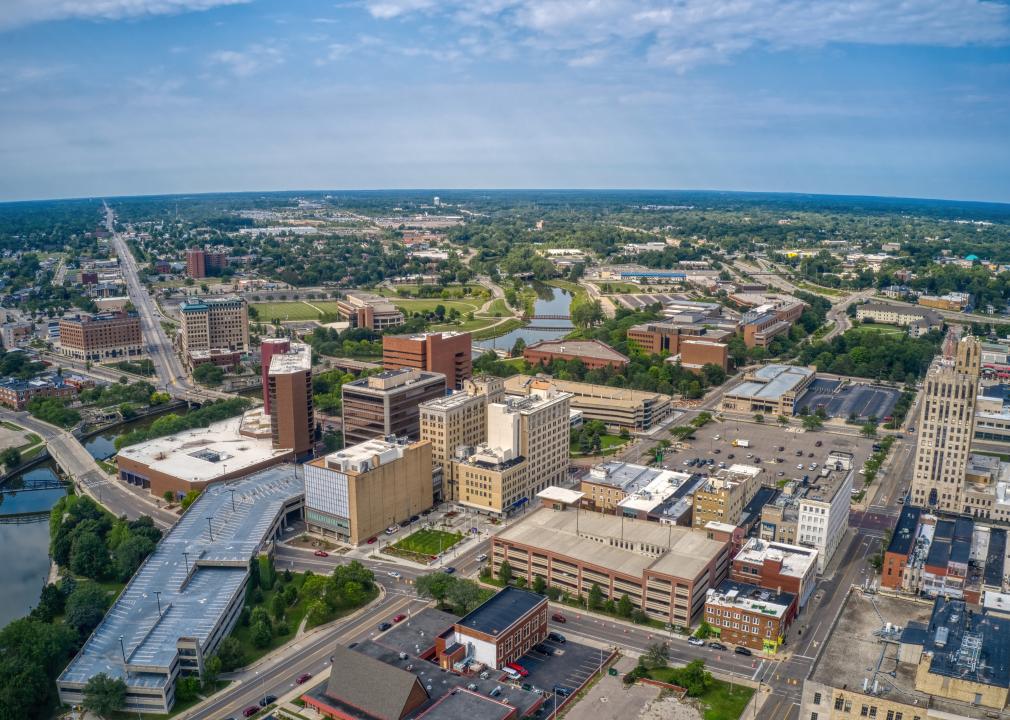
#11. Flint, Michigan
Aerial view of Downtown Flint, Michigan, in summer.
– Fatal accidents per 10,000 residents: 3.5 (3.0x the national average)
– Total fatal accidents: 28 (28 fatalities)
– Most common crash site: Local city streets (24 fatal accidents)
Christophe KLEBERT // Shutterstock
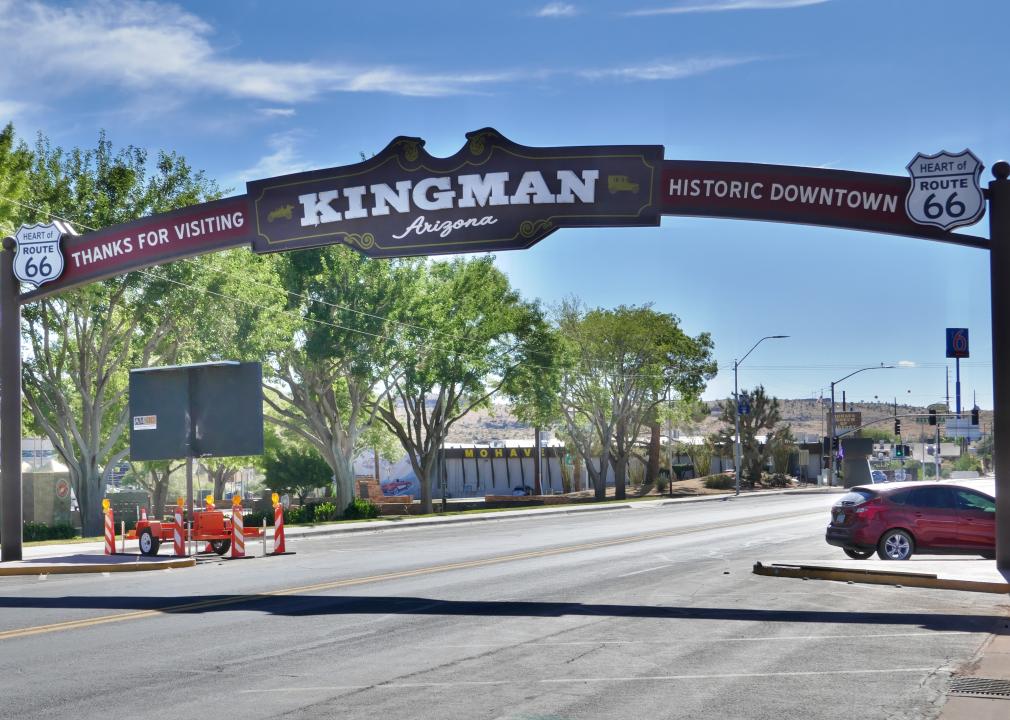
#10. Kingman, Arizona
A sign over a street that reads, thanks for visiting Kingman, Arizona, Historic Downtown, with a Heart of Route 66 emblem.
– Fatal accidents per 10,000 residents: 3.7 (3.2x the national average)
– Total fatal accidents: 13 (16 fatalities)
– Most common crash site: State highways (3 fatal accidents)
Christopher V Jones // Shutterstock
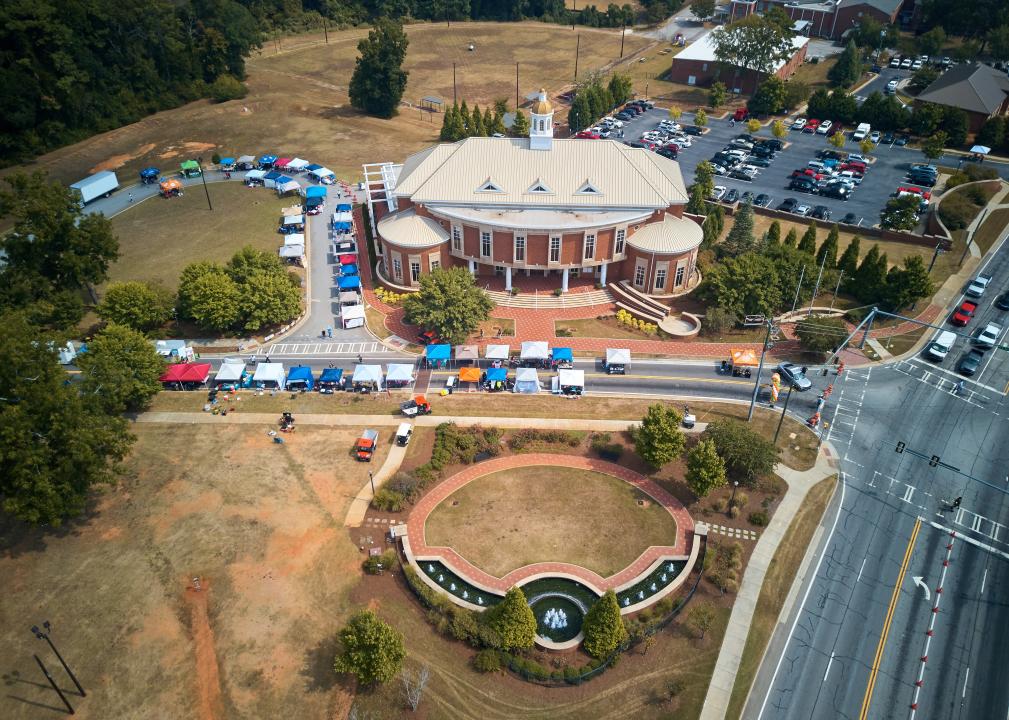
#9. Stockbridge, Georgia
An aerial view of an event with canopy tents set up in Stockbridge, Georgia.
– Fatal accidents per 10,000 residents: 3.9 (3.3x the national average)
– Total fatal accidents: 14 (14 fatalities)
– Most common crash site: Interstates (5 fatal accidents)
EQRoy // Shutterstock
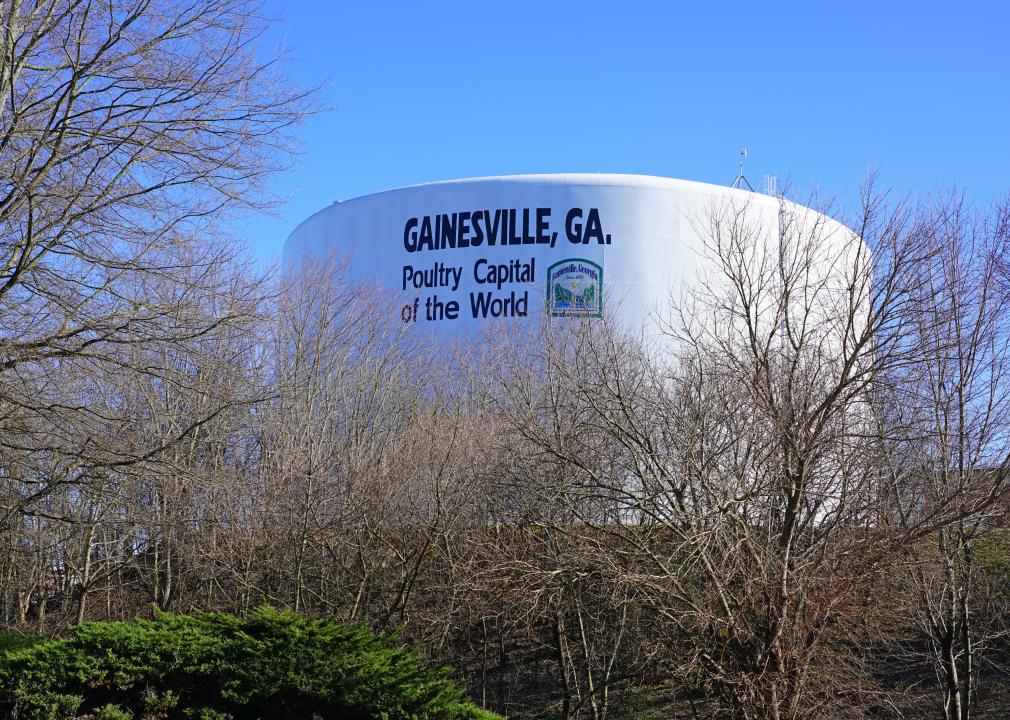
#8. Gainesville, Georgia
A large water tank that reads, Gainesville, Georgia, poultry capital of the world.
– Fatal accidents per 10,000 residents: 4.0 (3.4x the national average)
– Total fatal accidents: 18 (19 fatalities)
– Most common crash site: State highways (14 fatal accidents)
Georges_Creations // Shutterstock
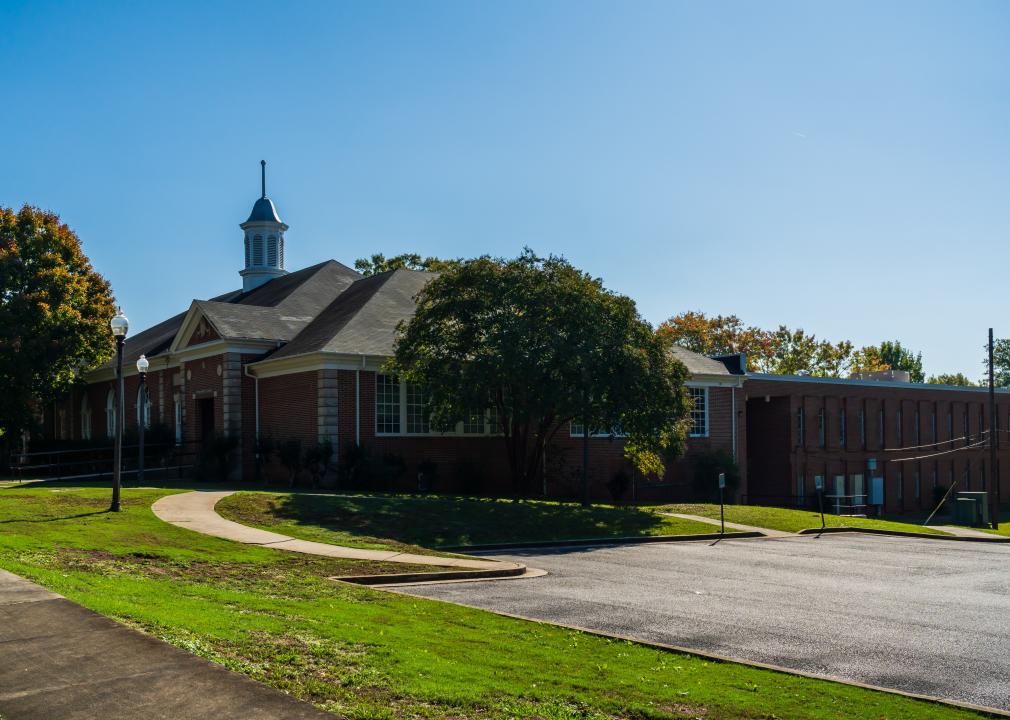
#7. Griffin, Georgia
The old third ward school in Griffin, Georgia.
– Fatal accidents per 10,000 residents: 4.2 (3.6x the national average)
– Total fatal accidents: 10 (10 fatalities)
– Most common crash site: State highways (7 fatal accidents)
Lee Reese // Shutterstock
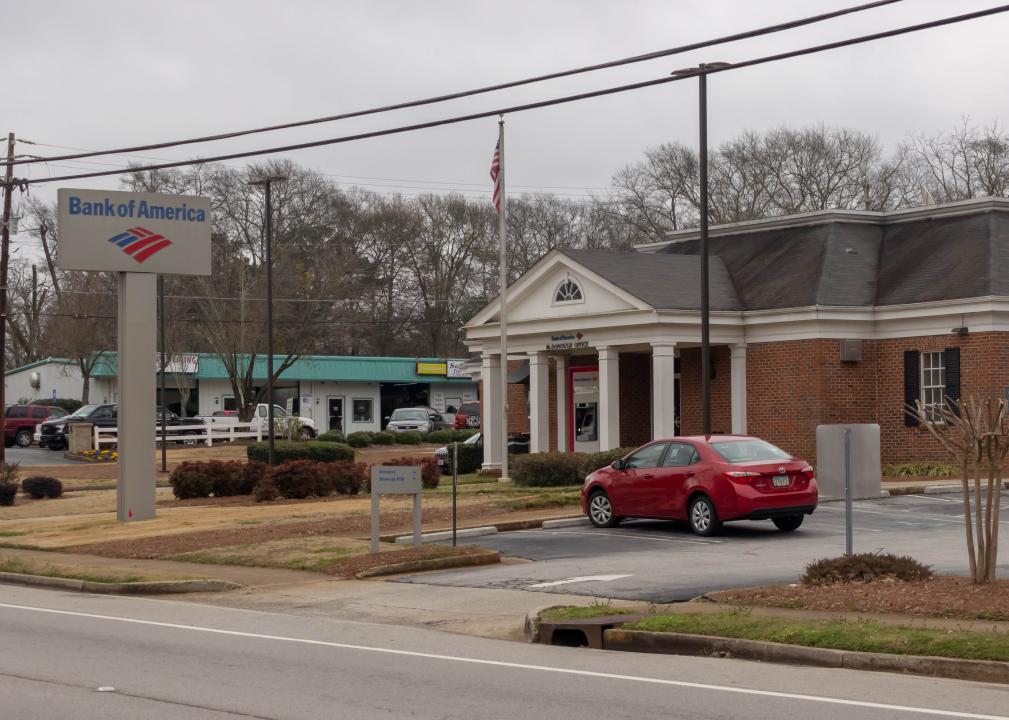
#6. Mcdonough, Georgia
A view of the front of a Bank of America building.
– Fatal accidents per 10,000 residents: 4.3 (3.6x the national average)
– Total fatal accidents: 13 (16 fatalities)
– Most common crash site: Local township streets (3 fatal accidents)
Jacob Boomsma // Shutterstock
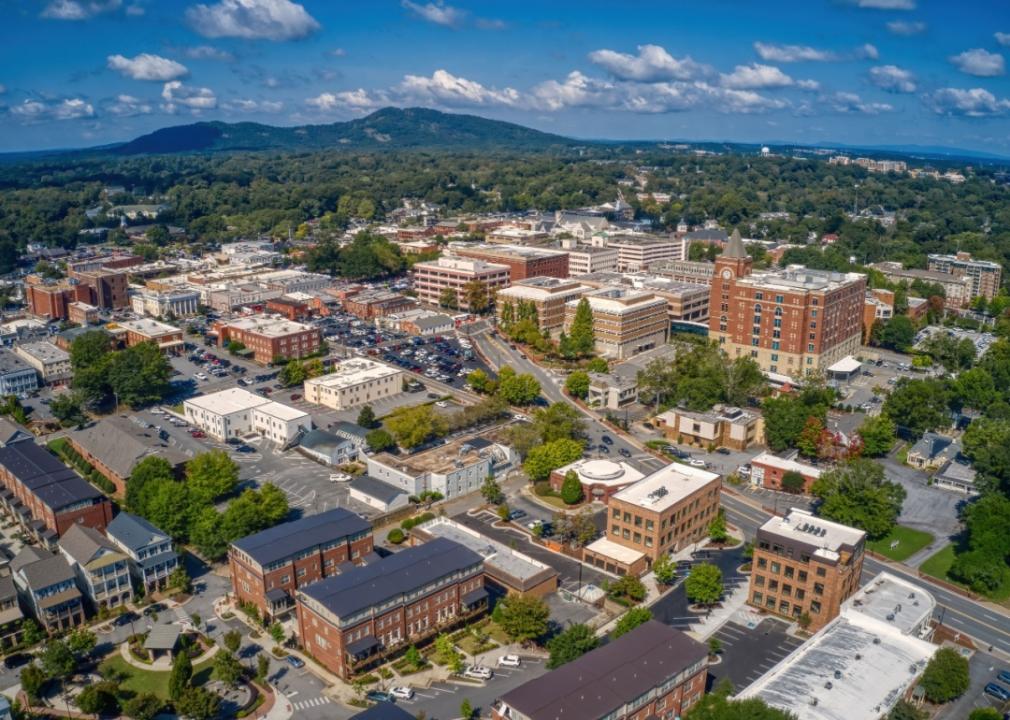
#5. Marietta, Georgia
Aerial view of the Atlanta suburb of Marietta, Georgia.
– Fatal accidents per 10,000 residents: 4.6 (3.9x the national average)
– Total fatal accidents: 29 (29 fatalities)
– Most common crash site: State highways (7 fatal accidents)

Marcus E Jones // Shutterstock
#4. Decatur, Georgia
An aerial view of Decatur Square in Decatur, Georgia, during fall.
– Fatal accidents per 10,000 residents: 4.9 (4.2x the national average)
– Total fatal accidents: 12 (14 fatalities)
– Most common crash site: County roads (6 fatal accidents)
GagliardiPhotography // Shutterstock
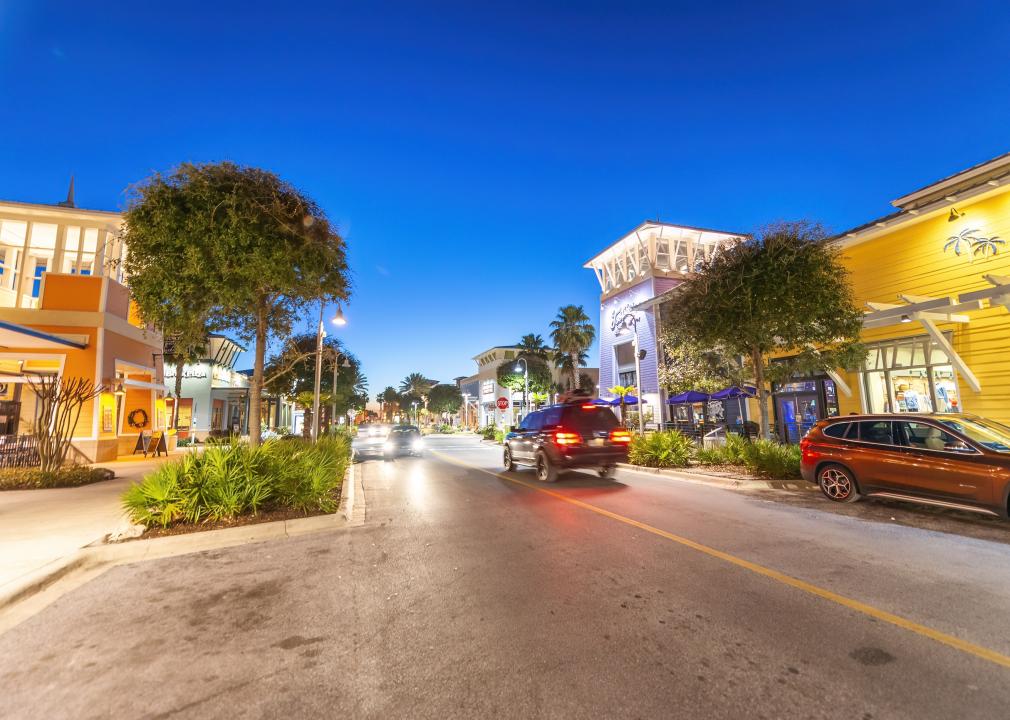
#3. Panama City, Florida
Port Lagoon streets and buildings at night.
– Fatal accidents per 10,000 residents: 5.2 (4.4x the national average)
– Total fatal accidents: 18 (19 fatalities)
– Most common crash site: U.S. highways (7 fatal accidents)
RodClementPhotography // Shutterstock
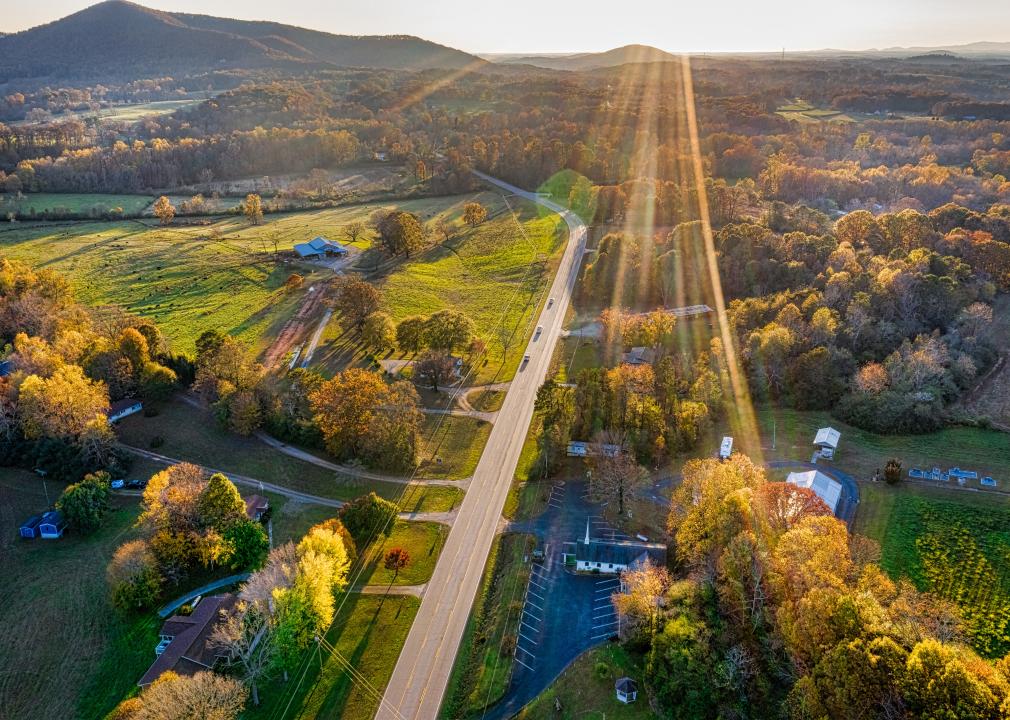
#2. Cartersville, Georgia
Aerial shot of a rural road in Georgia.
– Fatal accidents per 10,000 residents: 5.9 (5.0x the national average)
– Total fatal accidents: 14 (15 fatalities)
– Most common crash site: State highways (8 fatal accidents)

Alexandr Junek Imaging // Shutterstock
#1. Hempstead, New York
Aerial view of the Long Island’s south coast.
– Fatal accidents per 10,000 residents: 6.0 (5.1x the national average)
– Total fatal accidents: 35 (35 fatalities)
– Most common crash site: State highways (18 fatal accidents)
Story editing by Carren Jao. Additional editing by Kelly Glass. Copy editing by Kristen Wegrzyn. Photo selection by Clarese Moller.
This story originally appeared on Truck Parking Club and was produced and
distributed in partnership with Stacker Studio.
