The decline of pay phones in every state
Bettmann // Getty Images
The decline of pay phones in every state
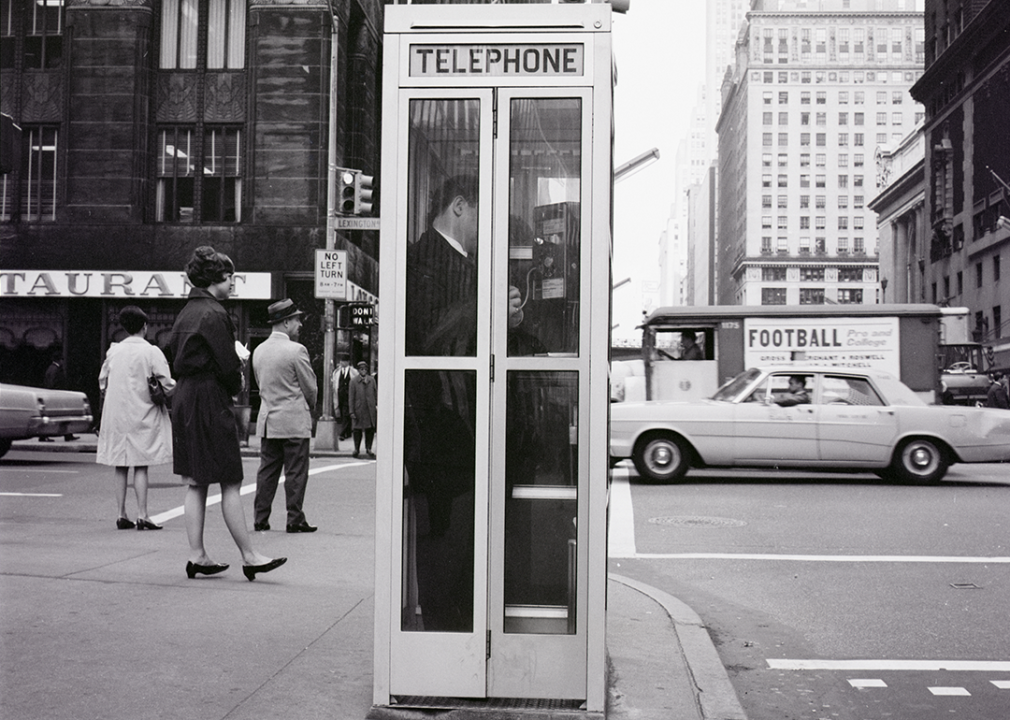
A vintage black and white photo of a telephone booth at 42nd Street and Lexington Avenue in New York City.
There were over 2.1 million pay phones in the U.S. at their peak in 1999, but now the technology is mostly relegated to nostalgia. Few wall-mounted pay phones linger in strip malls, and the silver and blue phone booths are mostly gone from the busy streets they once dotted in many parts of the U.S. Pay phones have become so rare that the FCC stopped requiring audits of them in 2018.
Spokeo used data from the Federal Communications Commission to explore the fall of pay phones across the United States. States are ranked by the percentage decline in the number of pay phones between 2000 and 2016. For ties, the number of pay phones remaining in the state was next used to rank.
Though no longer updated, the available data paints a picture of the pay phone’s sharp decline.
The disappearance of this once-ubiquitous technology makes sense. According to the Pew Research Center, about 97% of U.S. adults own a cellphone today, most of whom specifically own smartphones.
Pay phones can be especially useful in areas where cell service falls short. These include national parks, certain hospitals, and around the U.S. border. Pay phone connections can also hold steady when natural disasters disrupt cell service, and operators report increased usage during disasters.
Most states saw the number of pay phones decline by over 90% between 2000 and 2016, but one outlier stood out: Hawai’i. The island state saw the number of pay phones drop by about 60%. A spokesperson for Hawaiian Telcom, the leading pay phone operator in the state, told the Honolulu Civil Beat that national trends may simply be taking longer to play out.
Other telecommunications experts think tourism plays a role as international travelers visiting the state may find it cheaper to make a pay phone call than pay mobile fees for calling from the U.S. Based on International Trade Association data, and relative to its residential population, Hawai’i has the highest number of international travelers, receiving about 67 global visitors for every 100 residents in 2022.
![]()
Spokeo
A national look
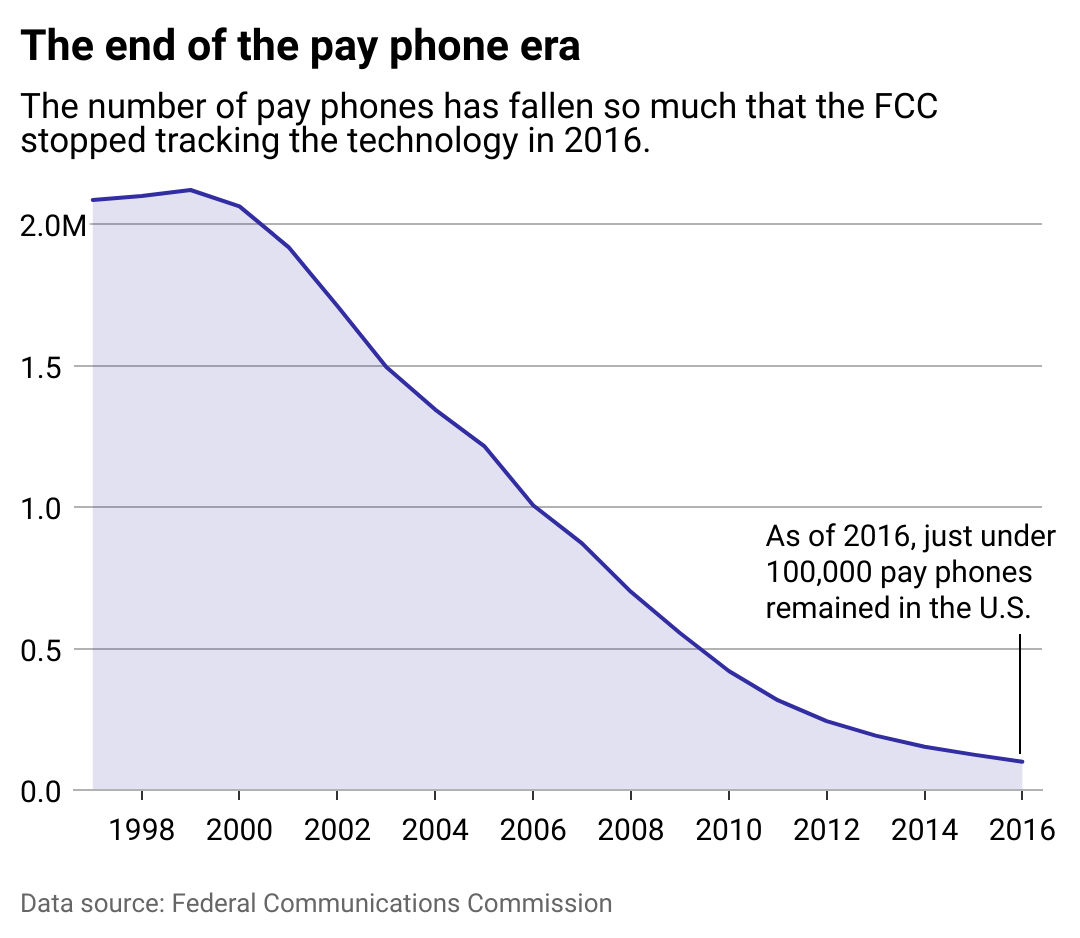
A chart showing that under 100,000 payphones remain as of 2016, declining from over 2 million in 2000.
As of 2016, under 100,000 pay phones remained in the U.S., a 95% decline from 2000, when there were over 2 million. This number has likely shrunk significantly since the FCC last collected the data.
In 2016, New York state accounted for 1 in 5 of the country’s remaining pay phones, but many have since been converted for new purposes. New York City removed its last public pay phone in 2016. While some privately operated phones remain, many of the city’s phone booths have since been transformed into Wi-Fi corners, embracing a smartphone-centered era of technology.
Read on to find out how pay phones have declined in every state and Washington D.C. during the 2000s and 2010s.
image_vulture // Shutterstock
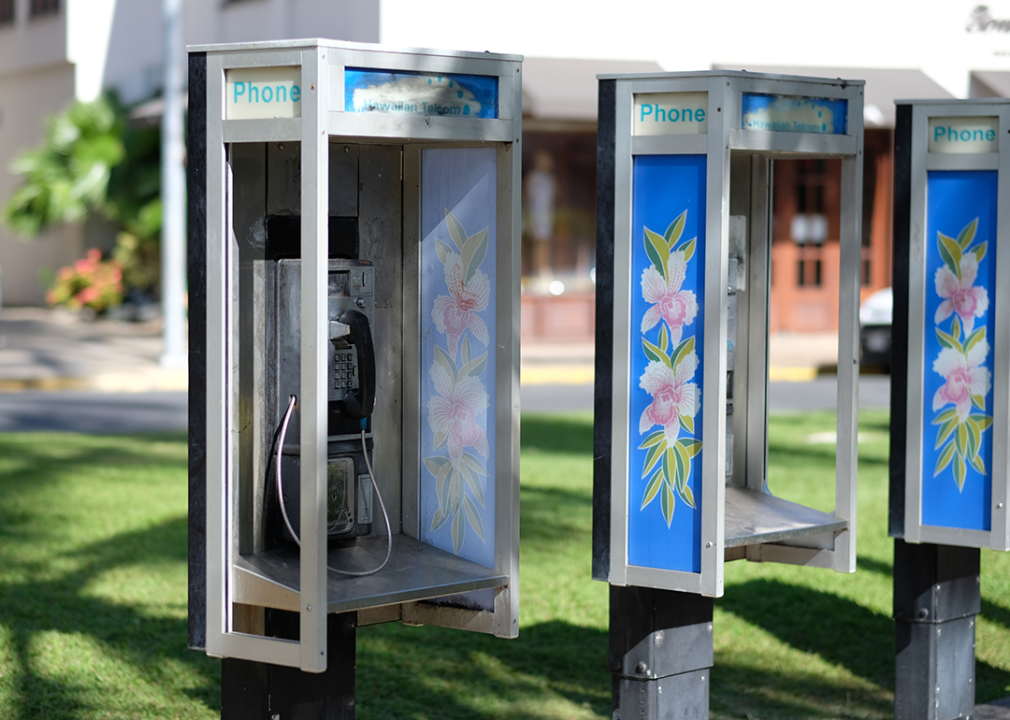
#51. Hawai’i
Public payphones in Waikiki.
– 59.6% decline in number of pay phones
– Number of pay phones remaining in 2016: 3,615 (253.2 phones per 100K people)
— Down from 8,943 in 2000 (736.9 phones per 100K people)

Sean Pavone // Shutterstock
#50. West Virginia
Charleston skyline on the Kanawha River.
– 85.7% decline in number of pay phones
– Number of pay phones remaining in 2016: 1,678 (91.6 phones per 100K people)
— Down from 11,704 in 2000 (647.7 phones per 100K people)
Little Vignettes Photo // Shutterstock
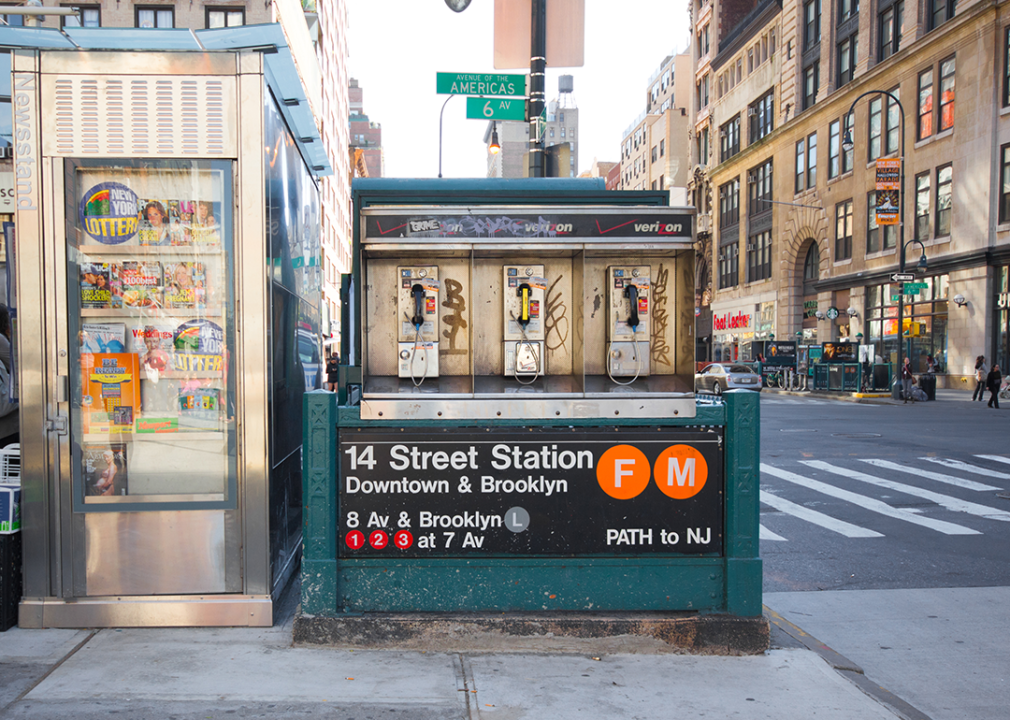
#49. New York
New York City subway station entrance at 14th Street with pay phone.
– 87.9% decline in number of pay phones
– Number of pay phones remaining in 2016: 20,716 (105.5 phones per 100K people)
— Down from 171,098 in 2000 (900.4 phones per 100K people)

Canva
#48. Nebraska
Aerial view Omaha in summer.
– 88.1% decline in number of pay phones
– Number of pay phones remaining in 2016: 1,150 (60.3 phones per 100K people)
— Down from 9,668 in 2000 (564.1 phones per 100K people)
Joseph Sohm // Shutterstock
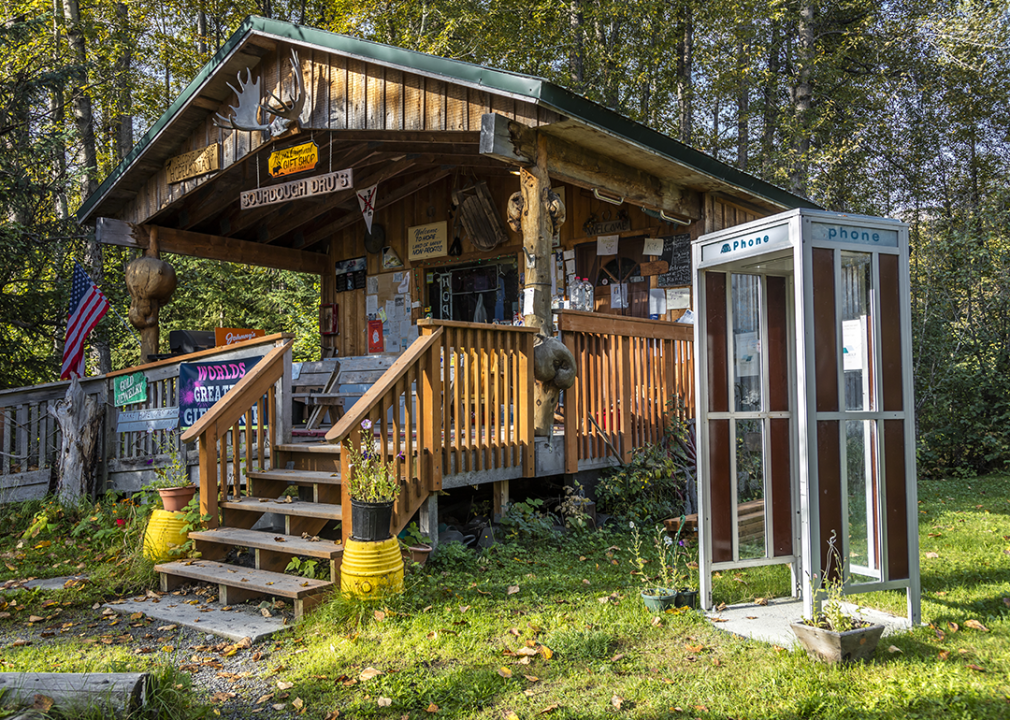
#47. Alaska
Sourdough Dru’s Alaskan cabin with telephone booth.
– 90.4% decline in number of pay phones
– Number of pay phones remaining in 2016: 440 (59.3 phones per 100K people)
— Down from 4,583 in 2000 (729.8 phones per 100K people)
Jacob Boomsma // Shutterstock
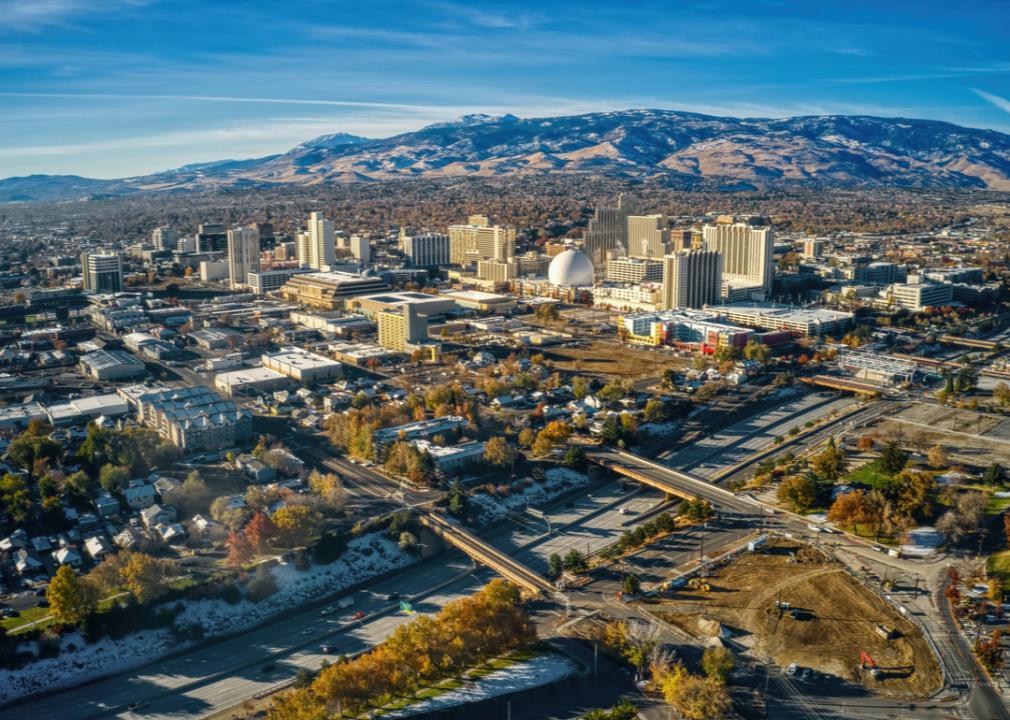
#46. Nevada
Aerial view of Reno.
– 92.9% decline in number of pay phones
– Number of pay phones remaining in 2016: 1,235 (42.3 phones per 100K people)
— Down from 17,504 in 2000 (867.1 phones per 100K people)

ESB Professional // Shutterstock
#45. Pennsylvania
Pittsburgh cityscape over the Allegheny River.
– 93.1% decline in number of pay phones
– Number of pay phones remaining in 2016: 6,224 (48.7 phones per 100K people)
— Down from 90,603 in 2000 (737.6 phones per 100K people)
Canva
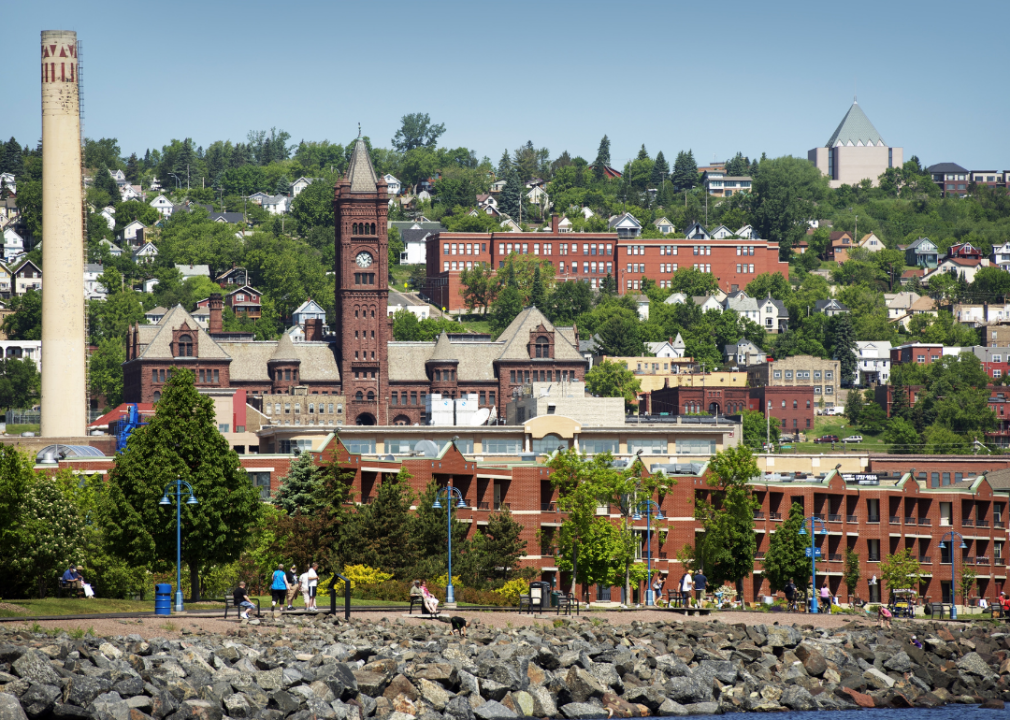
#44. Minnesota
Duluth skyline from lake.
– 93.6% decline in number of pay phones
– Number of pay phones remaining in 2016: 1,073 (19.4 phones per 100K people)
— Down from 16,831 in 2000 (341.1 phones per 100K people)
Grindstone Media Group // Shutterstock
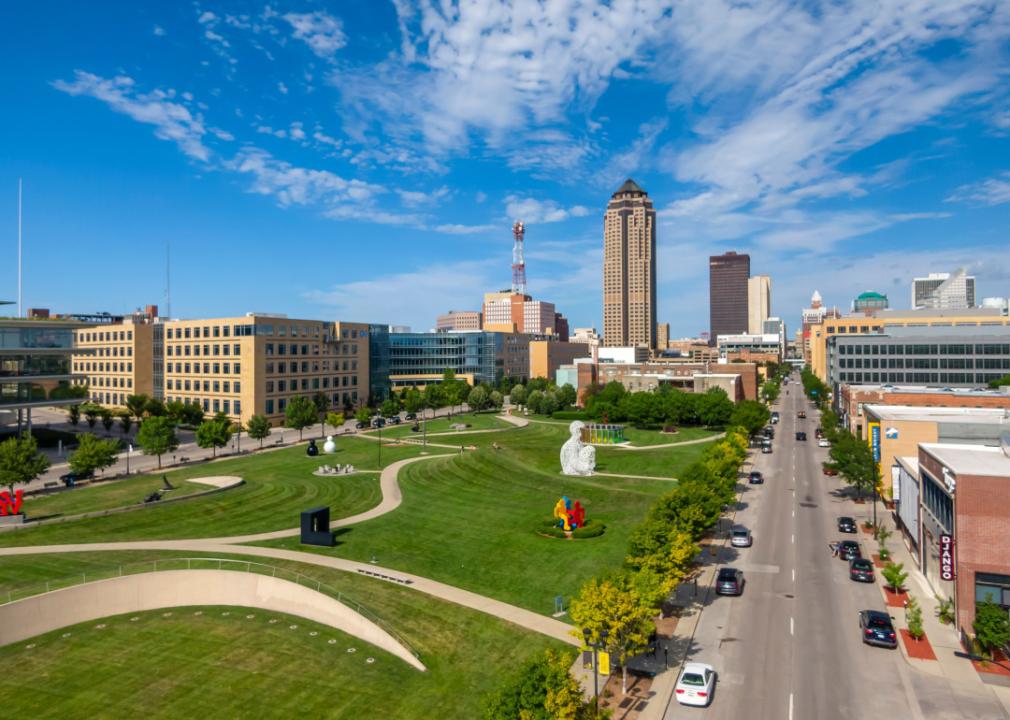
#43. Iowa
Des Moines cityscape and sculpture park.
– 93.7% decline in number of pay phones
– Number of pay phones remaining in 2016: 700 (22.4 phones per 100K people)
— Down from 11,183 in 2000 (381.8 phones per 100K people)
Helga_foto // Shutterstock
#42. California
Phone booth at a stop in the Mojave desert.
– 93.8% decline in number of pay phones
– Number of pay phones remaining in 2016: 16,683 (42.6 phones per 100K people)
— Down from 267,956 in 2000 (788.4 phones per 100K people)
JWCohen // Shutterstock
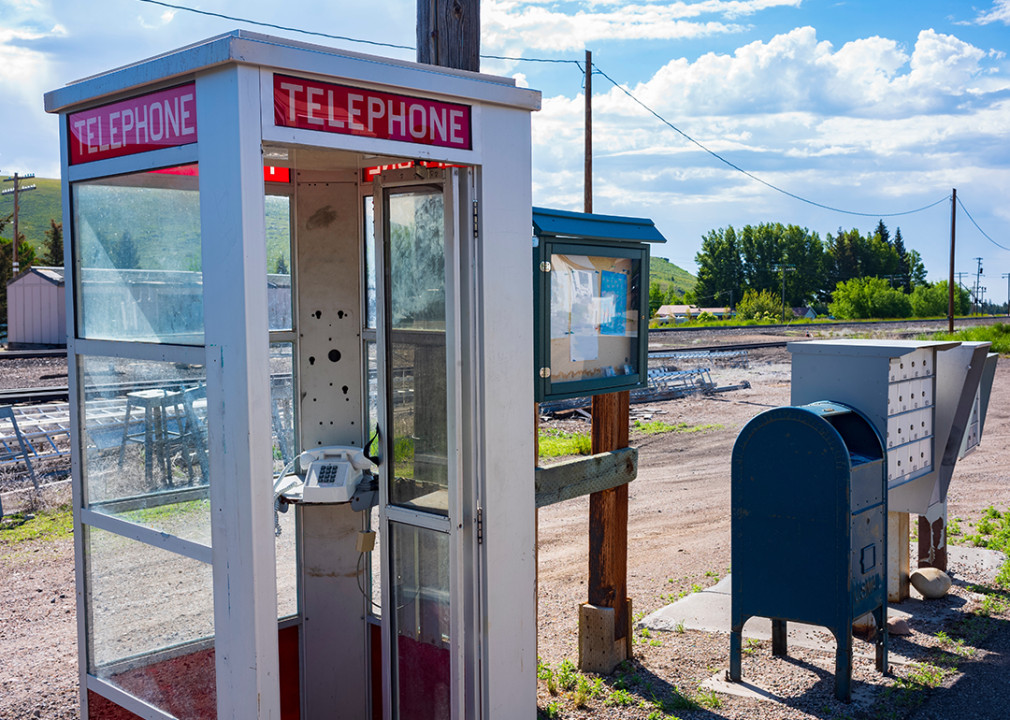
#41. Idaho
Rural telephone along railroad tracks on sunny day.
– 93.9% decline in number of pay phones
– Number of pay phones remaining in 2016: 418 (24.8 phones per 100K people)
— Down from 6,854 in 2000 (527.5 phones per 100K people)

Erika J Mitchell // Shutterstock
#40. Vermont
Burlington waterfront.
– 94.6% decline in number of pay phones
– Number of pay phones remaining in 2016: 204 (32.7 phones per 100K people)
— Down from 3,761 in 2000 (616.9 phones per 100K people)

C Model // Shutterstock
#39. Wyoming
City of Jackson Hole and surrounding landscape.
– 94.8% decline in number of pay phones
– Number of pay phones remaining in 2016: 201 (34.4 phones per 100K people)
— Down from 3,868 in 2000 (782.5 phones per 100K people)
Gian Sapienza Photography // Shutterstock
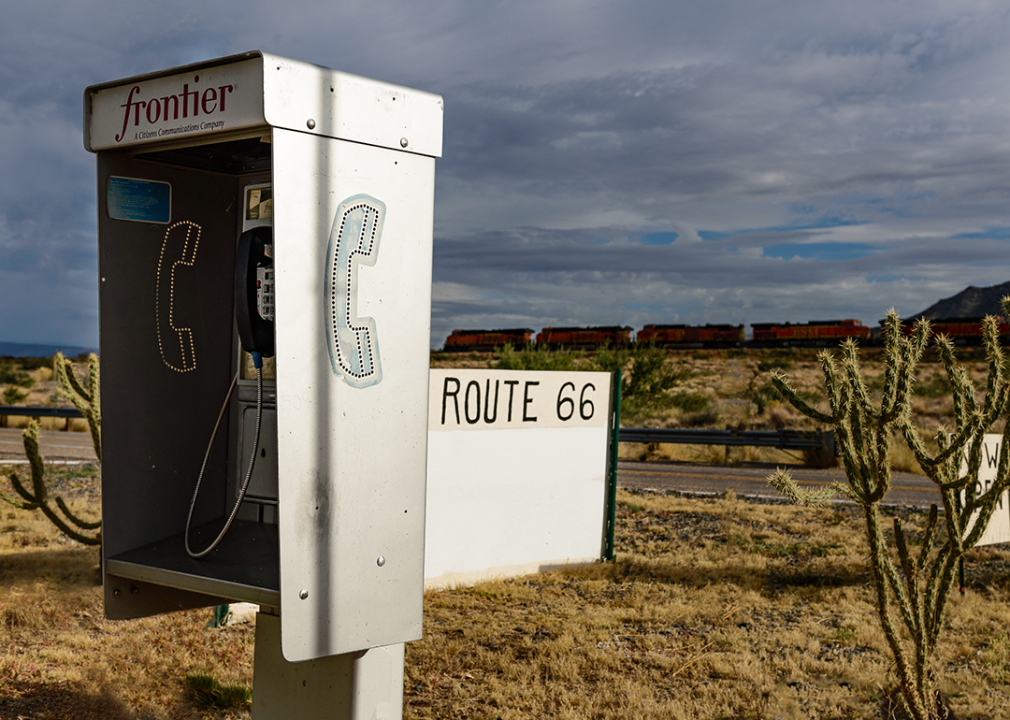
#38. Arizona
Payphone on Route 66 in desert.
– 94.9% decline in number of pay phones
– Number of pay phones remaining in 2016: 1,695 (24.4 phones per 100K people)
— Down from 33,363 in 2000 (646.5 phones per 100K people)
Yinspire // Shutterstock
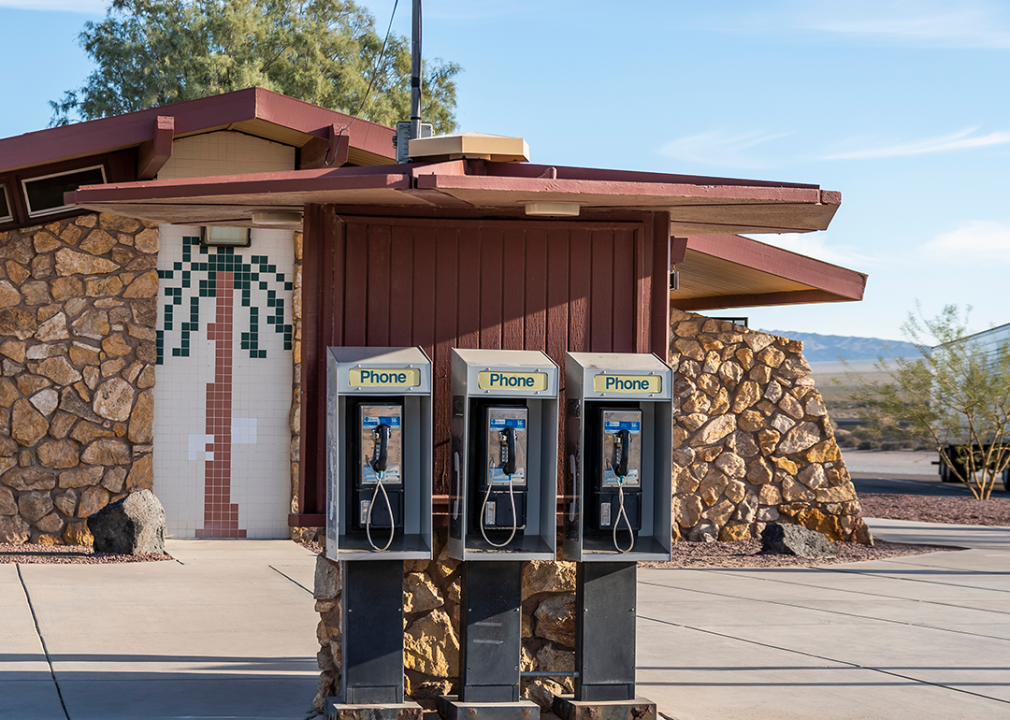
#37. Washington
Abandoned payphone in Olympic National Park.
– 95% decline in number of pay phones
– Number of pay phones remaining in 2016: 1,730 (23.7 phones per 100K people)
— Down from 34,368 in 2000 (581.5 phones per 100K people)

Josemaria Toscano // Shutterstock
#36. Oregon
Portland cityscape from Pittock Mansion.
– 95% decline in number of pay phones
– Number of pay phones remaining in 2016: 1,076 (26.3 phones per 100K people)
— Down from 21,659 in 2000 (631.5 phones per 100K people)
Joe Belanger // Shutterstock
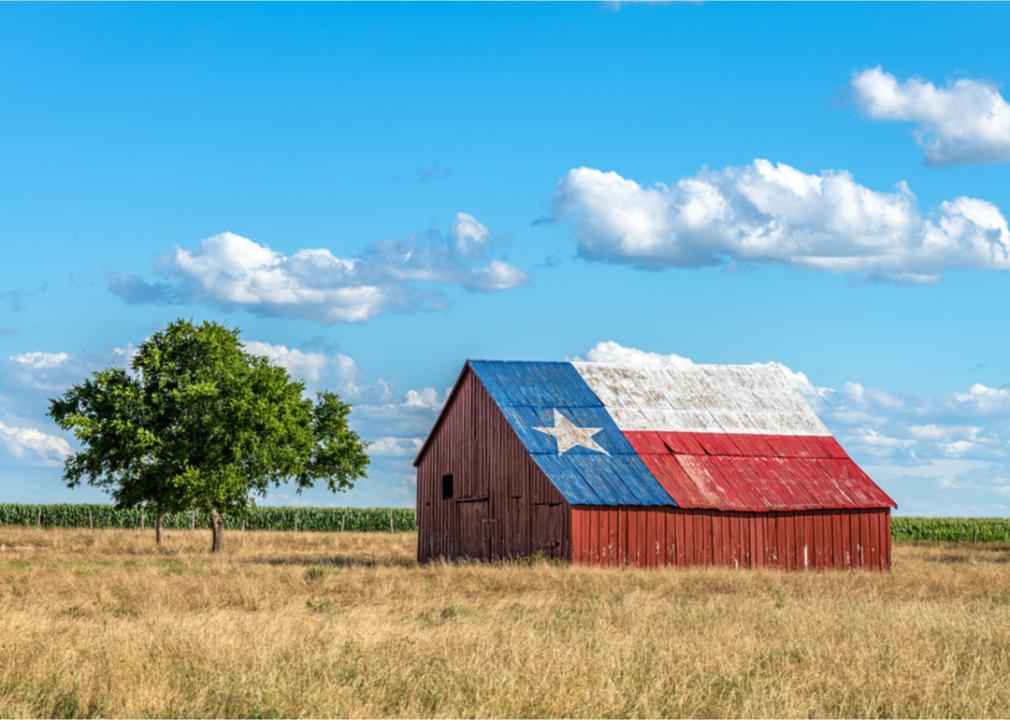
#35. Texas
Rural barn painted with Texas flag.
– 95.3% decline in number of pay phones
– Number of pay phones remaining in 2016: 7,006 (25.1 phones per 100K people)
— Down from 147,720 in 2000 (705.3 phones per 100K people)

Maciej Bledowski // Shutterstock
#34. Utah
Aerial view of the Salt Lake City downtown in autumn.
– 95.3% decline in number of pay phones
– Number of pay phones remaining in 2016: 542 (17.8 phones per 100K people)
— Down from 11,466 in 2000 (510.8 phones per 100K people)
Kerry Hargrove
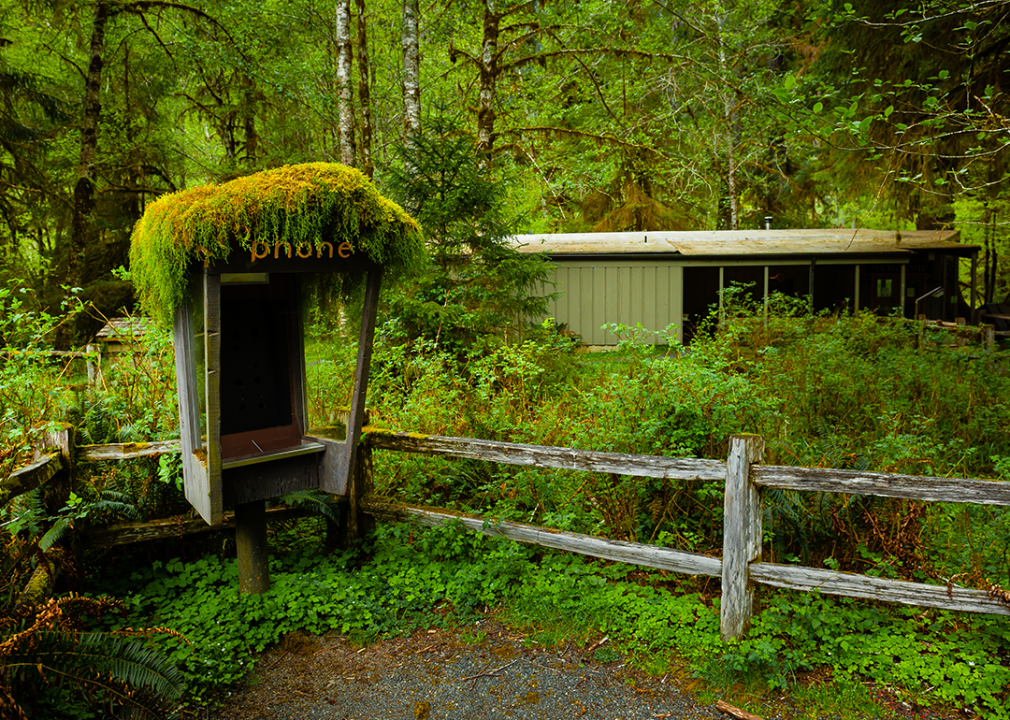
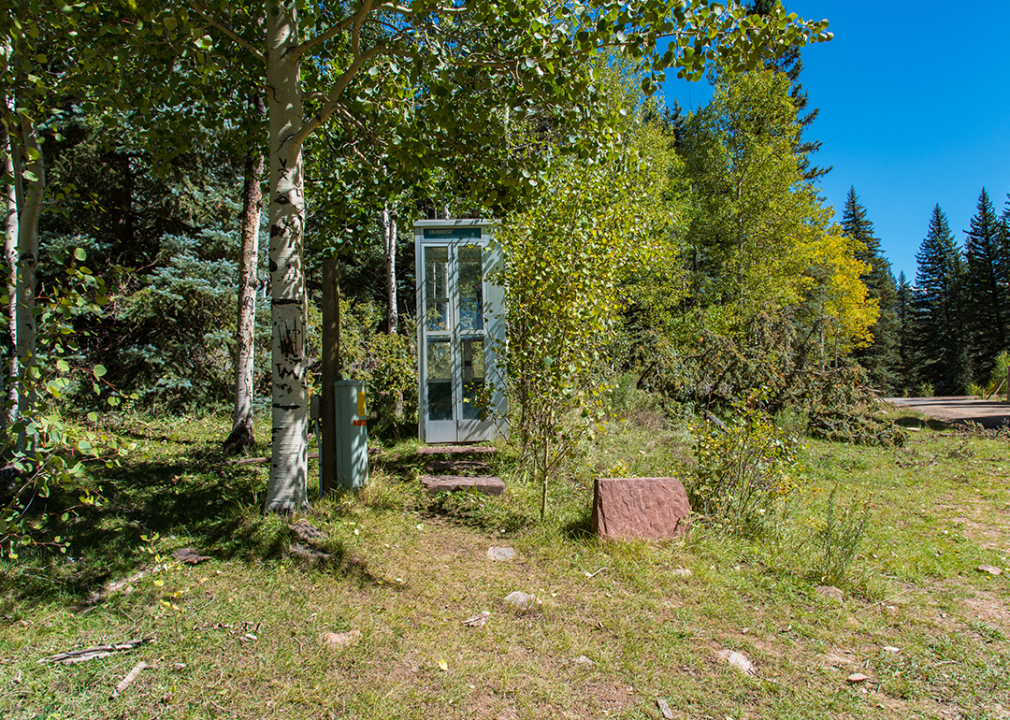
#33. Colorado
Telephone booth in forest.
– 95.4% decline in number of pay phones
– Number of pay phones remaining in 2016: 1,246 (22.5 phones per 100K people)
— Down from 27,035 in 2000 (624.8 phones per 100K people)
f11photo // Shutterstock
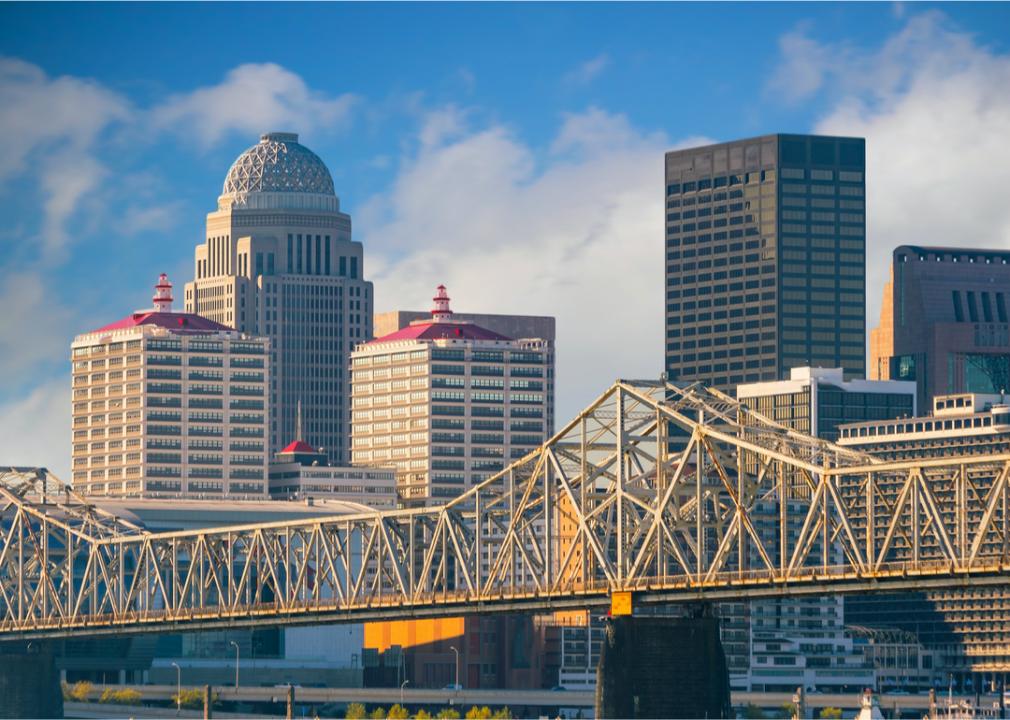
#32. Kentucky
Louisville cityscape.
– 95.4% decline in number of pay phones
– Number of pay phones remaining in 2016: 880 (19.8 phones per 100K people)
— Down from 19,233 in 2000 (475 phones per 100K people)
Jacob Boomsma // Shutterstock
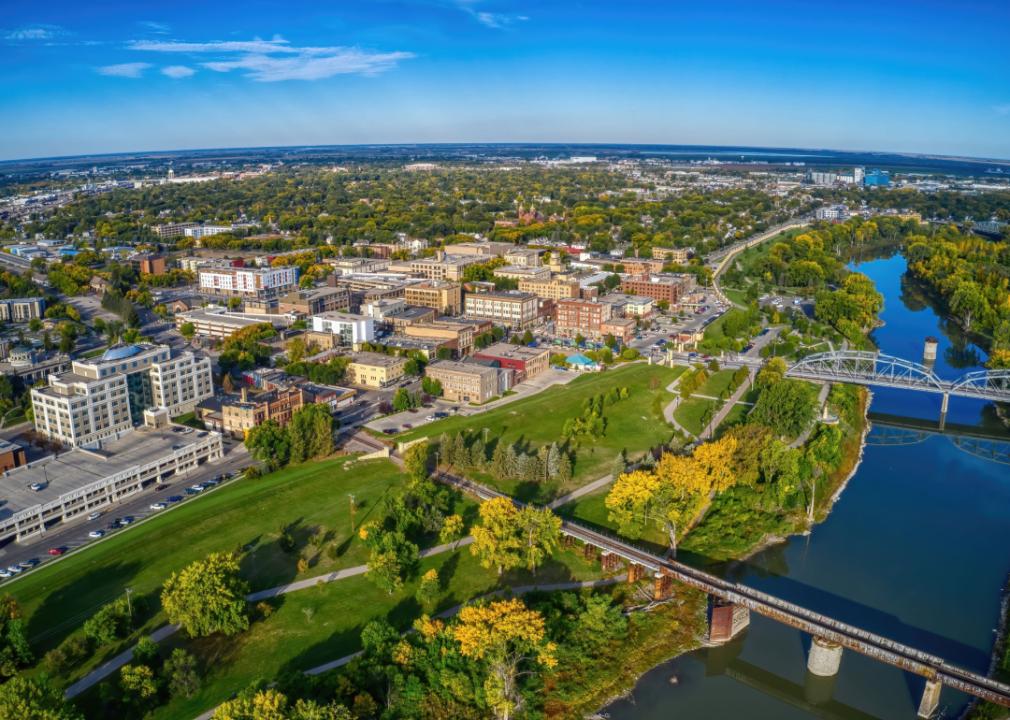
#31. North Dakota
Aerial view of Grand Forks.
– 95.5% decline in number of pay phones
– Number of pay phones remaining in 2016: 113 (15 phones per 100K people)
— Down from 2,507 in 2000 (390.5 phones per 100K people)
Wangkun Jia // Shutterstock
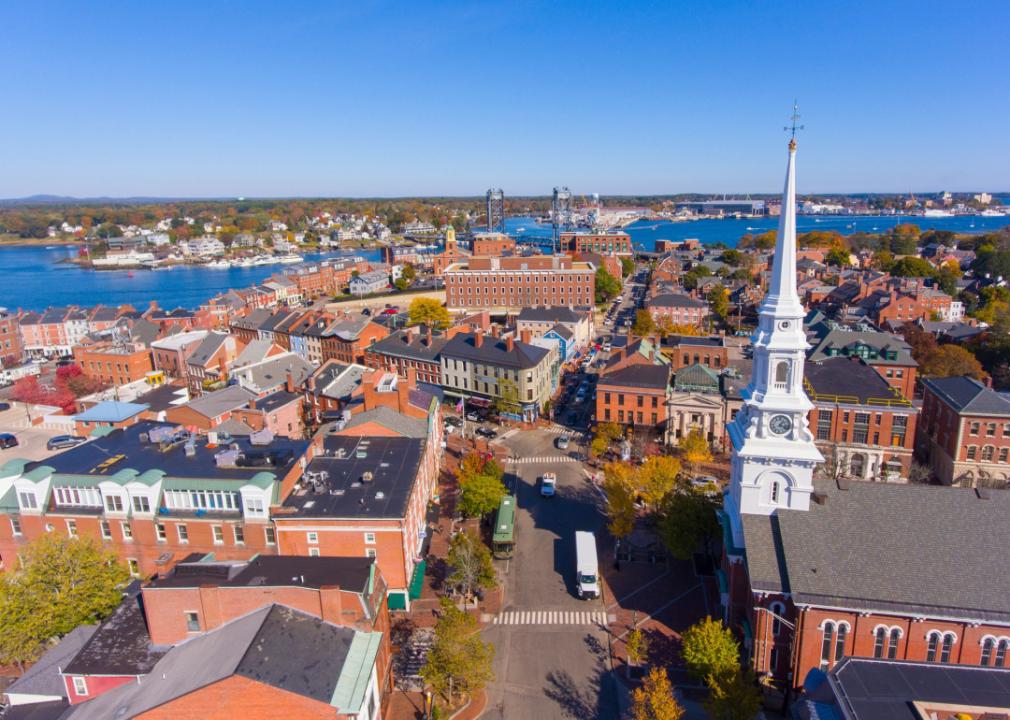
#30. New Hampshire
Aerial view of Market Square and North Church in Portsmouth.
– 95.5% decline in number of pay phones
– Number of pay phones remaining in 2016: 364 (27.1 phones per 100K people)
— Down from 8,132 in 2000 (655.9 phones per 100K people)

Richard Cavalleri // Shutterstock
#29. Massachusetts
Aerial view of Boston.
– 95.7% decline in number of pay phones
– Number of pay phones remaining in 2016: 2,268 (33.2 phones per 100K people)
— Down from 53,034 in 2000 (833.7 phones per 100K people)

Joseph Sohm // Shutterstock
#28. Maine
Portland Head Lighthouse and coastline.
– 95.8% decline in number of pay phones
– Number of pay phones remaining in 2016: 317 (23.8 phones per 100K people)
— Down from 7,496 in 2000 (587 phones per 100K people)
Jon Bilous // Shutterstock
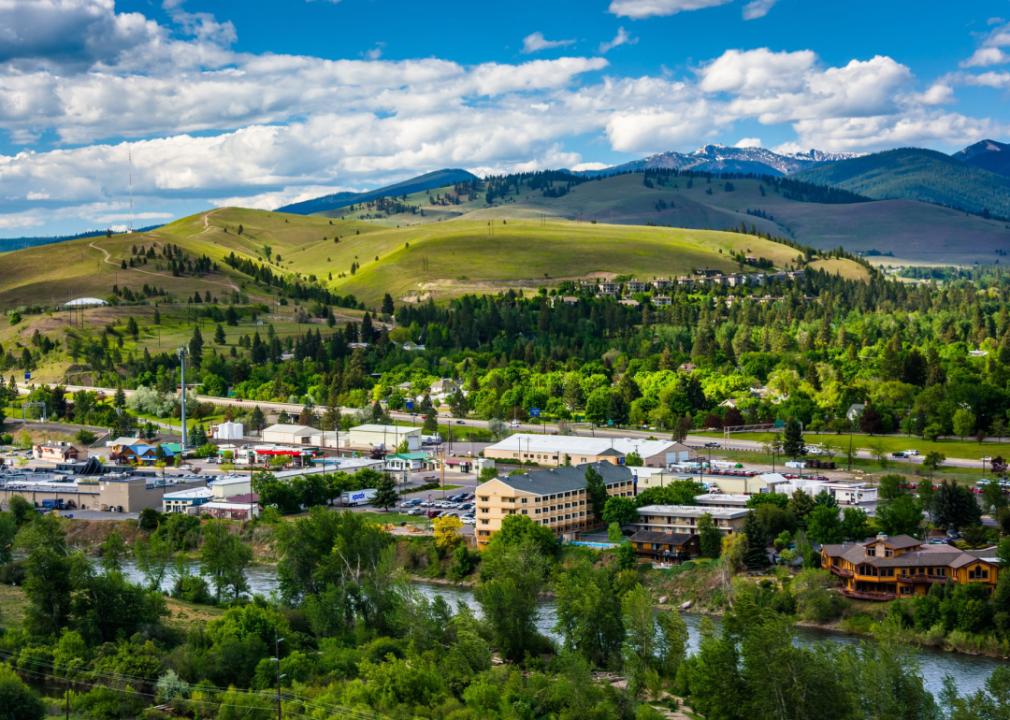
#27. Montana
View of Missoula from Mount Sentinel.
– 95.8% decline in number of pay phones
– Number of pay phones remaining in 2016: 245 (23.5 phones per 100K people)
— Down from 5,884 in 2000 (651 phones per 100K people)
Vincent DeMilio // Shutterstock
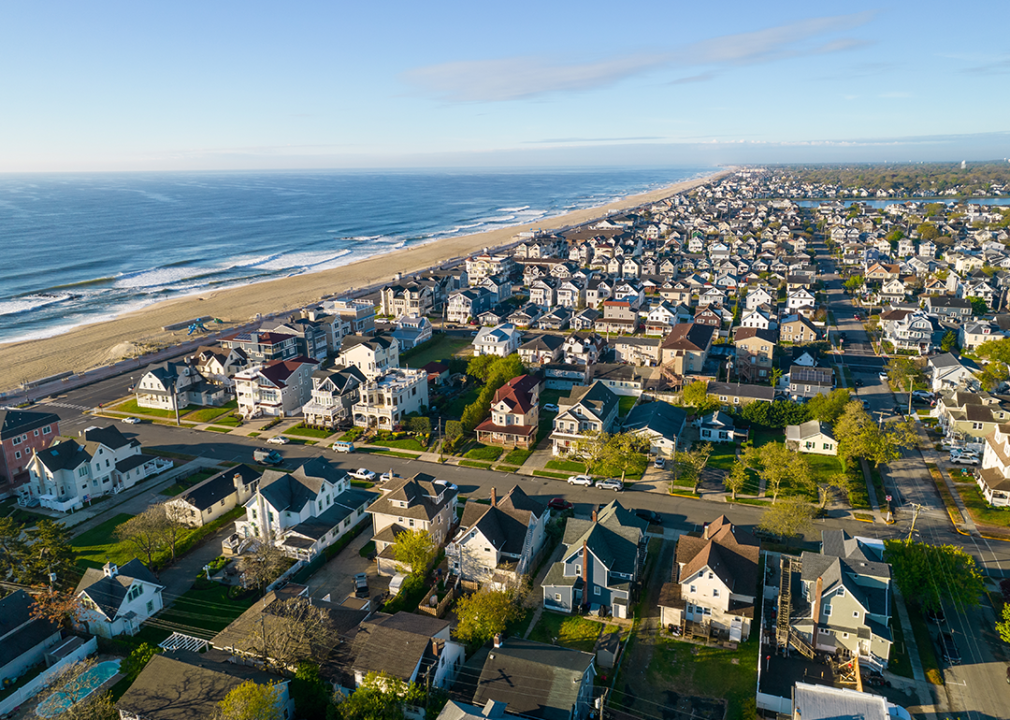
#26. New Jersey
Jersey Shore coastline aerial view.
– 96.3% decline in number of pay phones
– Number of pay phones remaining in 2016: 3,517 (39.6 phones per 100K people)
— Down from 95,781 in 2000 (1136.1 phones per 100K people)
mTaira // Shutterstock
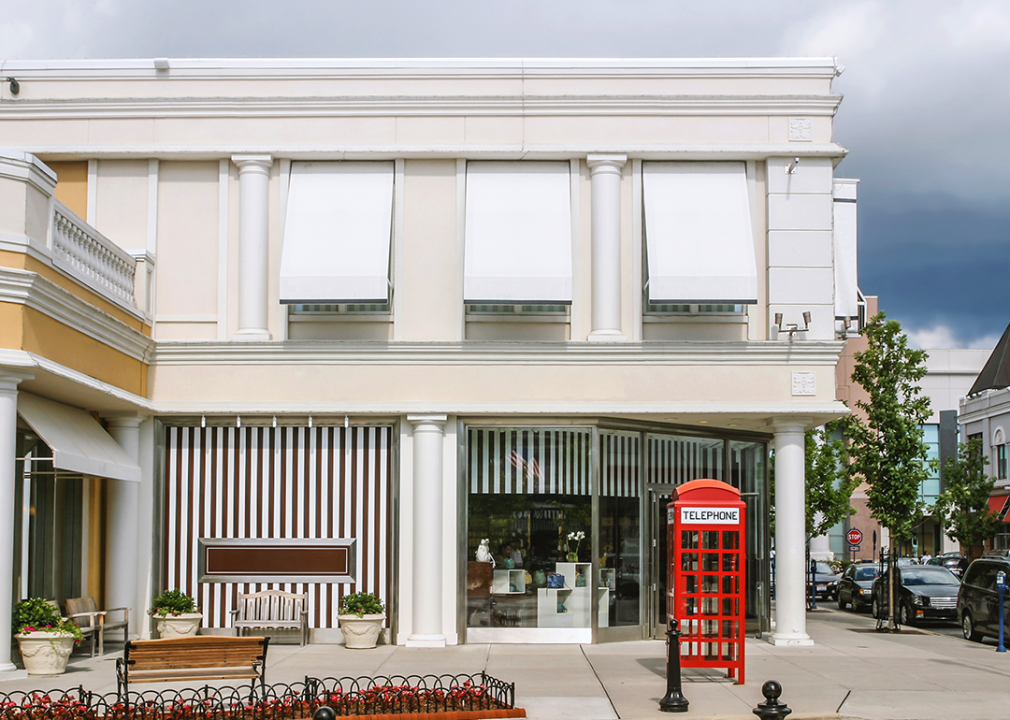
#25. Ohio
Red telephone box in front of downtown shops.
– 96.4% decline in number of pay phones
– Number of pay phones remaining in 2016: 2,540 (21.8 phones per 100K people)
— Down from 71,266 in 2000 (627.1 phones per 100K people)
Joseph Sohm // Shutterstock
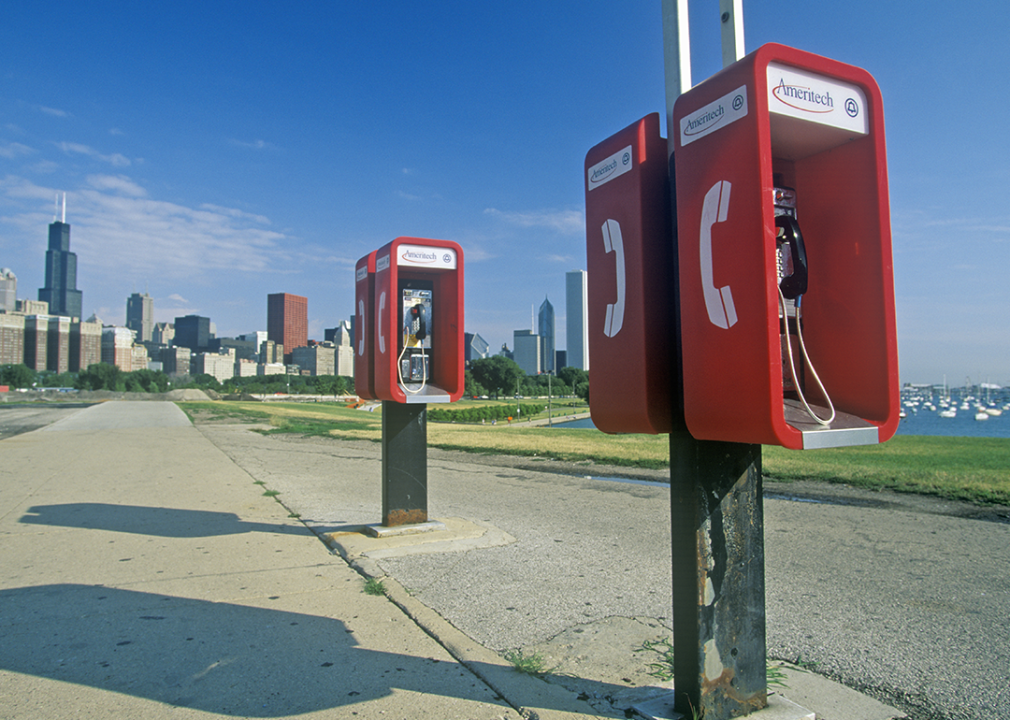
#24. Illinois
Payphones and Chicago skyline.
– 96.8% decline in number of pay phones
– Number of pay phones remaining in 2016: 3,423 (26.7 phones per 100K people)
— Down from 106,368 in 2000 (855.4 phones per 100K people)
Jesse Stephens // Shutterstock
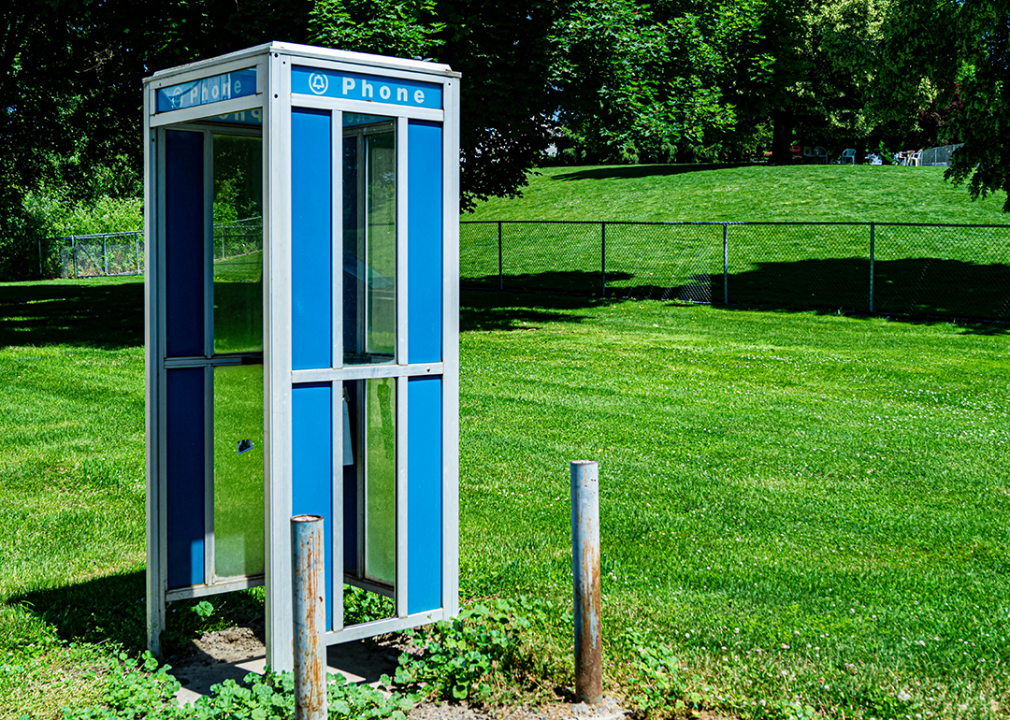
#23. Arkansas
Vintage blue phone booth in a grassy park.
– 96.9% decline in number of pay phones
– Number of pay phones remaining in 2016: 530 (17.7 phones per 100K people)
— Down from 16,954 in 2000 (632.9 phones per 100K people)

Tony Savino // Shutterstock
#22. Wisconsin
Milwaukee cityscape with Art Museum with the Northwestern Mutual building.
– 96.9% decline in number of pay phones
– Number of pay phones remaining in 2016: 1,104 (19.1 phones per 100K people)
— Down from 35,383 in 2000 (658.4 phones per 100K people)
Canva
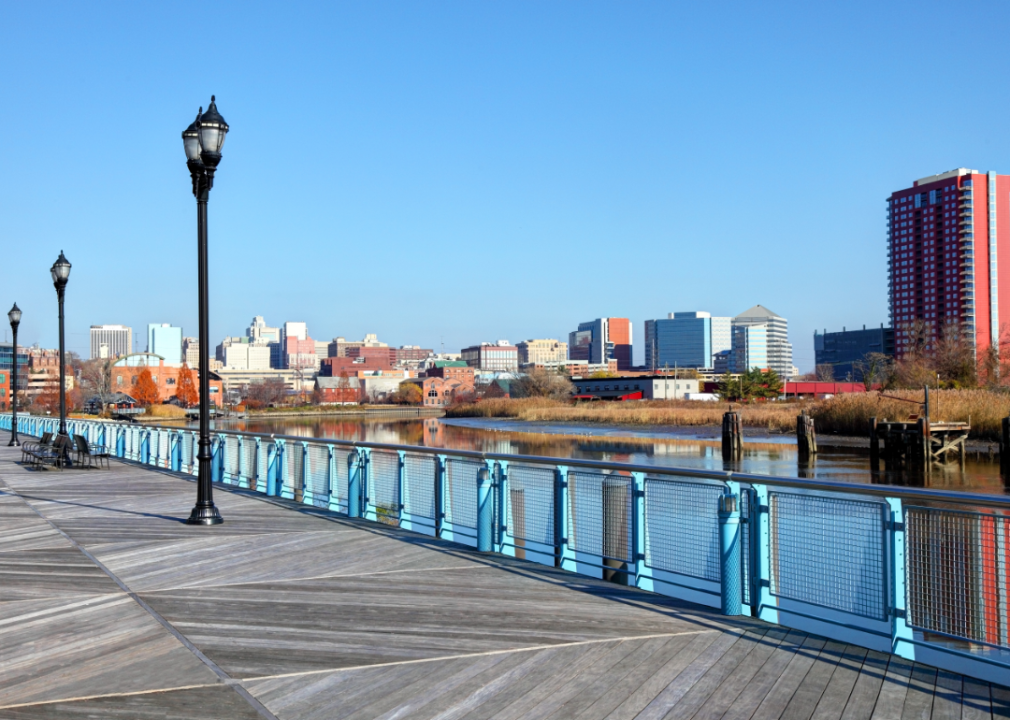
#21. Delaware
Wilmington waterfront and skyline.
– 96.9% decline in number of pay phones
– Number of pay phones remaining in 2016: 175 (18.4 phones per 100K people)
— Down from 5,694 in 2000 (724.1 phones per 100K people)
Kevin Ruck // Shutterstock
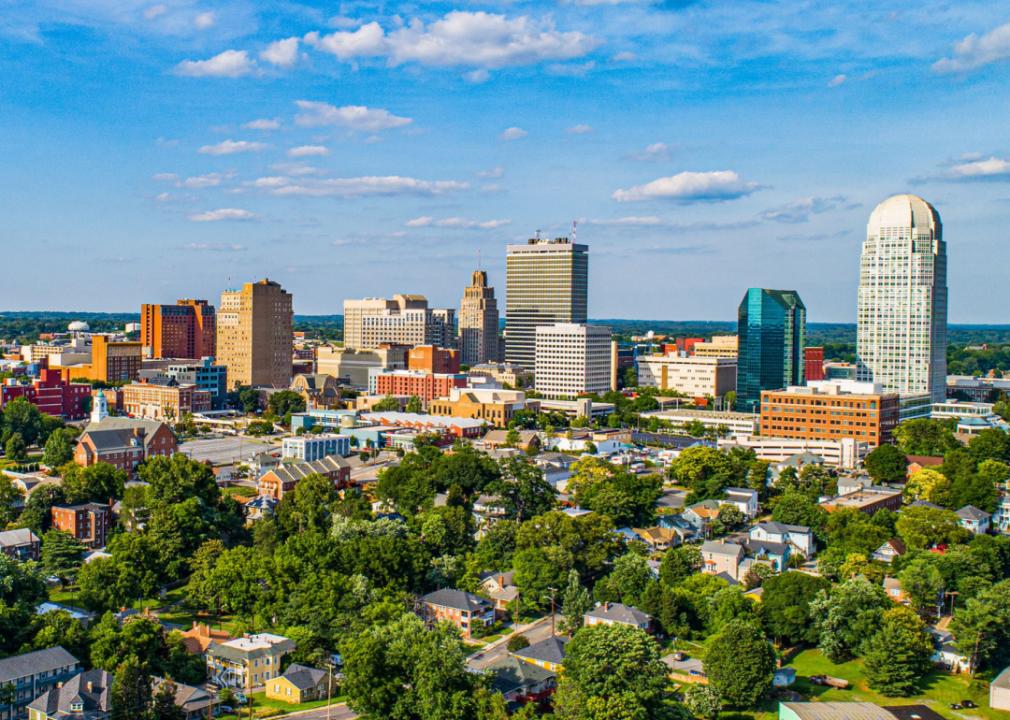
#20. North Carolina
Aerial view of Winston-Salem.
– 97% decline in number of pay phones
– Number of pay phones remaining in 2016: 1,401 (13.8 phones per 100K people)
— Down from 45,943 in 2000 (568.5 phones per 100K people)
KYPhua // Shutterstock
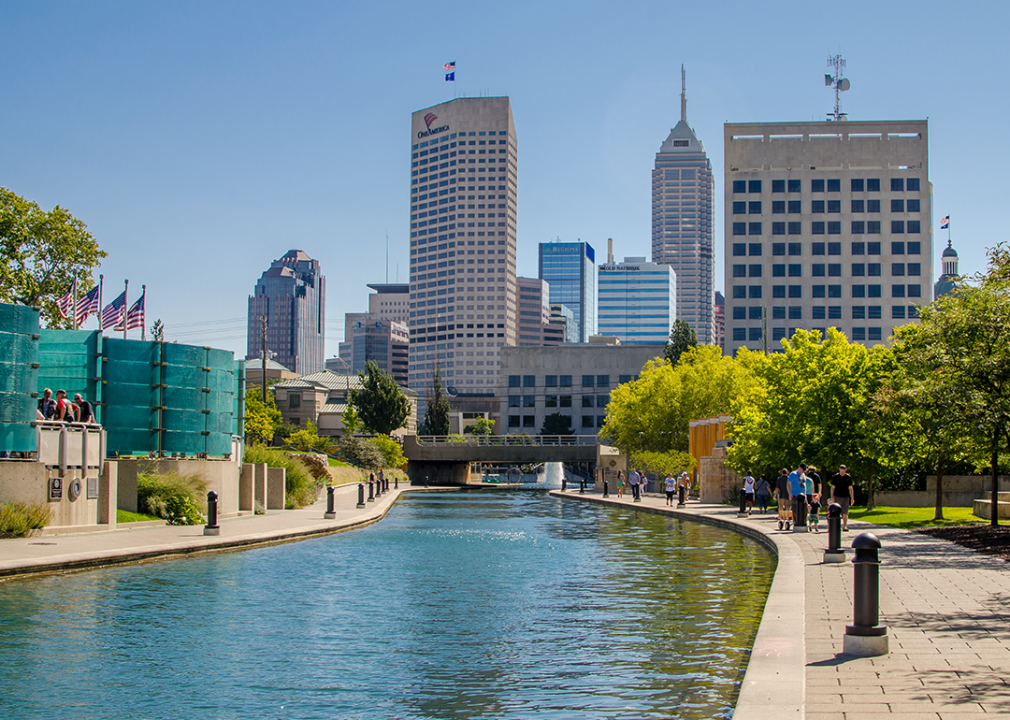
#19. Indiana
Canal walkway in Indianapolis during summer.
– 97% decline in number of pay phones
– Number of pay phones remaining in 2016: 1,286 (19.4 phones per 100K people)
— Down from 42,429 in 2000 (696.5 phones per 100K people)
Del Harper // Shutterstock
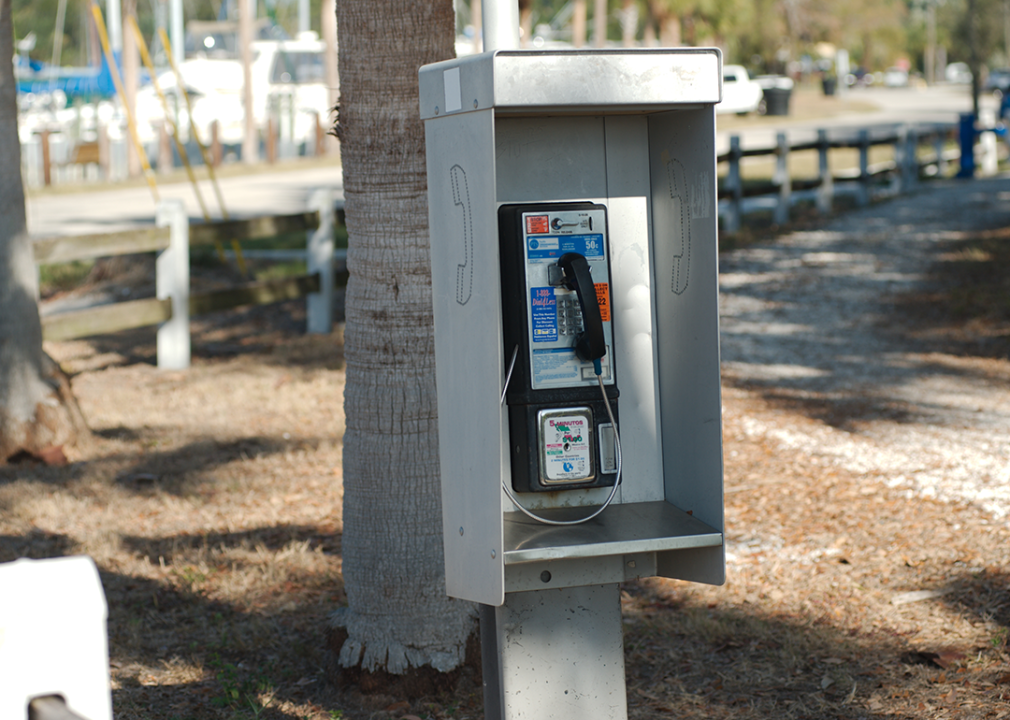
#18. Florida
Payphone near Gulfport Municipal Marina.
– 97% decline in number of pay phones
– Number of pay phones remaining in 2016: 3,605 (17.5 phones per 100K people)
— Down from 119,207 in 2000 (742.8 phones per 100K people)
Kurt Nichols // Shutterstock
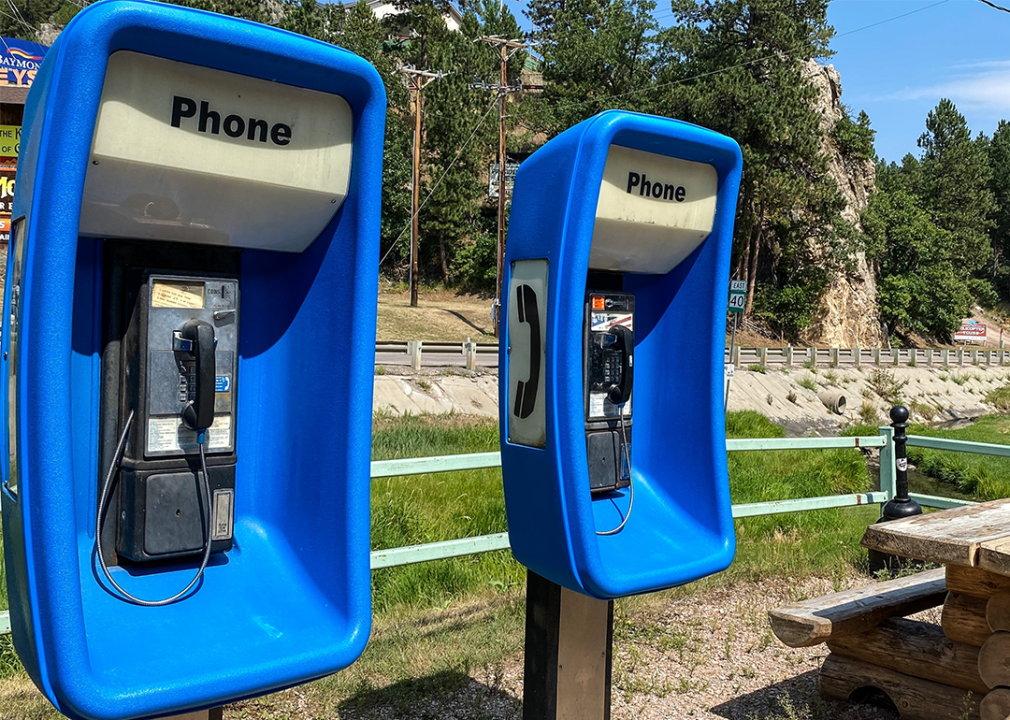
#17. South Dakota
Pay phones in Keystone, South Dakota.
– 97.2% decline in number of pay phones
– Number of pay phones remaining in 2016: 119 (13.8 phones per 100K people)
— Down from 4,326 in 2000 (572.3 phones per 100K people)
Lynda McFaul // Shutterstock
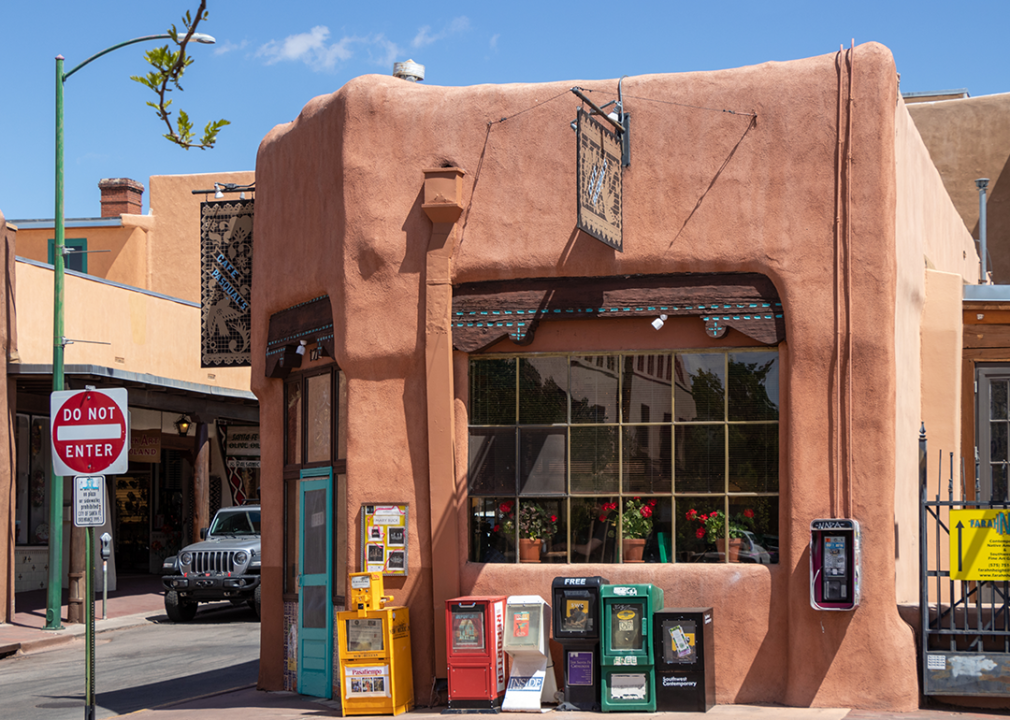
#16. New Mexico
Newspapers and phone booth outside a cafe in Santa Fe.
– 97.3% decline in number of pay phones
– Number of pay phones remaining in 2016: 306 (14.6 phones per 100K people)
— Down from 11,374 in 2000 (624.5 phones per 100K people)
Jacob Boomsma // Shutterstock
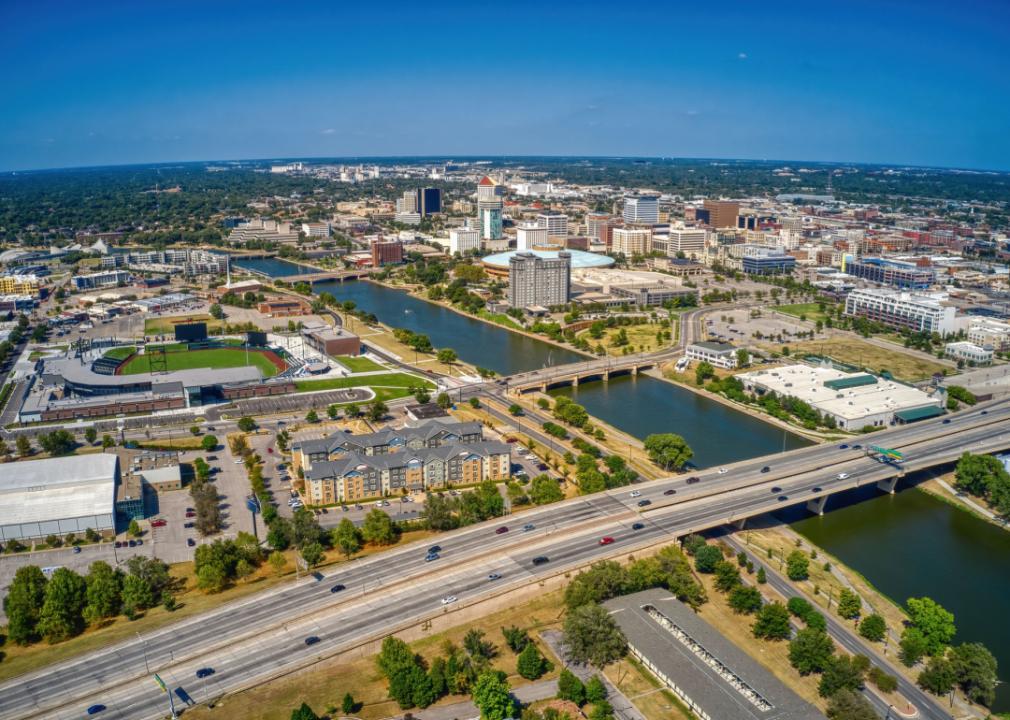
#15. Kansas
Aerial view downtown Wichita.
– 97.4% decline in number of pay phones
– Number of pay phones remaining in 2016: 446 (15.3 phones per 100K people)
— Down from 16,949 in 2000 (629.2 phones per 100K people)
Sean Pavone // Shutterstock
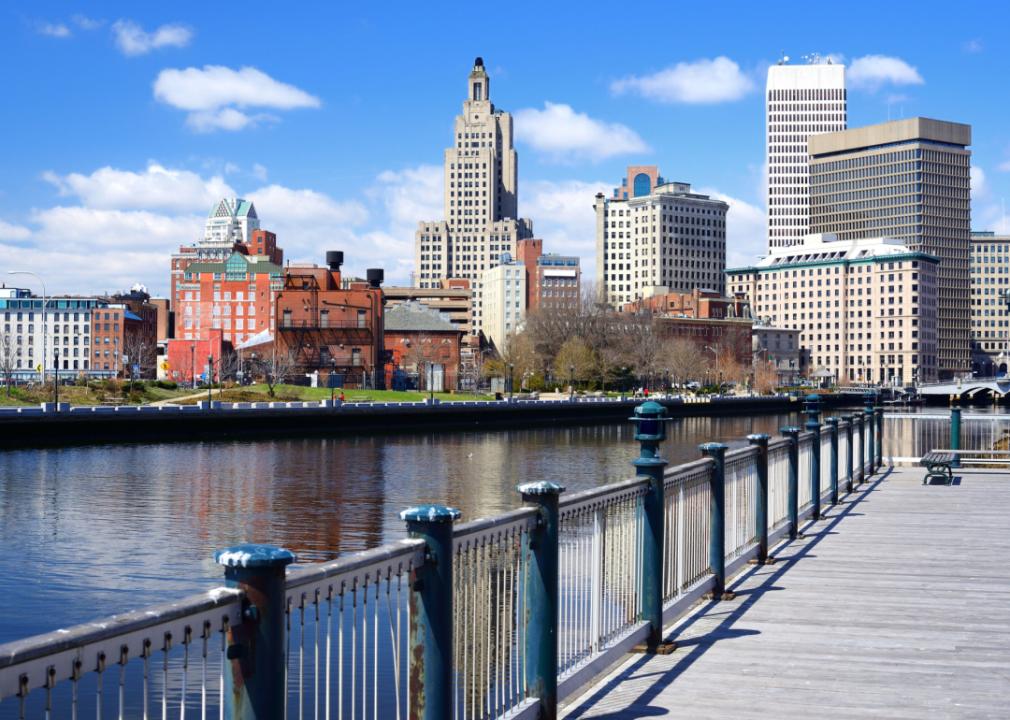
#14. Rhode Island
Providence cityscape.
– 97.4% decline in number of pay phones
– Number of pay phones remaining in 2016: 235 (22.2 phones per 100K people)
— Down from 8,935 in 2000 (850.7 phones per 100K people)
Real Window Creative // Shutterstock
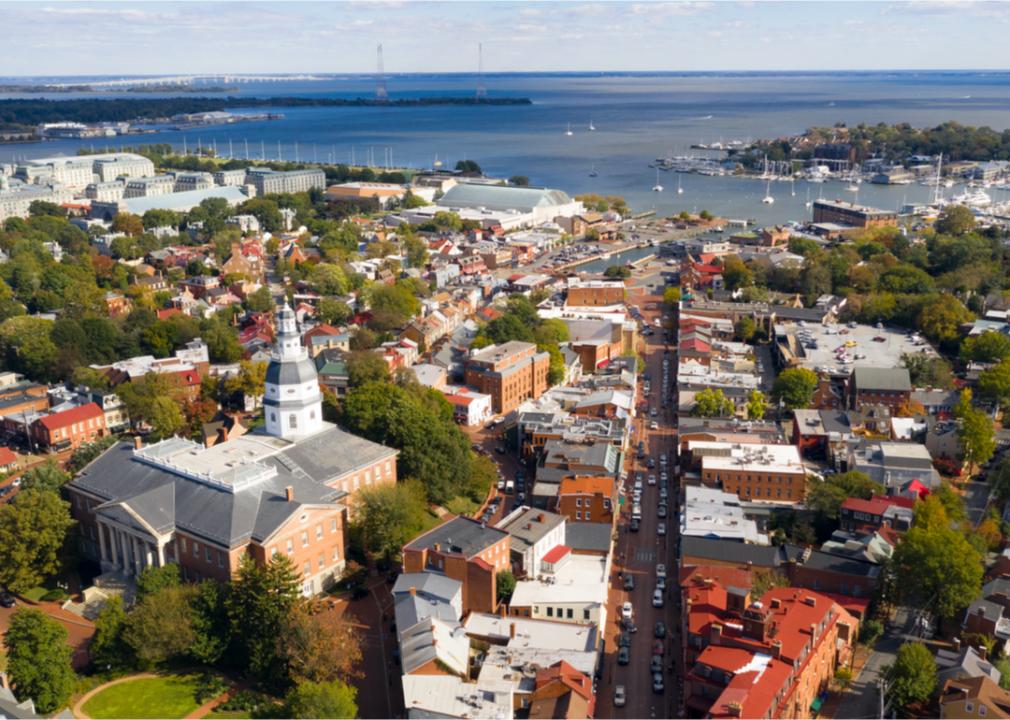
#13. Maryland
Aerial view of Annapolis and Statehouse.
– 97.5% decline in number of pay phones
– Number of pay phones remaining in 2016: 1,074 (17.9 phones per 100K people)
— Down from 43,336 in 2000 (816 phones per 100K people)
Orhan Cam // Shutterstock
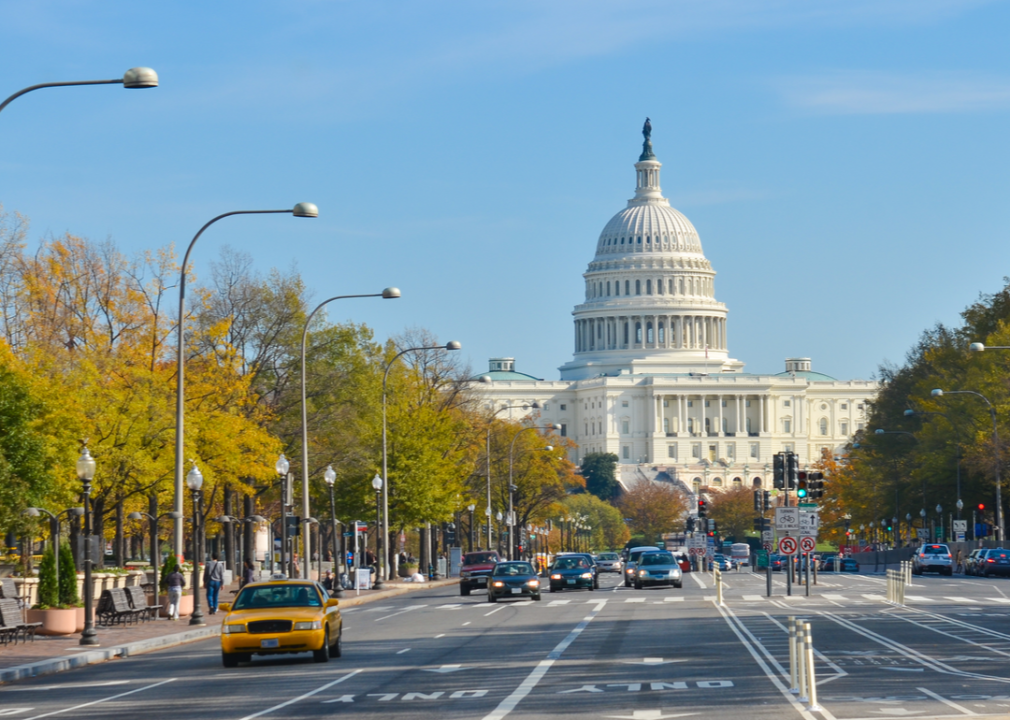
#12. Washington DC
Pennsylvania Avenue and the U.S. Capitol.
– 97.6% decline in number of pay phones
– Number of pay phones remaining in 2016: 257 (37.5 phones per 100K people)
— Down from 10,505 in 2000 (1836.4 phones per 100K people)

Steve Heap // Shutterstock
#11. Virginia
Wide view of Alexandria along the Potomac River.
– 97.6% decline in number of pay phones
– Number of pay phones remaining in 2016: 1,405 (16.7 phones per 100K people)
— Down from 57,621 in 2000 (810.9 phones per 100K people)
Critical Labz // Shutterstock
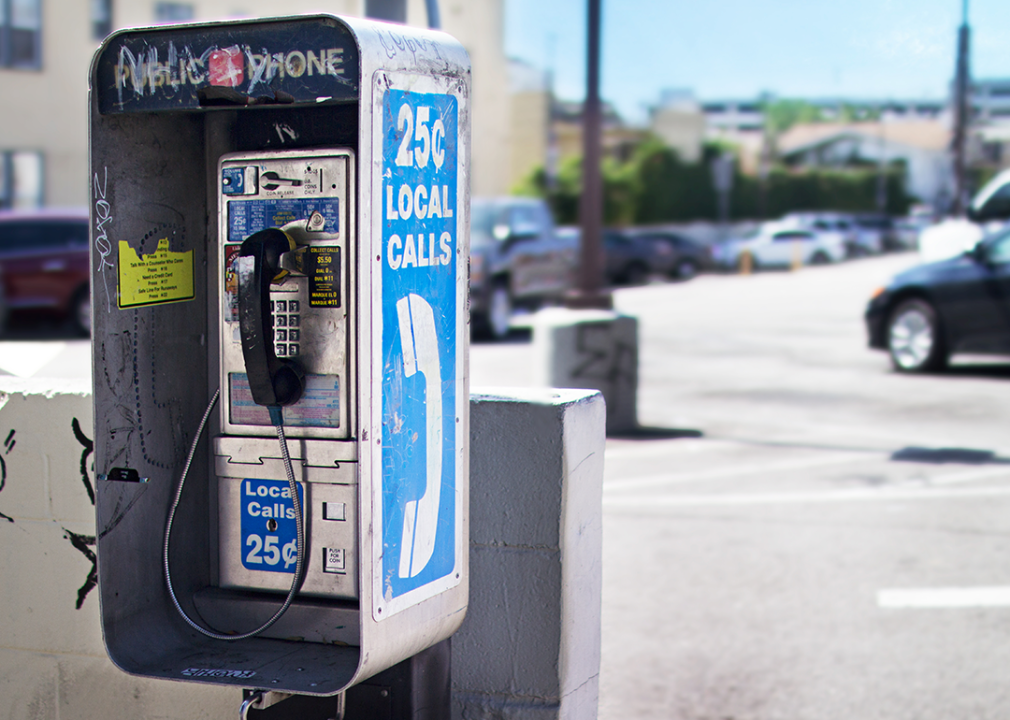
#10. Alabama
Payphone near parking lot.
– 97.7% decline in number of pay phones
– Number of pay phones remaining in 2016: 546 (11.2 phones per 100K people)
— Down from 24,237 in 2000 (544.4 phones per 100K people)

Fang Deng // Shutterstock
#9. South Carolina
Old payphone stand at rest area.
– 97.9% decline in number of pay phones
– Number of pay phones remaining in 2016: 611 (12.3 phones per 100K people)
— Down from 28,444 in 2000 (706.8 phones per 100K people)

photo.ua // Shutterstock
#8. Missouri
Courthouse and Gateway Arch in St Louis.
– 98% decline in number of pay phones
– Number of pay phones remaining in 2016: 861 (14.1 phones per 100K people)
— Down from 42,510 in 2000 (758.1 phones per 100K people)

Sean Pavone // Shutterstock
#7. Connecticut
Skyline of downtown Hartford from above Charter Oak Landing.
– 98% decline in number of pay phones
– Number of pay phones remaining in 2016: 515 (14.4 phones per 100K people)
— Down from 25,941 in 2000 (760.3 phones per 100K people)
WorldStock // Shutterstock
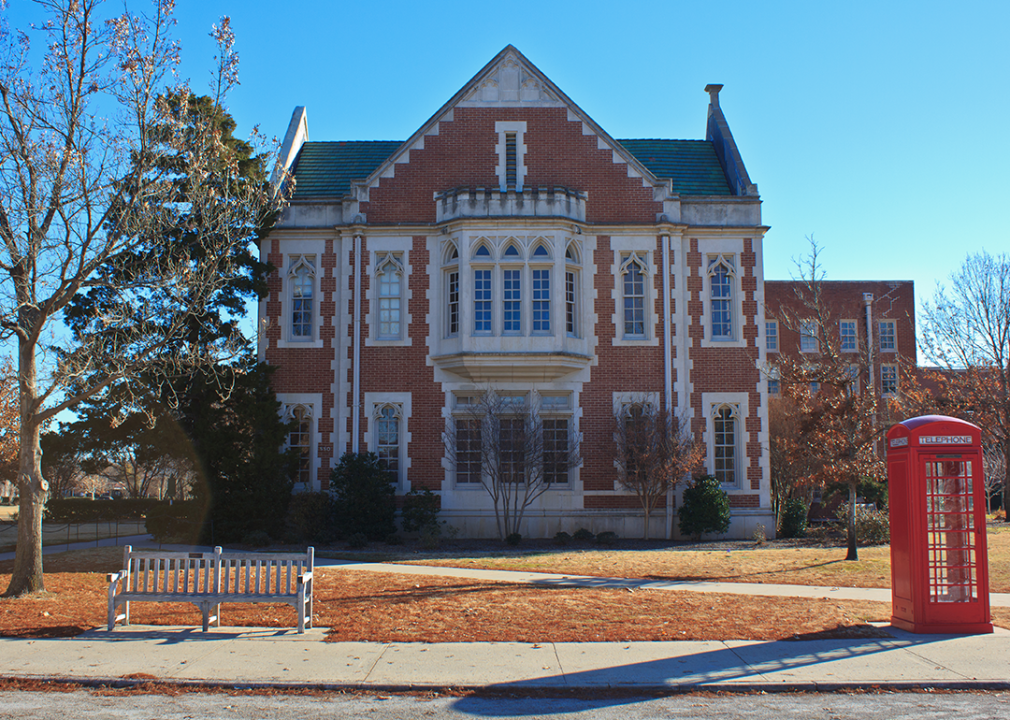
#6. Oklahoma
Red telephone box in front of building at University of Oklahoma.
– 98% decline in number of pay phones
– Number of pay phones remaining in 2016: 511 (13 phones per 100K people)
— Down from 26,164 in 2000 (757.4 phones per 100K people)
Canva
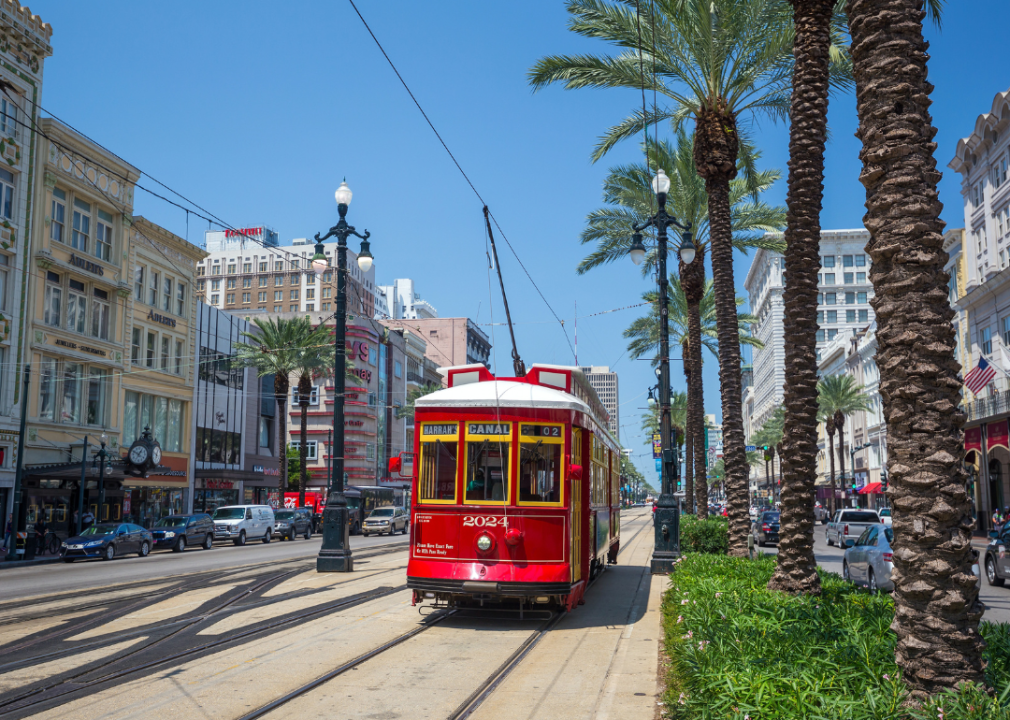
#5. Louisiana
Red streetcar on Canal Street in New Orleans.
– 98.1% decline in number of pay phones
– Number of pay phones remaining in 2016: 539 (11.5 phones per 100K people)
— Down from 27,835 in 2000 (622.4 phones per 100K people)

Brian Wilson Photography // Shutterstock
#4. Tennessee
Downtown Nashville in autumn.
– 98.4% decline in number of pay phones
– Number of pay phones remaining in 2016: 637 (9.6 phones per 100K people)
— Down from 38,929 in 2000 (682.5 phones per 100K people)
Wirestock Creators // Shutterstock
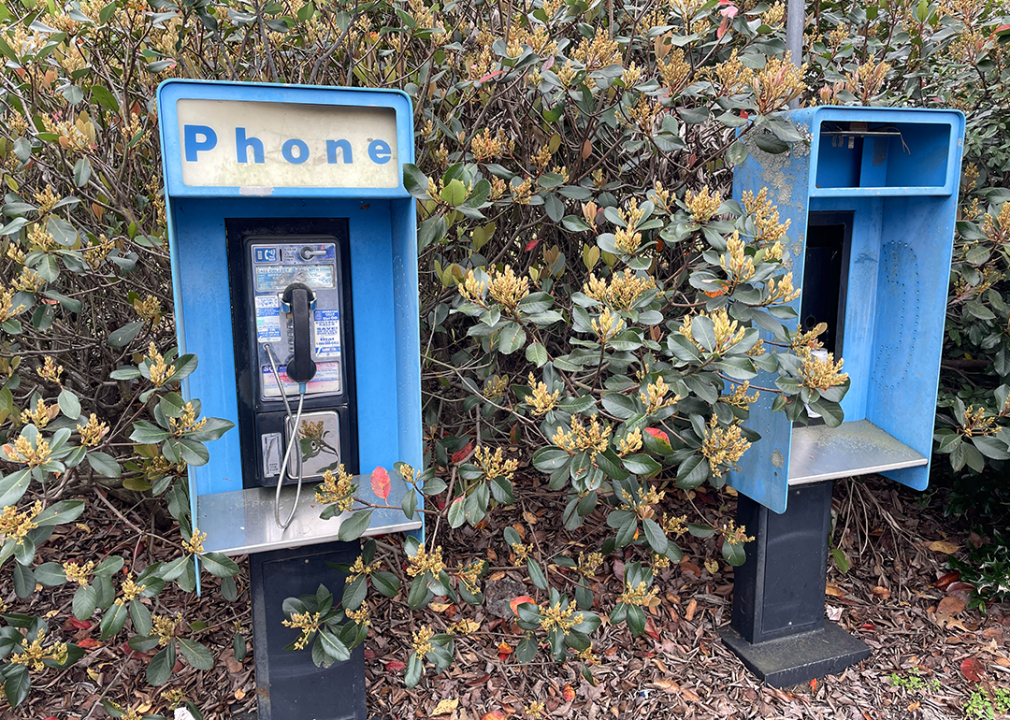
#3. Georgia
Two vintage pay phones in Augusta.
– 98.4% decline in number of pay phones
– Number of pay phones remaining in 2016: 995 (9.7 phones per 100K people)
— Down from 61,519 in 2000 (747.7 phones per 100K people)
Gerald Bernard // Shutterstock
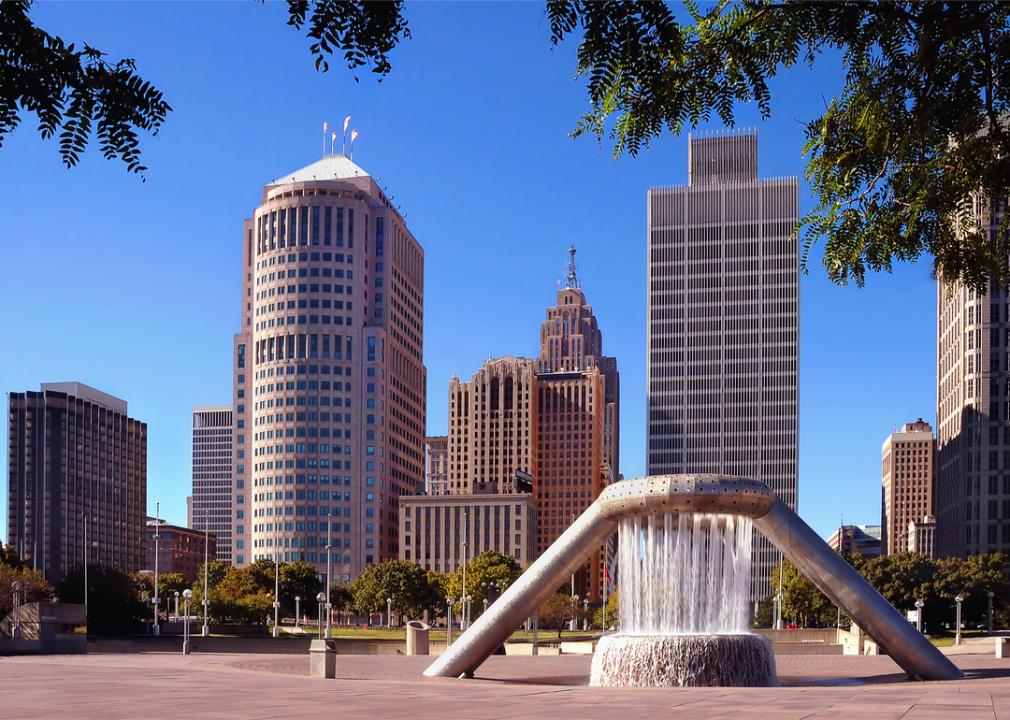
#2. Michigan
Park and skyscrapers in downtown Detroit.
– 98.6% decline in number of pay phones
– Number of pay phones remaining in 2016: 1,187 (11.9 phones per 100K people)
— Down from 83,159 in 2000 (835.6 phones per 100K people)
Sean Pavone // Shutterstock
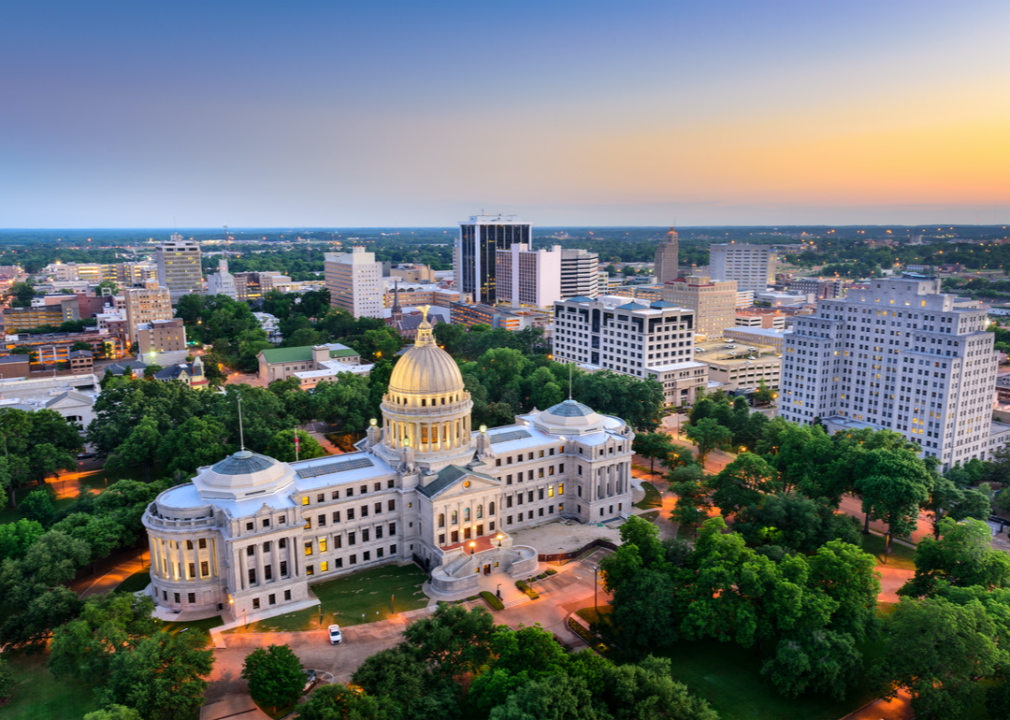
#1. Mississippi
Jackson downtown cityscape at the Capitol.
– 98.8% decline in number of pay phones
– Number of pay phones remaining in 2016: 188 (6.3 phones per 100K people)
— Down from 16,201 in 2000 (568.8 phones per 100K people)
Story editing by Alizah Salario. Copy editing by Kristen Wegrzyn.
This story originally appeared on Spokeo and was produced and
distributed in partnership with Stacker Studio.
