1 in 10 Americans have tried injectable weight loss medication—These are the cities with the most early adopters

Alones // Shutterstock
1 in 10 Americans have tried injectable weight loss medication—These are the cities with the most early adopters
Person using a weight loss injectable on arm at home.
The market for injectable weight loss medications has experienced rapid growth. Goldman Sachs Research predicts the global anti-obesity drug market could reach $100 billion by 2030.
In tandem, public perceptions of these medications are evolving significantly. With celebrities crediting the new treatments for their weight loss transformations and increased discussion across social media platforms, awareness and acceptance of the medications have surged. According to a recent study from Hers, a whopping 66% of surveyed Americans are open to taking prescription weight loss medication, and 9% reported that they’ve tried, or are currently taking, injectable weight loss medications.
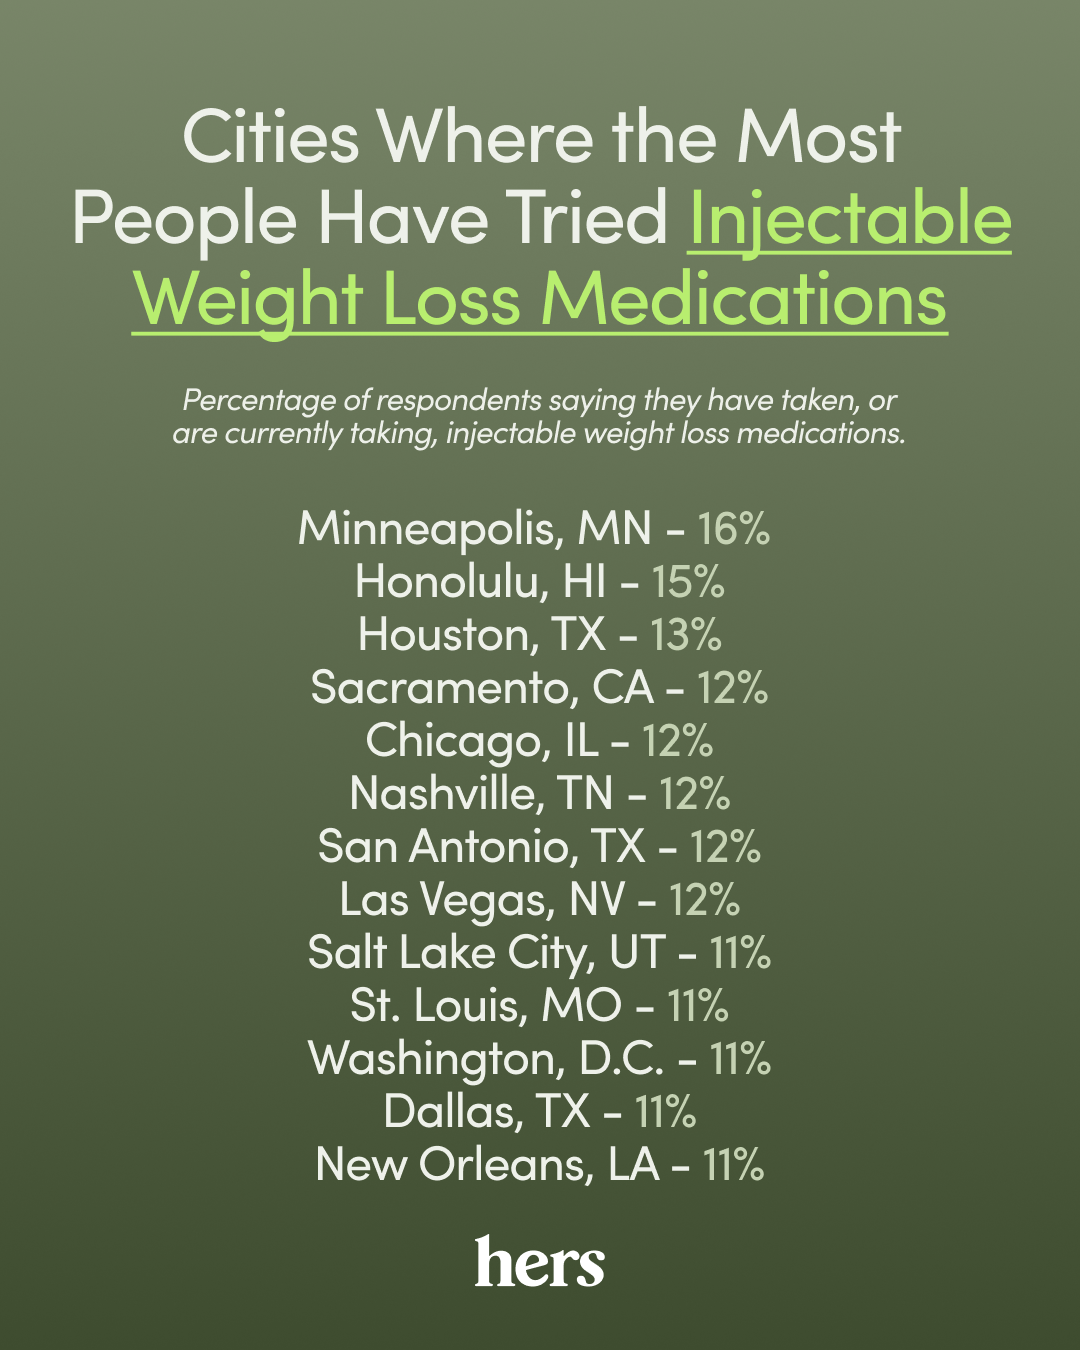
Three cities in Hawaii, Minnesota, and Texas report the highest usage of injectable weight loss medications.
![]()
Hers
Cities Where Large Majorities Are Open to Trying Weight Loss Meds
Hers’ list of cities where most people use weight loss injectable medication.
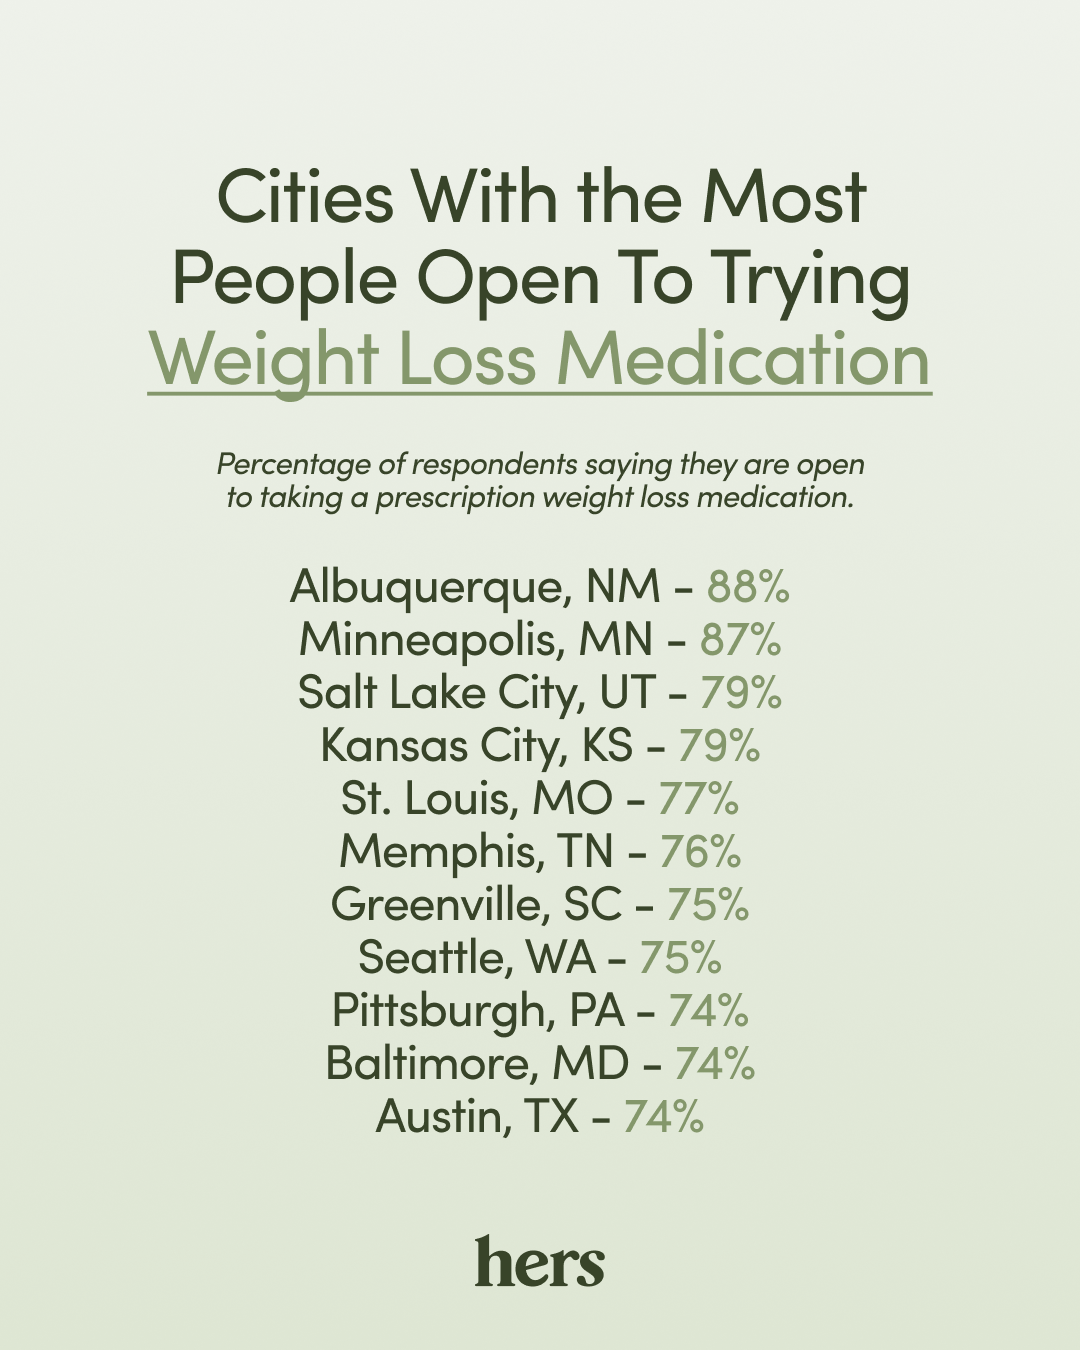
Meanwhile, cities in New Mexico, Minnesota, Kansas, and Utah are leading the pack for cities who are the most open to trying a prescription weight loss medication.
Hers
In Minneapolis, Minnesota, Injectable Weight Loss Treatments Are Correlated With Body Positivity
Hers’ list of cities with the most people open to trying weight loss medication.
This Midwestern hub ranks as having some of the most body positive residents in the United States: 69% report being satisfied or highly satisfied with their bodies, a figure that outpaces the 53% satisfaction rate among Americans overall. Similarly, satisfaction with weight, often a more challenging metric, is higher in Minneapolis than in the rest of the country (64% vs. 53%).
Minneapolis also leads that nation in residents who have used injectable weight loss medications, such as Ozempic or Mounjaro, with 16% of respondents reporting that they’ve tried them—nearly double the national average of 9%. Moreover, 87% of Minneapolis respondents are open to trying injectable weight loss medications, far surpassing the national openness rate of 66%. While this study does not directly link injectable weight loss medications with body positivity, it’s noteworthy that Minneapolis ranks at the top in both categories.
In Honolulu, Hawaii, Injectable Weight Loss Treatments Are One Piece of the Holistic Health Puzzle
Honolulu reports the second highest percentage of residents who have tried injectable weight loss medications, with 15% of its residents saying they’ve used or are currently using them.
Honolulu residents also report exercising more than most Americans: Only 7% of residents say they don’t exercise, compared to 13% nationwide. On average, residents of Honolulu spend 93 minutes outdoors daily (thanks in part to Hawaii’s favorable weather), compared to the 81 minutes spent by total respondents. The city’s residents are also significantly less likely to cite weight as a source of major stress—only 18% list it as a top stressor, compared to 29% nationwide.
For residents of Honolulu, injectable weight loss medications are a piece of the puzzle that complement, rather than replace, exercise and other healthy living practices.
Residents of Houston, Texas Have Tried It All When It Comes to Weight Loss
Rounding out the top three cities is Houston, where 13% of the population has tried injectable weight loss medications. Achieving weight loss goals is a challenge in Houston, with 27% of respondents saying that lack of commitment is their top hurdle, compared to 21% nationwide.
Many Houstonians report having tried various weight loss practices before turning to injectables: 40% have given up guilty pleasure foods (vs. 28% of all respondents); 31% have tried intermittent fasting (vs. 21%); and 21% have followed a specific diet (vs. 17%). Injectable weight loss medications offer a new option to help them stick to their goals.
Use of Injectable Weight Loss Medications by City
Percentage of respondents saying they’ve tried, or are currently taking, injectable weight loss medications
- Minneapolis, MN – 16%
- Honolulu, HI – 15%
- Houston, TX – 13%
- Sacramento, CA – 12%
- Chicago, IL – 12%
- Nashville, TN – 12%
- San Antonio, TX – 12%
- Las Vegas, NV – 12%
- Salt Lake City, UT – 11%
- St. Louis, MO – 11%
- Washington, DC – 11%
- Dallas, TX – 11%
- New Orleans, LA – 11%
- Omaha, NE – 10%
- Norfolk, VA – 10%
- Milwaukee, WI – 10%
- Philadelphia, PA – 10%
- Orlando, FL – 10%
- Raleigh, NC – 10%
- Pittsburgh, PA – 9%
- Seattle, WA – 9%
- Kansas City, KS – 9%
- Tampa, FL – 9%
- Louisville, KY – 9%
- Oklahoma City, OK – 8%
- Charlotte, NC – 8%
- Boston, MA – 8%
- Denver, CO – 8%
- Albuquerque, NM – 8%
- Cleveland, OH – 8%
- New York, NY – 7%
- Phoenix, AZ – 7%
- New Haven, CT – 7%
- Columbus, OH – 7%
- Miami, FL – 7%
- Baltimore, MD – 7%
- Greenville, SC – 6%
- San Francisco, CA – 6%
- Providence, RI – 6%
- Atlanta, GA – 6%
- Los Angeles, CA – 6%
- Birmingham, AL – 6%
- Memphis, TN – 6%
- Indianapolis, IN – 6%
- Little Rock, AR – 5%
- Austin, TX – 4%
- San Diego, CA – 3%
- Portland, OR – 3%
- Detroit, MI – 2%
- Des Moines, IA – 2%
Openness To Trying Prescription Weight Loss Medication by City
Percentage of respondents saying they are open to taking a prescription weight loss medication
- Albuquerque, NM – 88%
- Minneapolis, MN – 87%
- Salt Lake City, UT – 79%
- Kansas City, KS – 79%
- St. Louis, MO – 77%
- Memphis, TN – 76%
- Greenville, SC – 75%
- Seattle, WA – 75%
- Pittsburgh, PA – 74%
- Baltimore, MD – 74%
- Austin, TX – 74%
- Indianapolis, IN – 72%
- Norfolk, VA – 71%
- Little Rock, AR – 71%
- Sacramento, CA – 70%
- Washington, DC – 69%
- Oklahoma City, OK – 69%
- Denver, CO – 69%
- Columbus, OH – 69%
- Milwaukee, WI – 68%
- Omaha, NE – 67%
- New Orleans, LA – 67%
- San Francisco, CA – 67%
- Chicago, IL – 67%
- Honolulu, HI – 66%
- Louisville, KY – 66%
- Miami, FL – 65%
- San Antonio, TX – 65%
- San Diego, CA – 65%
- Des Moines, IA – 65%
- New Haven, CT – 64%
- Dallas, TX – 64%
- Raleigh, NC – 63%
- Detroit, MI – 63%
- New York, NY – 61%
- Tampa, FL – 61%
- Orlando, FL – 61%
- Boston, MA – 60%
- Charlotte, NC – 60%
- Los Angeles, CA – 60%
- Philadelphia, PA – 60%
- Providence, RI – 60%
- Houston, TX – 60%
- Atlanta, GA – 59%
- Nashville, TN – 59%
- Birmingham, AL – 58%
- Las Vegas, NV – 56%
- Cleveland, OH – 55%
- Portland, OR – 54%
- Phoenix, AZ – 49%
Tips For Safe, Healthy Weight Loss
- Consult a healthcare provider: Before starting a weight loss journey, consult with a healthcare provider. They can make recommendations for how to get started and ensure any potential treatment option is the right fit for your health needs and goals.
- Practice healthy habits: Whether you’re taking prescription weight loss medications or not, a balanced diet, regular exercise, and proper sleep and hydration are cornerstones for weight loss.
- Stay informed: Keep up-to-date with the latest research and developments in weight loss treatments to empower yourself to make informed decisions about your health, alongside your healthcare provider.
Data & Methodology
This study is based on a 5,504-person online survey, which included 5,000 18-to-65-year-old respondents in the top 50 metropolitan areas (100 respondents per city) and a nationally representative sample of 504 18-to-65-year-old respondents to contextualize results. The study was fielded in May 2024.
Findings were analyzed by more than 100 demographic and psychographic cuts, including city, region, gender (when Hers refers to “women” and “men,” this includes all people who self-identify as such), age, race and ethnicity, relationship status, parenting status, sexual orientation (heterosexual, bisexual, gay, lesbian, pansexual, asexual, queer, etc.), and political affiliation, among other areas of interest.
Metropolitan populations were determined by 2022 US Census data. In order to represent as many states as possible within the study, five cities that did not fall in the top 50 metropolitan locations were selected in place of cities in states already represented. Cities added to the study included New Orleans, LA (51), Providence, RI (53), Little Rock, AR (59), Honolulu, HI (68), and Omaha, NE (71). Cities replaced in the study included West Palm Beach, FL (39), Jacksonville, FL (41), Grand Rapids, MI (42), Harrisburg, PA (44), and Greensboro, NC (45).
All data in this study are from this source, unless otherwise noted. Independent research firm, Culture Co-op, conducted and analyzed research and findings.
This story was produced by Hers and reviewed and distributed by Stacker Media.
