Counties with the highest rate of food insecure children in Texas

Billy Hathorn // Wikimedia Commons
Counties with the highest rate of food insecure children in Texas
Food insecurity is a widespread problem in the United States, with people experiencing food insecurity in every single county in the nation. The nonprofit Feeding America describes food insecurity as “a lack of consistent access to enough food for every person in a household to live an active, healthy life.”
Food insecurity hits children particularly hard. The USDA estimates that more than 5.5 million children lived in food-insecure households in 2021. Not having consistent access to enough food can affect cognitive abilities, overall health, moods, and attention spans—not to mention the psychological effects of living with scarcity.
Stacker compiled a list of counties in Texas with the highest rate of food insecure children using data from Feeding America. Counties are ranked by highest percent of children with food insecurity as of 2020. Texas has a child food insecurity rate of 18.9%, which ranks #7 highest among all states.
States with the highest rate of food insecure children
#1. Louisiana: 21.5%
#2. New Mexico: 20.5%
#3. Mississippi: 20.4%
#4. Alabama: 19.8%
#5. Arkansas: 19.7%
States with the lowest rate of food insecure children
#1. North Dakota: 8.1%
#2. Massachusetts: 8.8%
#3. New Jersey: 9.0%
#4. Minnesota: 9.3%
#5. New Hampshire: 9.5%
Read on to see where food insecurity is most prevalent in Texas.
![]()

Larry D. Moore // Wikimedia Commons
#50. San Patricio County
– Child food insecurity rate: 25.4% (4,570 total)
— 9.3% higher than national average
– Food insecurity rate: 16.2% (10,840 total)
— 4.4% higher than national average
– Annual food budget shortfall: $5,021,000
— Cost per meal: $2.88
Renelibrary // Wikimedia Commons
#49. Swisher County
– Child food insecurity rate: 25.4% (470 total)
— 9.3% higher than national average
– Food insecurity rate: 17.6% (1,300 total)
— 5.8% higher than national average
– Annual food budget shortfall: $614,000
— Cost per meal: $2.94

Aualliso // Wikimedia Commons
#48. Throckmorton County
– Child food insecurity rate: 25.4% (80 total)
— 9.3% higher than national average
– Food insecurity rate: 18.4% (280 total)
— 6.6% higher than national average
– Annual food budget shortfall: $134,000
— Cost per meal: $2.97
Larry D. Moore // Wikimedia Commons
#47. Limestone County
– Child food insecurity rate: 25.5% (1,330 total)
— 9.4% higher than national average
– Food insecurity rate: 16.5% (3,860 total)
— 4.7% higher than national average
– Annual food budget shortfall: $1,798,000
— Cost per meal: $2.89

Larry D. Moore // Wikimedia Commons
#46. Refugio County
– Child food insecurity rate: 25.6% (420 total)
— 9.5% higher than national average
– Food insecurity rate: 15.8% (1,110 total)
— 4.0% higher than national average
– Annual food budget shortfall: $553,000
— Cost per meal: $3.10

Larry D. Moore // Wikimedia Commons
#45. Angelina County
– Child food insecurity rate: 25.7% (5,710 total)
— 9.6% higher than national average
– Food insecurity rate: 17.4% (15,170 total)
— 5.6% higher than national average
– Annual food budget shortfall: $7,065,000
— Cost per meal: $2.89
Renelibrary // Wikimedia Commons
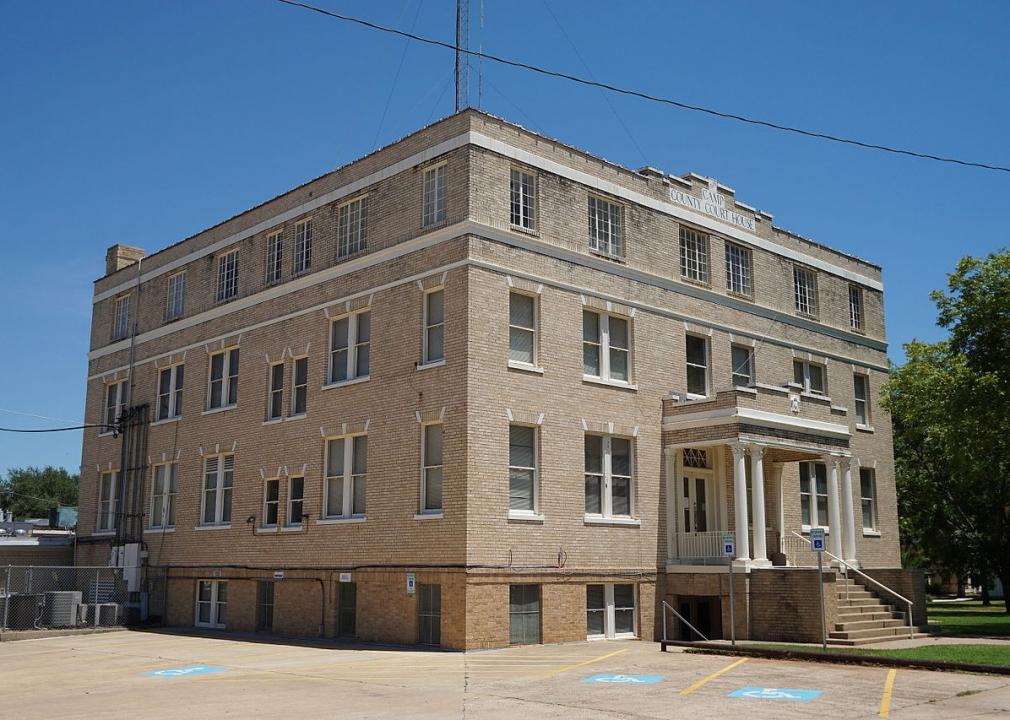
#44. Camp County
– Child food insecurity rate: 25.8% (880 total)
— 9.7% higher than national average
– Food insecurity rate: 16.7% (2,160 total)
— 4.9% higher than national average
– Annual food budget shortfall: $948,000
— Cost per meal: $2.73

Larry D. Moore // Wikimedia Commons
#43. Cochran County
– Child food insecurity rate: 26.0% (200 total)
— 9.9% higher than national average
– Food insecurity rate: 19.0% (540 total)
— 7.2% higher than national average
– Annual food budget shortfall: $261,000
— Cost per meal: $3.01

Aualliso // Wikimedia Commons
#42. Terry County
– Child food insecurity rate: 26.3% (900 total)
— 10.2% higher than national average
– Food insecurity rate: 17.2% (2,140 total)
— 5.4% higher than national average
– Annual food budget shortfall: $1,036,000
— Cost per meal: $3.01
Renelibrary // Wikimedia Commons
#41. Cass County
– Child food insecurity rate: 26.4% (1,770 total)
— 10.3% higher than national average
– Food insecurity rate: 17.4% (5,230 total)
— 5.6% higher than national average
– Annual food budget shortfall: $2,508,000
— Cost per meal: $2.98

Library of Congress
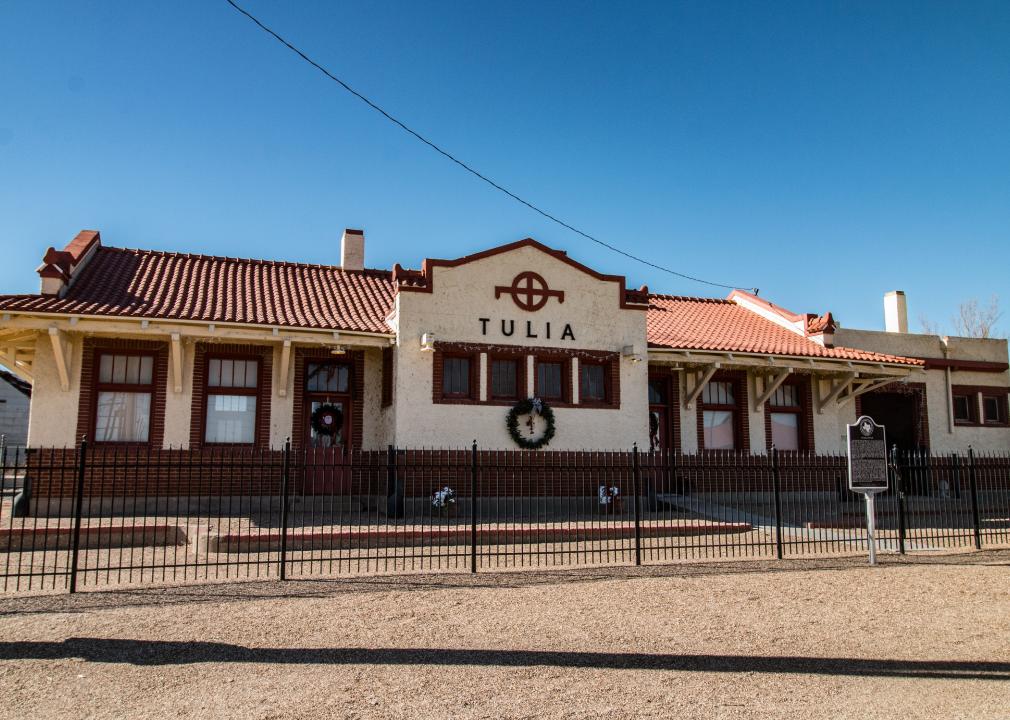
#40. Dawson County
– Child food insecurity rate: 26.5% (880 total)
— 10.4% higher than national average
– Food insecurity rate: 18.1% (2,330 total)
— 6.3% higher than national average
– Annual food budget shortfall: $1,215,000
— Cost per meal: $3.24

Larry D. Moore // Wikimedia Commons
#39. Wilbarger County
– Child food insecurity rate: 26.5% (750 total)
— 10.4% higher than national average
– Food insecurity rate: 18.4% (2,340 total)
— 6.6% higher than national average
– Annual food budget shortfall: $1,135,000
— Cost per meal: $3.01

Aualliso // Wikimedia Commons
#38. Cottle County
– Child food insecurity rate: 26.6% (120 total)
— 10.5% higher than national average
– Food insecurity rate: 19.5% (320 total)
— 7.7% higher than national average
– Annual food budget shortfall: $155,000
— Cost per meal: $3.01

Renelibrary // Wikimedia Commons
#37. Houston County
– Child food insecurity rate: 26.8% (1,200 total)
— 10.7% higher than national average
– Food insecurity rate: 16.9% (3,880 total)
— 5.1% higher than national average
– Annual food budget shortfall: $1,707,000
— Cost per meal: $2.73
Larry D. Moore // Wikimedia Commons
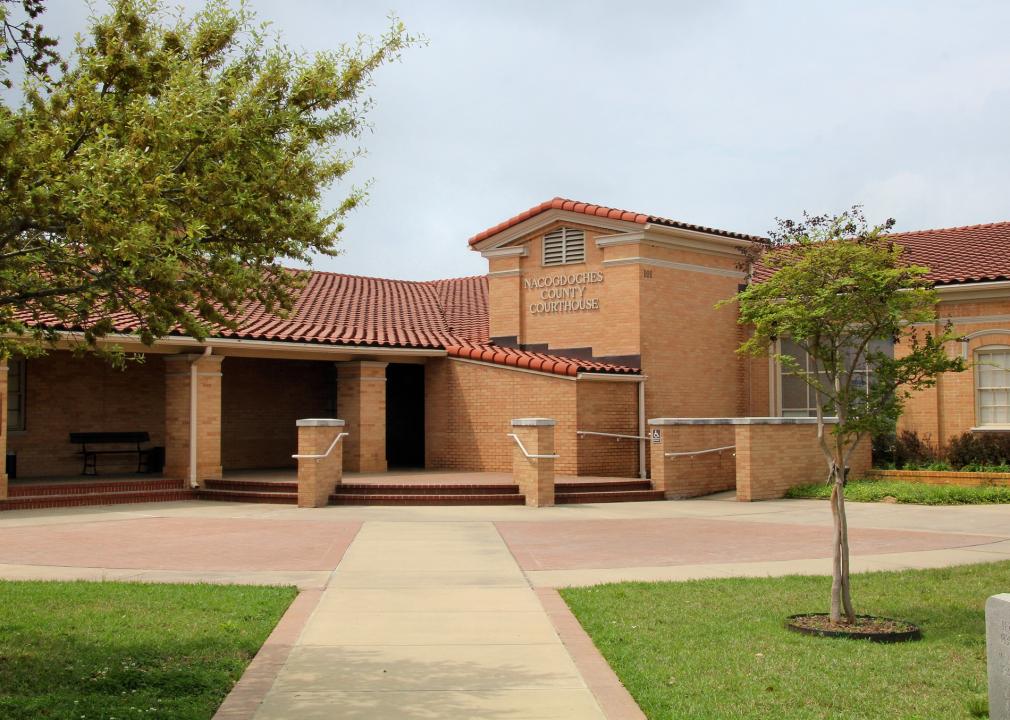
#36. Nacogdoches County
– Child food insecurity rate: 26.8% (4,050 total)
— 10.7% higher than national average
– Food insecurity rate: 18.6% (12,130 total)
— 6.8% higher than national average
– Annual food budget shortfall: $5,931,000
— Cost per meal: $3.04

Larry D. Moore // Wikimedia Commons
#35. Bee County
– Child food insecurity rate: 27.0% (1,880 total)
— 10.9% higher than national average
– Food insecurity rate: 16.9% (5,500 total)
— 5.1% higher than national average
– Annual food budget shortfall: $2,498,000
— Cost per meal: $2.82

Larry D. Moore // Wikimedia Commons
#34. Falls County
– Child food insecurity rate: 27.2% (1,000 total)
— 11.1% higher than national average
– Food insecurity rate: 18.3% (3,160 total)
— 6.5% higher than national average
– Annual food budget shortfall: $1,373,000
— Cost per meal: $2.70

Larry D. Moore // Wikimedia Commons
#33. Matagorda County
– Child food insecurity rate: 27.2% (2,600 total)
— 11.1% higher than national average
– Food insecurity rate: 17.4% (6,400 total)
— 5.6% higher than national average
– Annual food budget shortfall: $2,968,000
— Cost per meal: $2.88

25or6to4 // Wikimedia Commons
#32. Kleberg County
– Child food insecurity rate: 27.3% (2,050 total)
— 11.2% higher than national average
– Food insecurity rate: 17.9% (5,490 total)
— 6.1% higher than national average
– Annual food budget shortfall: $2,578,000
— Cost per meal: $2.92

Jim Evans // Wikimedia Commons
#31. Polk County
– Child food insecurity rate: 27.3% (2,770 total)
— 11.2% higher than national average
– Food insecurity rate: 18.2% (9,150 total)
— 6.4% higher than national average
– Annual food budget shortfall: $4,233,000
— Cost per meal: $2.87
Larry D. Moore // Wikimedia Commons
#30. Hudspeth County
– Child food insecurity rate: 27.4% (310 total)
— 11.3% higher than national average
– Food insecurity rate: 18.1% (850 total)
— 6.3% higher than national average
– Annual food budget shortfall: $406,000
— Cost per meal: $2.96
Larry D. Moore // Wikimedia Commons
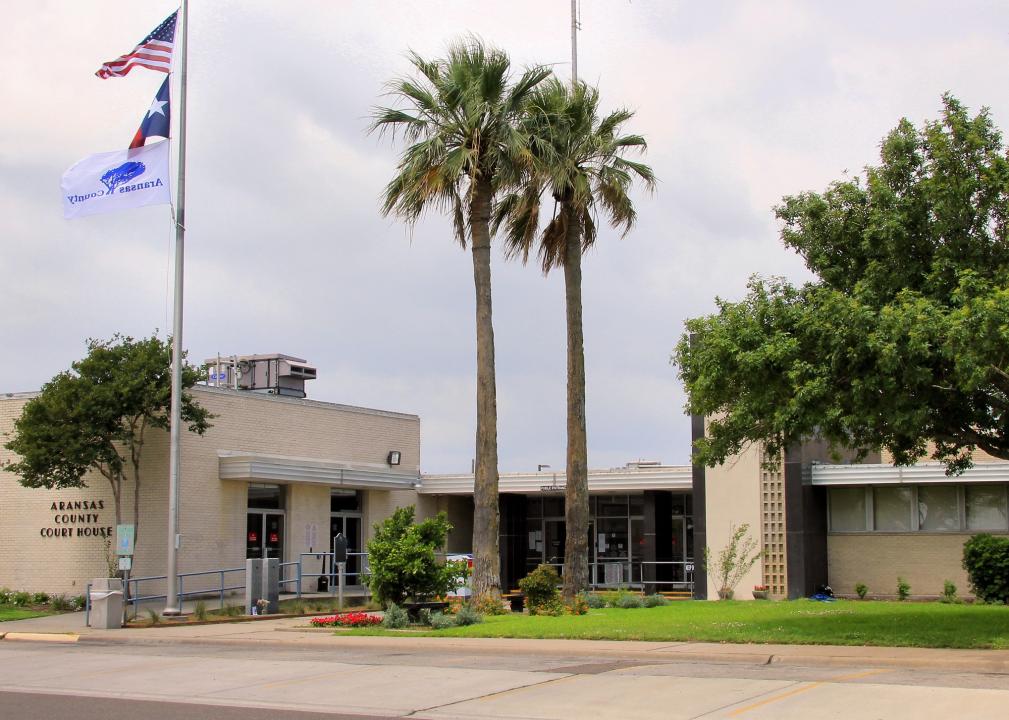
#29. Aransas County
– Child food insecurity rate: 27.6% (1,340 total)
— 11.5% higher than national average
– Food insecurity rate: 18.6% (4,500 total)
— 6.8% higher than national average
– Annual food budget shortfall: $2,244,000
— Cost per meal: $3.10

Aualliso // Wikimedia Commons
#28. Garza County
– Child food insecurity rate: 27.6% (230 total)
— 11.5% higher than national average
– Food insecurity rate: 16.9% (1,020 total)
— 5.1% higher than national average
– Annual food budget shortfall: $532,000
— Cost per meal: $3.24

Billy Hathorn // Wikimedia Commons
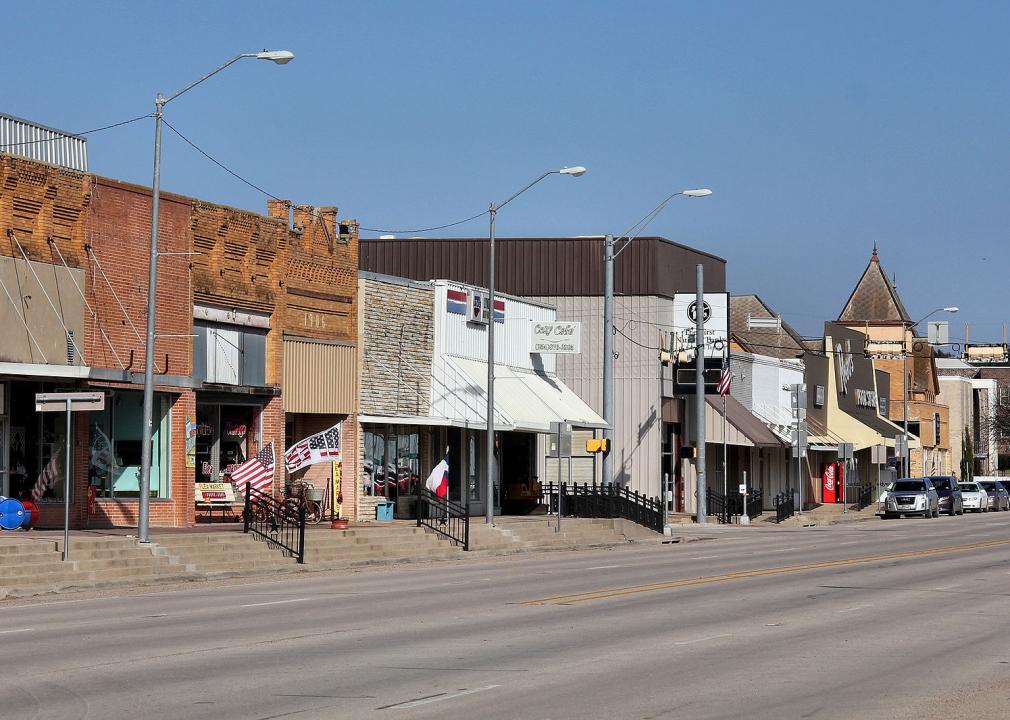
#27. Shelby County
– Child food insecurity rate: 28.1% (1,860 total)
— 12.0% higher than national average
– Food insecurity rate: 17.8% (4,500 total)
— 6.0% higher than national average
– Annual food budget shortfall: $2,148,000
— Cost per meal: $2.96

Canva
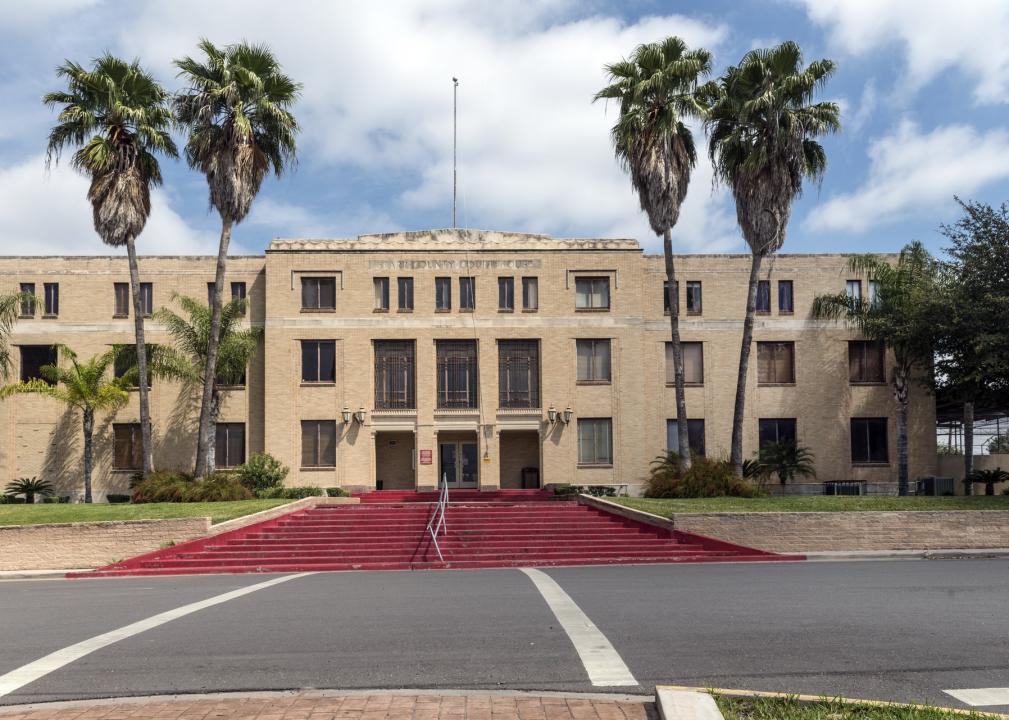
#26. Cameron County
– Child food insecurity rate: 28.3% (36,370 total)
— 12.2% higher than national average
– Food insecurity rate: 17.9% (75,390 total)
— 6.1% higher than national average
– Annual food budget shortfall: $29,708,000
— Cost per meal: $2.45

Jpo tx113 // Wikimedia Commons
#25. Trinity County
– Child food insecurity rate: 28.6% (840 total)
— 12.5% higher than national average
– Food insecurity rate: 19.2% (2,830 total)
— 7.4% higher than national average
– Annual food budget shortfall: $1,245,000
— Cost per meal: $2.73

Larry D. Moore // Wikimedia Commons
#24. Tyler County
– Child food insecurity rate: 28.6% (1,180 total)
— 12.5% higher than national average
– Food insecurity rate: 19.7% (4,240 total)
— 7.9% higher than national average
– Annual food budget shortfall: $1,976,000
— Cost per meal: $2.89

Aualliso // Wikimedia Commons
#23. Kinney County
– Child food insecurity rate: 28.9% (130 total)
— 12.8% higher than national average
– Food insecurity rate: 16.2% (600 total)
— 4.4% higher than national average
– Annual food budget shortfall: $230,000
— Cost per meal: $2.39

Larry D. Moore // Wikimedia Commons
#22. Sabine County
– Child food insecurity rate: 29.2% (560 total)
— 13.1% higher than national average
– Food insecurity rate: 20.8% (2,180 total)
— 9.0% higher than national average
– Annual food budget shortfall: $1,036,000
— Cost per meal: $2.95

Wrbalusek // Wikimedia Commons
#21. Jasper County
– Child food insecurity rate: 29.4% (2,500 total)
— 13.3% higher than national average
– Food insecurity rate: 19.6% (6,970 total)
— 7.8% higher than national average
– Annual food budget shortfall: $3,249,000
— Cost per meal: $2.90
Distrito Medico Monterrey // Flickr
#20. Hidalgo County
– Child food insecurity rate: 29.7% (83,470 total)
— 13.6% higher than national average
– Food insecurity rate: 19.1% (164,720 total)
— 7.3% higher than national average
– Annual food budget shortfall: $65,298,000
— Cost per meal: $2.46

Larry D. Moore // Wikimedia Commons
#19. Morris County
– Child food insecurity rate: 29.7% (850 total)
— 13.6% higher than national average
– Food insecurity rate: 18.9% (2,340 total)
— 7.1% higher than national average
– Annual food budget shortfall: $1,027,000
— Cost per meal: $2.73

Larry D. Moore // Wikimedia Commons
#18. Duval County
– Child food insecurity rate: 29.8% (860 total)
— 13.7% higher than national average
– Food insecurity rate: 17.9% (2,000 total)
— 6.1% higher than national average
– Annual food budget shortfall: $918,000
— Cost per meal: $2.85

Renelibrary // Wikimedia Commons
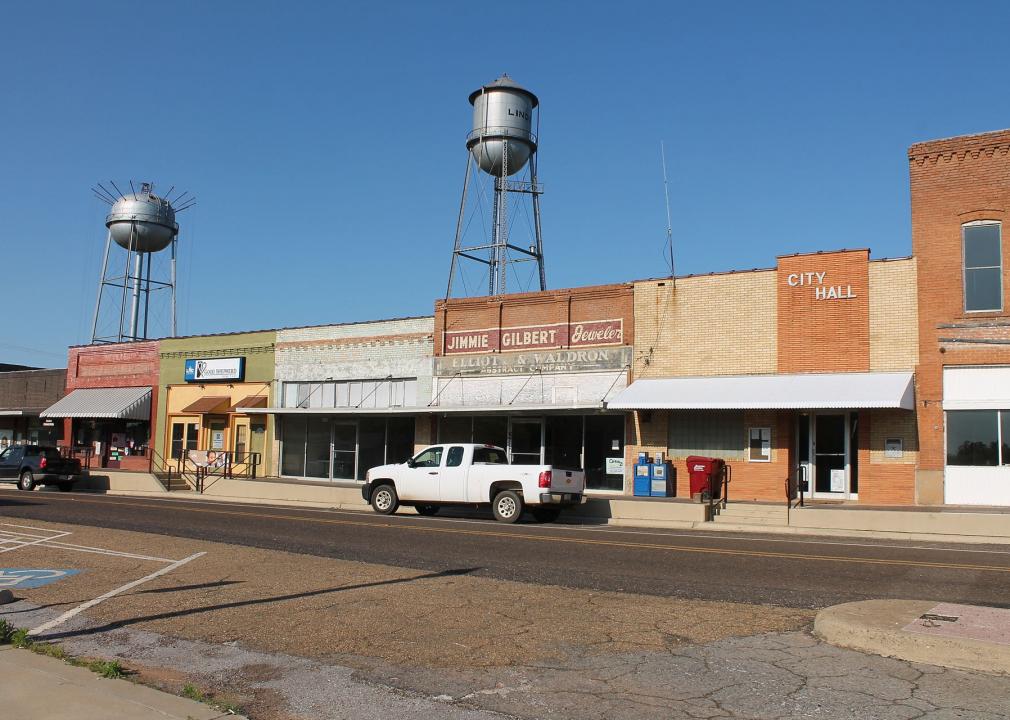
#17. Marion County
– Child food insecurity rate: 29.9% (540 total)
— 13.8% higher than national average
– Food insecurity rate: 18.1% (1,800 total)
— 6.3% higher than national average
– Annual food budget shortfall: $861,000
— Cost per meal: $2.97

Matthew T Rader // Wikimedia Commons
#16. Willacy County
– Child food insecurity rate: 30.9% (1,570 total)
— 14.8% higher than national average
– Food insecurity rate: 19.0% (4,080 total)
— 7.2% higher than national average
– Annual food budget shortfall: $1,499,000
— Cost per meal: $2.28

Larry D. Moore // Wikimedia Commons
#15. Jim Wells County
– Child food insecurity rate: 31.3% (3,560 total)
— 15.2% higher than national average
– Food insecurity rate: 18.2% (7,420 total)
— 6.4% higher than national average
– Annual food budget shortfall: $3,408,000
— Cost per meal: $2.85

Aualliso // Wikimedia Commons
#14. Jeff Davis County
– Child food insecurity rate: 31.4% (100 total)
— 15.3% higher than national average
– Food insecurity rate: 15.7% (350 total)
— 3.9% higher than national average
– Annual food budget shortfall: $159,000
— Cost per meal: $2.82

Larry D. Moore // Wikimedia Commons
#13. Newton County
– Child food insecurity rate: 31.4% (860 total)
— 15.3% higher than national average
– Food insecurity rate: 20.8% (2,860 total)
— 9.0% higher than national average
– Annual food budget shortfall: $1,333,000
— Cost per meal: $2.90

JERRYE & ROY KLOTZ M.D. // Wikimedia Commons
#12. Maverick County
– Child food insecurity rate: 31.6% (5,740 total)
— 15.5% higher than national average
– Food insecurity rate: 20.1% (11,660 total)
— 8.3% higher than national average
– Annual food budget shortfall: $4,211,000
— Cost per meal: $2.24

Public Domain
#11. Jefferson County
– Child food insecurity rate: 31.8% (19,360 total)
— 15.7% higher than national average
– Food insecurity rate: 18.2% (46,070 total)
— 6.4% higher than national average
– Annual food budget shortfall: $20,866,000
— Cost per meal: $2.81
Larry D. Moore // Wikimedia Commons
#10. Real County
– Child food insecurity rate: 32.3% (250 total)
— 16.2% higher than national average
– Food insecurity rate: 21.3% (730 total)
— 9.5% higher than national average
– Annual food budget shortfall: $282,000
— Cost per meal: $2.40

Billy Hathorn // Wikimedia Commons
#9. Dimmit County
– Child food insecurity rate: 33.0% (960 total)
— 16.9% higher than national average
– Food insecurity rate: 23.1% (2,370 total)
— 11.3% higher than national average
– Annual food budget shortfall: $856,000
— Cost per meal: $2.24

Billy Hathorn // Wikimedia Commons
#8. Zapata County
– Child food insecurity rate: 33.1% (1,570 total)
— 17.0% higher than national average
– Food insecurity rate: 21.4% (3,040 total)
— 9.6% higher than national average
– Annual food budget shortfall: $1,331,000
— Cost per meal: $2.72

Renelibrary // Wikimedia Commons
#7. San Augustine County
– Child food insecurity rate: 34.3% (560 total)
— 18.2% higher than national average
– Food insecurity rate: 23.0% (1,900 total)
— 11.2% higher than national average
– Annual food budget shortfall: $907,000
— Cost per meal: $2.96
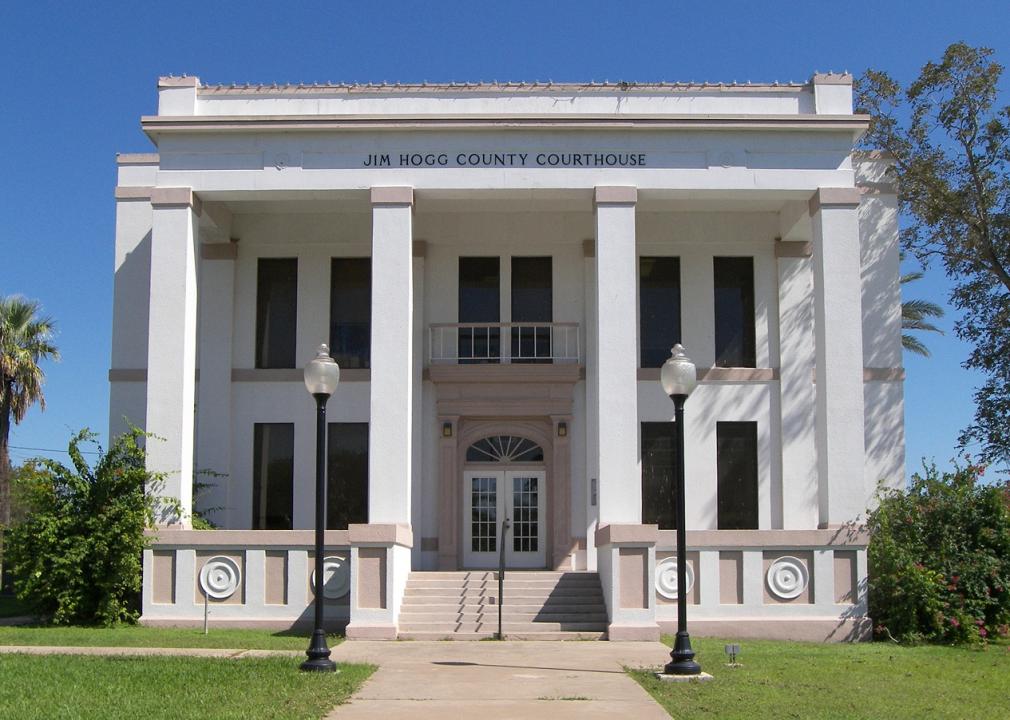
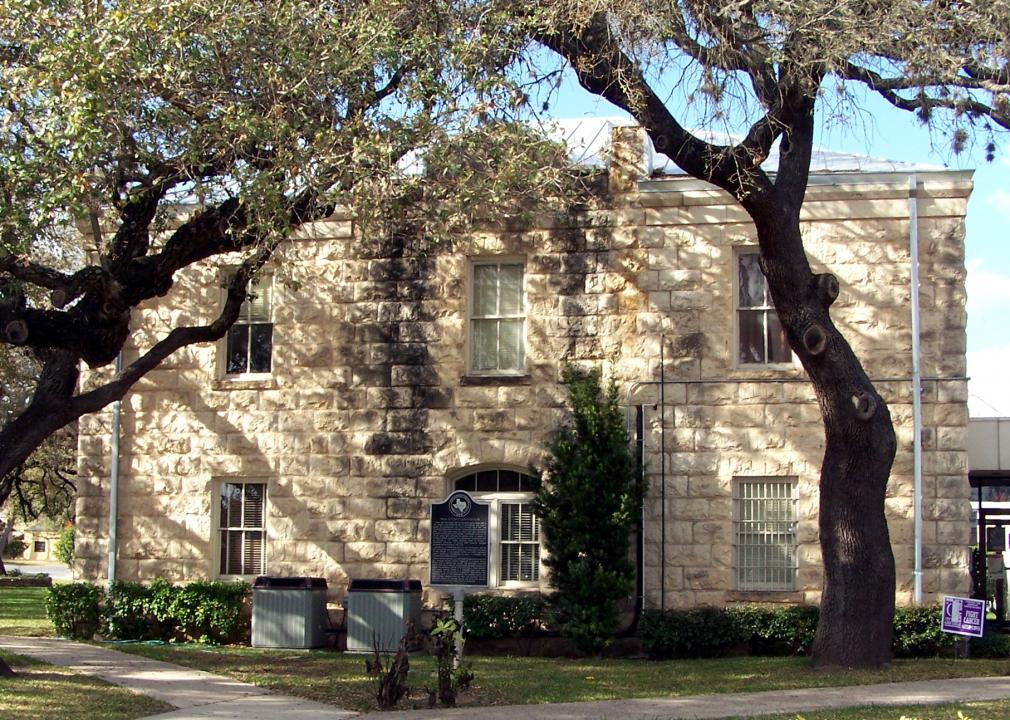
Larry D. Moore // Wikimedia Commons
#6. Jim Hogg County
– Child food insecurity rate: 34.9% (630 total)
— 18.8% higher than national average
– Food insecurity rate: 19.7% (1,020 total)
— 7.9% higher than national average
– Annual food budget shortfall: $468,000
— Cost per meal: $2.85

Travis K. Witt // Wikimedia Commons
#5. Culberson County
– Child food insecurity rate: 36.4% (210 total)
— 20.3% higher than national average
– Food insecurity rate: 19.8% (430 total)
— 8.0% higher than national average
– Annual food budget shortfall: $205,000
— Cost per meal: $2.96
Carol M. Highsmith // Wikimedia Commons
#4. Starr County
– Child food insecurity rate: 37.3% (7,850 total)
— 21.2% higher than national average
– Food insecurity rate: 23.6% (15,100 total)
— 11.8% higher than national average
– Annual food budget shortfall: $6,613,000
— Cost per meal: $2.72

Canva
#3. Brooks County
– Child food insecurity rate: 39.8% (660 total)
— 23.7% higher than national average
– Food insecurity rate: 23.9% (1,700 total)
— 12.1% higher than national average
– Annual food budget shortfall: $798,000
— Cost per meal: $2.92

Billy Hathorn // Wikimedia Commons
#2. Zavala County
– Child food insecurity rate: 41.3% (1,430 total)
— 25.2% higher than national average
– Food insecurity rate: 22.8% (2,720 total)
— 11.0% higher than national average
– Annual food budget shortfall: $1,049,000
— Cost per meal: $2.40

Talshiarr // Wikimedia Commons
#1. Presidio County
– Child food insecurity rate: 44.1% (800 total)
— 28.0% higher than national average
– Food insecurity rate: 28.7% (1,950 total)
— 16.9% higher than national average
– Annual food budget shortfall: $887,000
— Cost per meal: $2.82
