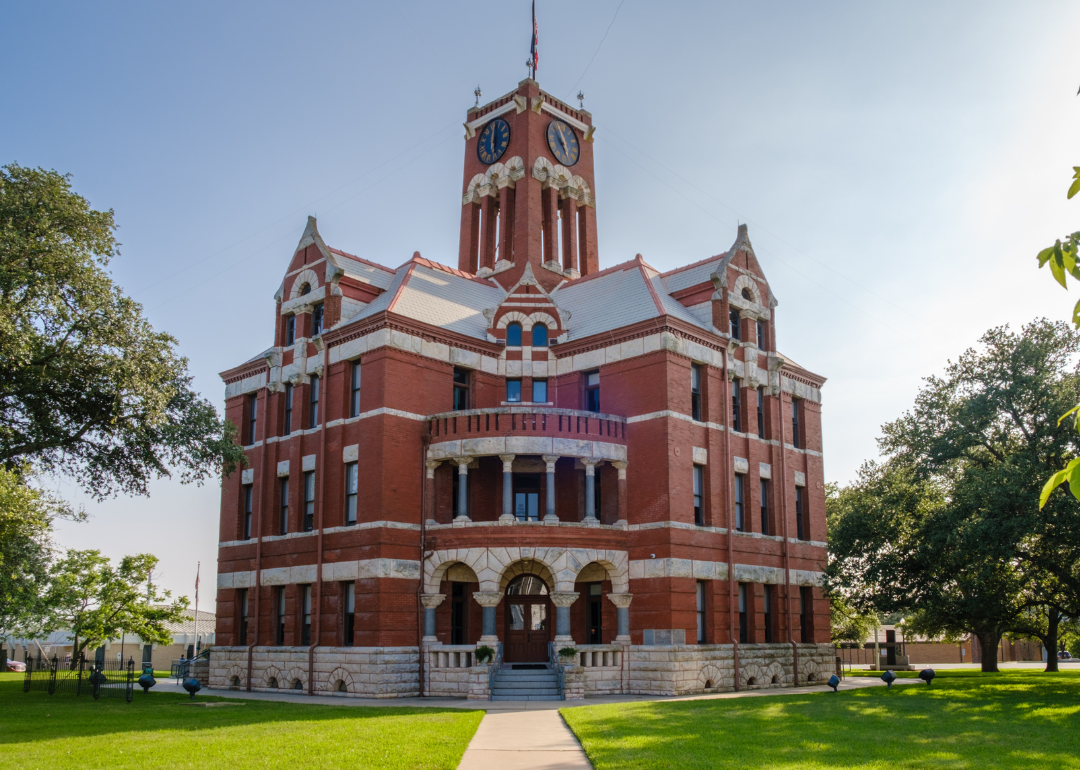
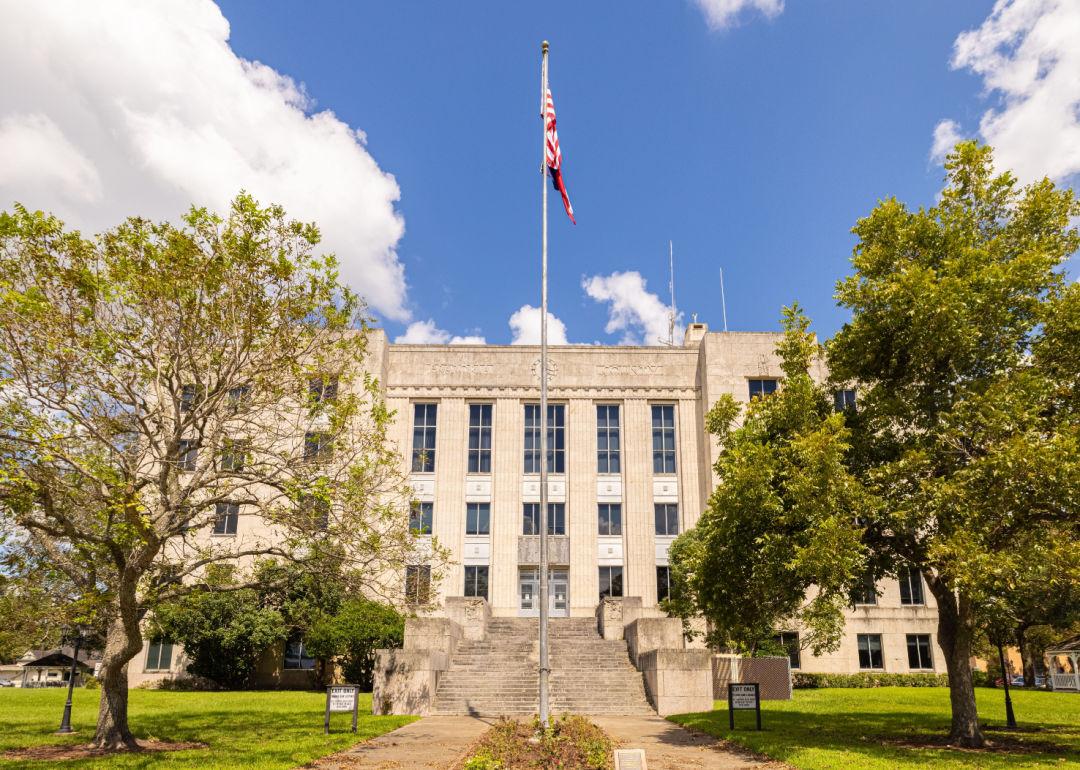
Counties with the worst commutes in Texas
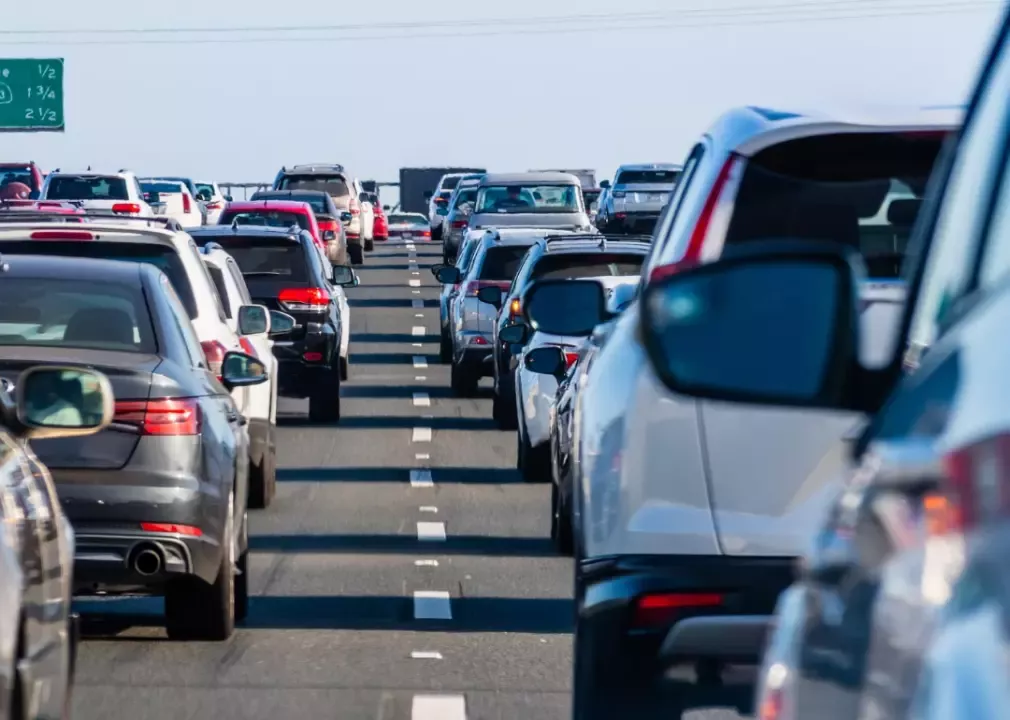
Sundry Photography // Shutterstock
Counties with the worst commutes in Texas
Commuting easily ranks as one of the least enjoyable parts of a person’s day. Commuters encounter more physical health problems, and low-income commuters are less likely to gain financial stability—among a host of other negative impacts. And yet, America’s commutes keep getting longer as people move farther away from the office, according to Census Bureau data.
Stacker compiled a list of counties with the worst commutes in Texas, using 2021 data from the Census Bureau. Counties are ranked by longest average commute time in 2021 among workers over the age of 16, excluding those who work from home. Think you have a long trip to work? Read on to compare it against the worst commutes statewide.
![]()

Canva
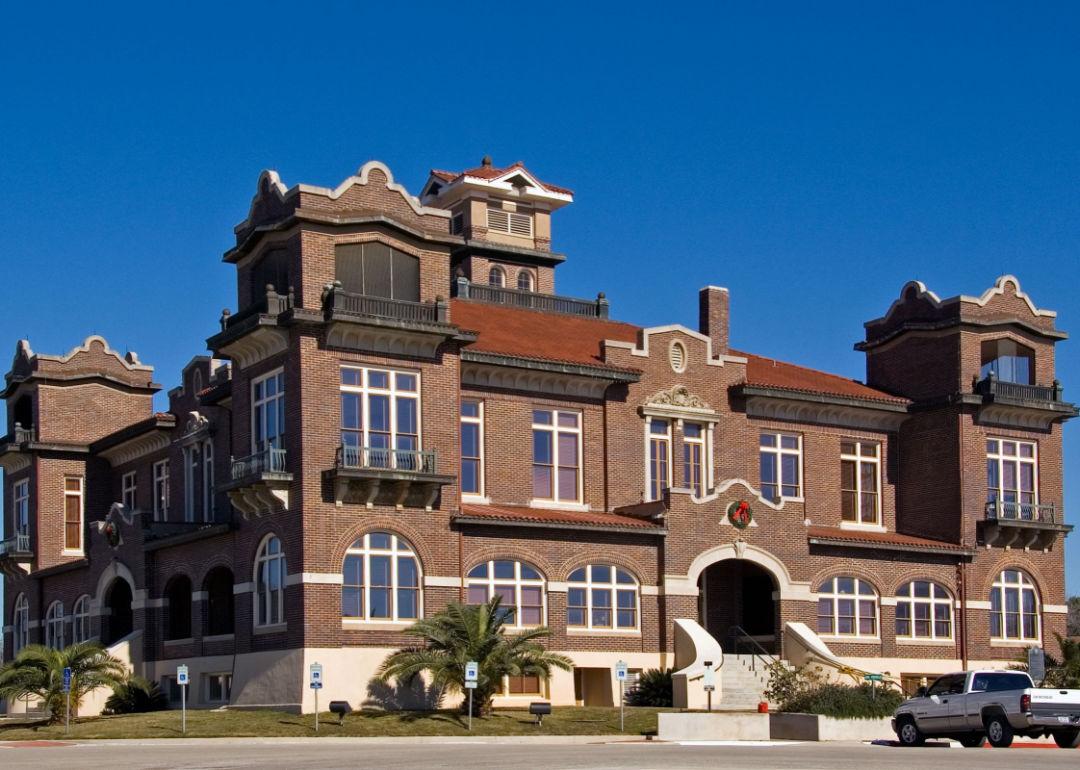
#49. Harris County (tie)
– Average commute to work: 29.1 minutes
– Share with commutes over an hour: 9.4%
– Share that worked outside their county of residence: 8%
– Means of transportation to work:
— Drove alone: 76.2%
— Carpooled: 9.9%
— Public transportation: 2.3%
— Walked: 1.4%
— Bicycle: 0.3%
— Taxicab, motorcycle, or other means: 1.8%
— Worked from home: 8.1%

Canva
#49. Waller County (tie)
– Average commute to work: 29.1 minutes
– Share with commutes over an hour: 12.1%
– Share that worked outside their county of residence: 61.7%
– Means of transportation to work:
— Drove alone: 79.5%
— Carpooled: 9.3%
— Public transportation: 0.5%
— Walked: 2.4%
— Bicycle: 0%
— Taxicab, motorcycle, or other means: 0.8%
— Worked from home: 7.4%
Canva
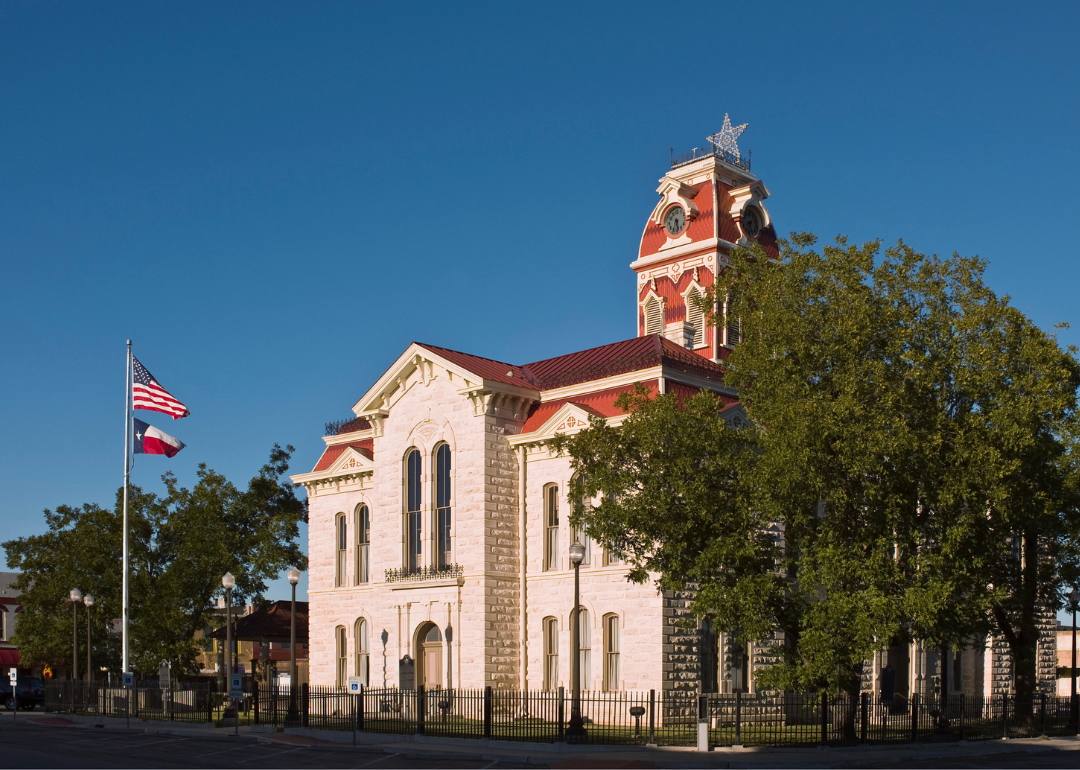
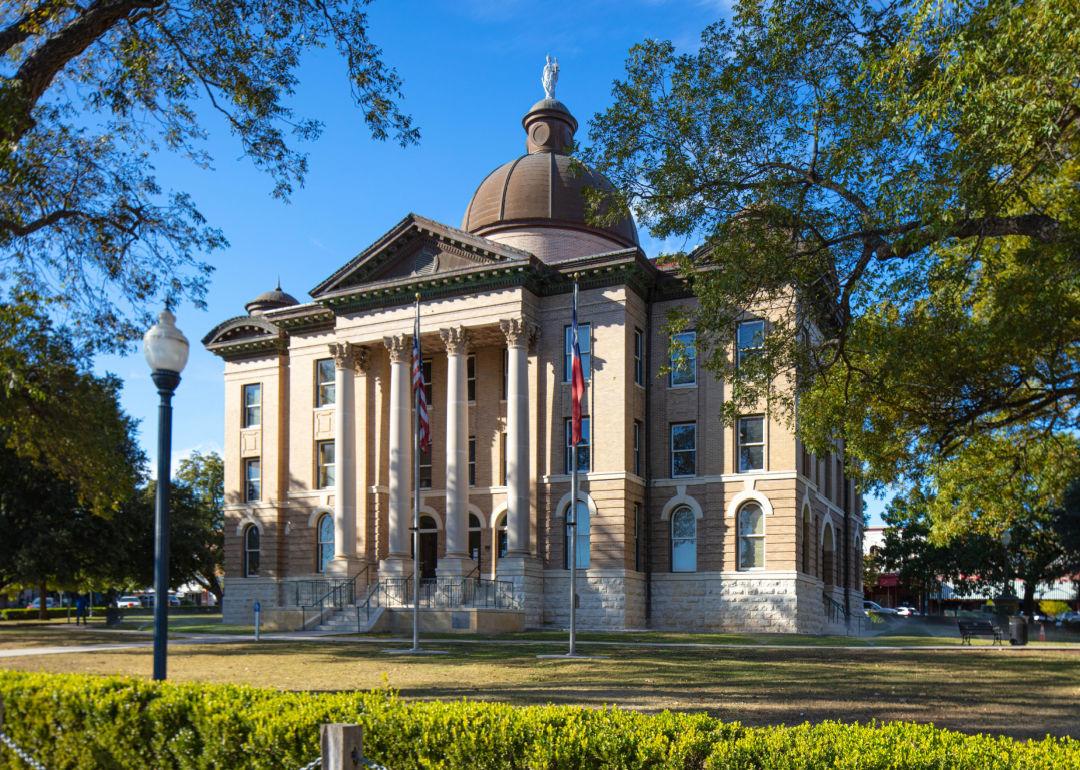
#47. Lampasas County (tie)
– Average commute to work: 29.3 minutes
– Share with commutes over an hour: 11.7%
– Share that worked outside their county of residence: 46%
– Means of transportation to work:
— Drove alone: 80%
— Carpooled: 12.2%
— Public transportation: 0%
— Walked: 1.9%
— Bicycle: 0%
— Taxicab, motorcycle, or other means: 1.3%
— Worked from home: 4.7%
Jacob Boomsma // Shutterstock
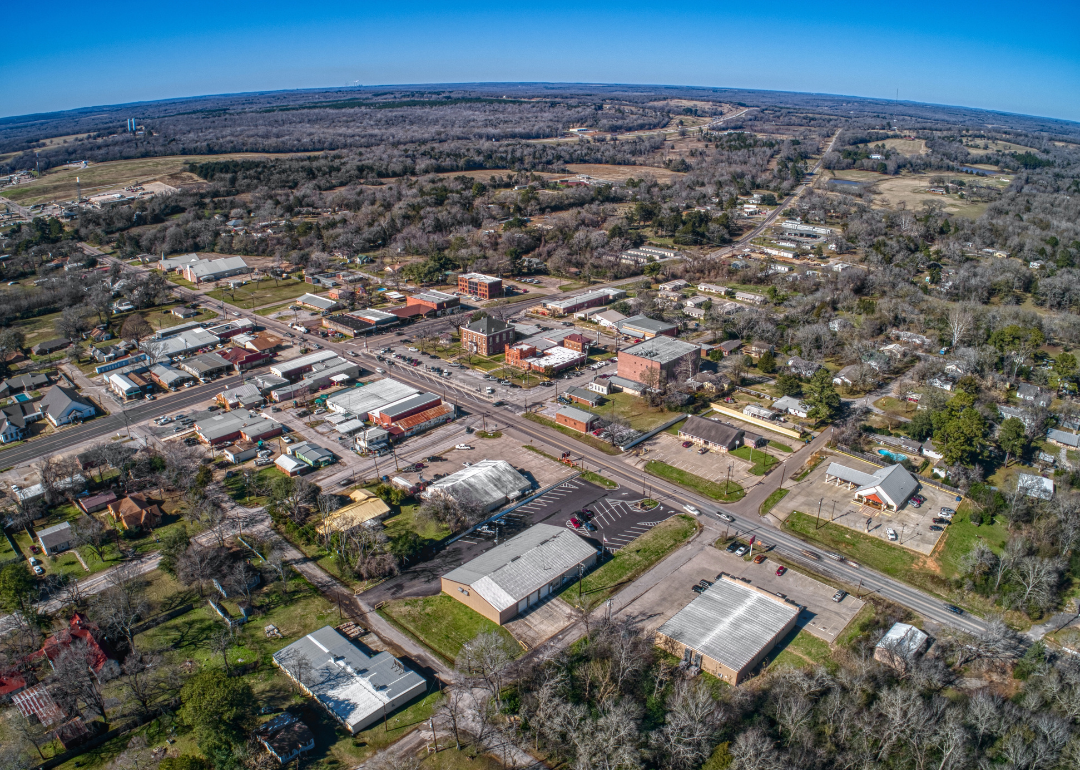
#47. Leon County (tie)
– Average commute to work: 29.3 minutes
– Share with commutes over an hour: 17.1%
– Share that worked outside their county of residence: 39.9%
– Means of transportation to work:
— Drove alone: 84.4%
— Carpooled: 9.3%
— Public transportation: 0%
— Walked: 0.8%
— Bicycle: 0.4%
— Taxicab, motorcycle, or other means: 1.6%
— Worked from home: 3.5%
Canva
#46. Hill County
– Average commute to work: 29.5 minutes
– Share with commutes over an hour: 12.4%
– Share that worked outside their county of residence: 43.3%
– Means of transportation to work:
— Drove alone: 81.2%
— Carpooled: 11.3%
— Public transportation: 0%
— Walked: 1.2%
— Bicycle: 0.1%
— Taxicab, motorcycle, or other means: 0.9%
— Worked from home: 5.2%
Canva
#45. Lee County
– Average commute to work: 29.7 minutes
– Share with commutes over an hour: 20%
– Share that worked outside their county of residence: 33%
– Means of transportation to work:
— Drove alone: 73.7%
— Carpooled: 7.5%
— Public transportation: 0.7%
— Walked: 2.7%
— Bicycle: 0.5%
— Taxicab, motorcycle, or other means: 4.6%
— Worked from home: 10.3%

underworld // Shutterstock
#44. Delta County
– Average commute to work: 29.8 minutes
– Share with commutes over an hour: 12.6%
– Share that worked outside their county of residence: 71.1%
– Means of transportation to work:
— Drove alone: 90.2%
— Carpooled: 4.8%
— Public transportation: 0.7%
— Walked: 0.3%
— Bicycle: 0.6%
— Taxicab, motorcycle, or other means: 0.4%
— Worked from home: 3.1%
Canva
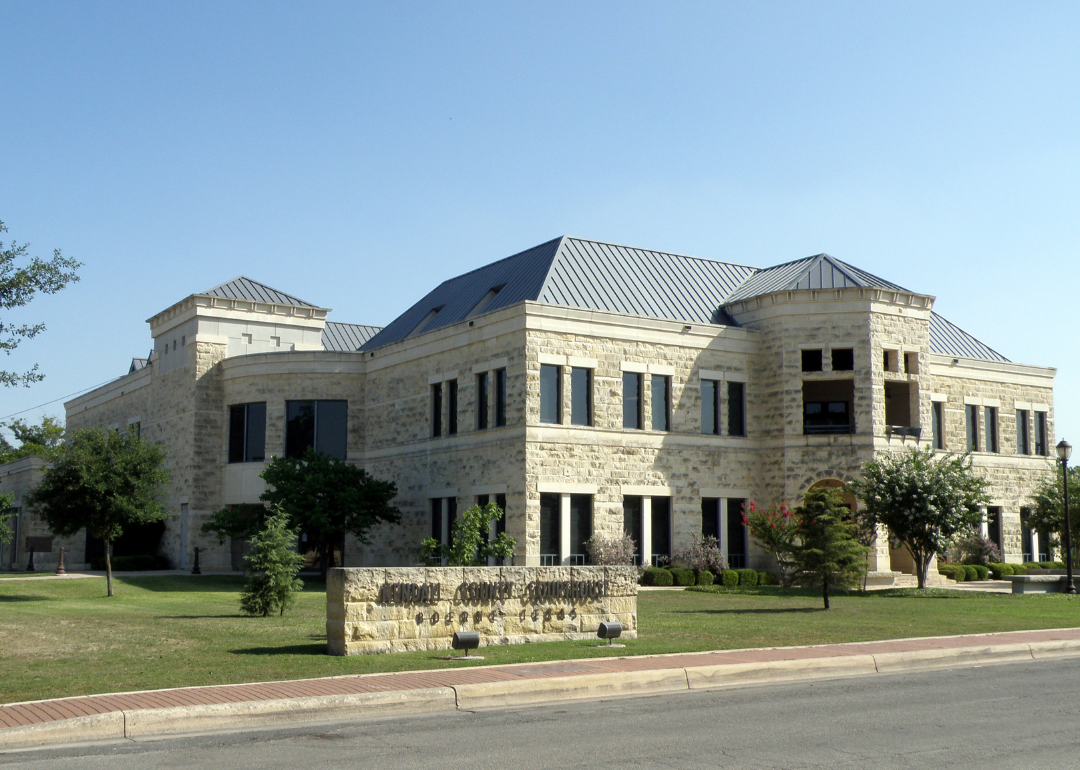
#43. Kendall County
– Average commute to work: 30 minutes
– Share with commutes over an hour: 11.7%
– Share that worked outside their county of residence: 40.6%
– Means of transportation to work:
— Drove alone: 72.9%
— Carpooled: 6.7%
— Public transportation: 0%
— Walked: 1.3%
— Bicycle: 0.2%
— Taxicab, motorcycle, or other means: 2.1%
— Worked from home: 16.8%
Canva
#42. Jack County
– Average commute to work: 30.1 minutes
– Share with commutes over an hour: 13%
– Share that worked outside their county of residence: 46%
– Means of transportation to work:
— Drove alone: 84.4%
— Carpooled: 8.8%
— Public transportation: 0%
— Walked: 1.3%
— Bicycle: 0%
— Taxicab, motorcycle, or other means: 0.8%
— Worked from home: 4.7%
Canva
#40. Ellis County (tie)
– Average commute to work: 30.2 minutes
– Share with commutes over an hour: 12.7%
– Share that worked outside their county of residence: 45.3%
– Means of transportation to work:
— Drove alone: 80.3%
— Carpooled: 10.1%
— Public transportation: 0.2%
— Walked: 0.8%
— Bicycle: 0%
— Taxicab, motorcycle, or other means: 0.6%
— Worked from home: 8%
Roberto Galan // Shutterstock
#40. Jasper County (tie)
– Average commute to work: 30.2 minutes
– Share with commutes over an hour: 17.4%
– Share that worked outside their county of residence: 36.6%
– Means of transportation to work:
— Drove alone: 81.2%
— Carpooled: 8.5%
— Public transportation: 1%
— Walked: 2.1%
— Bicycle: 0%
— Taxicab, motorcycle, or other means: 2.9%
— Worked from home: 4.3%
Canva
#39. Medina County
– Average commute to work: 30.4 minutes
– Share with commutes over an hour: 12.2%
– Share that worked outside their county of residence: 50.3%
– Means of transportation to work:
— Drove alone: 76.3%
— Carpooled: 13.3%
— Public transportation: 0%
— Walked: 2.1%
— Bicycle: 0.2%
— Taxicab, motorcycle, or other means: 1.4%
— Worked from home: 6.7%
Canva
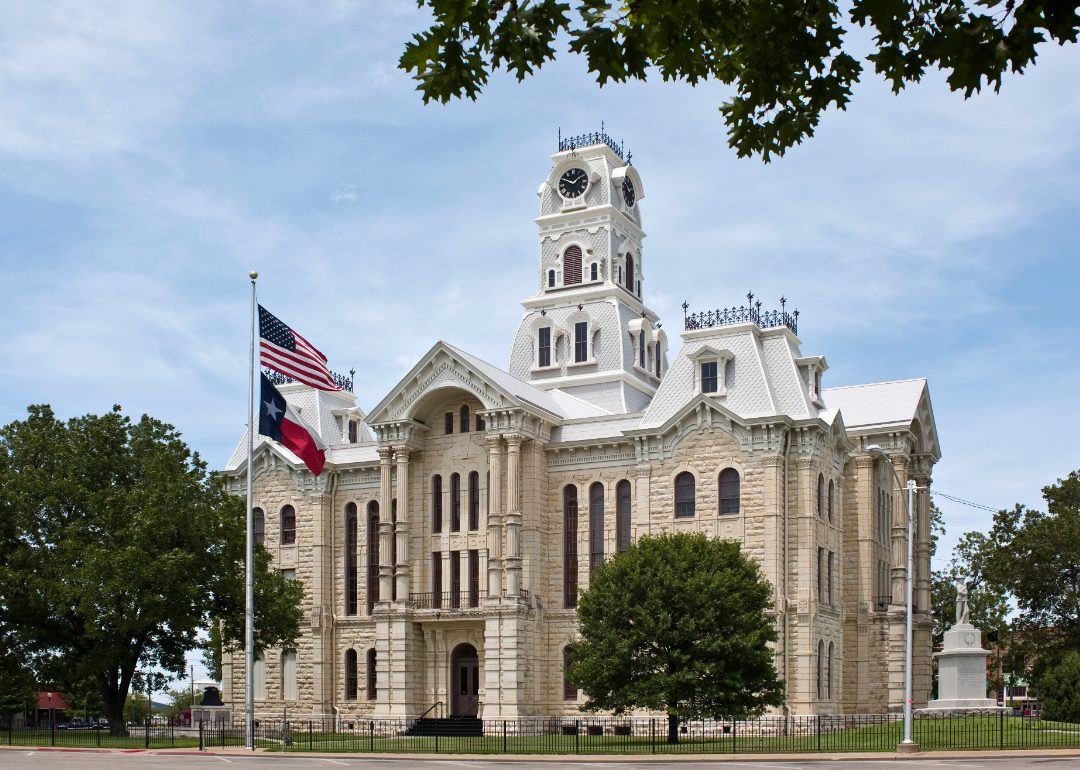
#37. Coleman County (tie)
– Average commute to work: 30.5 minutes
– Share with commutes over an hour: 10.1%
– Share that worked outside their county of residence: 40.2%
– Means of transportation to work:
— Drove alone: 78%
— Carpooled: 15.3%
— Public transportation: 0.3%
— Walked: 1.5%
— Bicycle: 0%
— Taxicab, motorcycle, or other means: 0.1%
— Worked from home: 4.8%
Canva
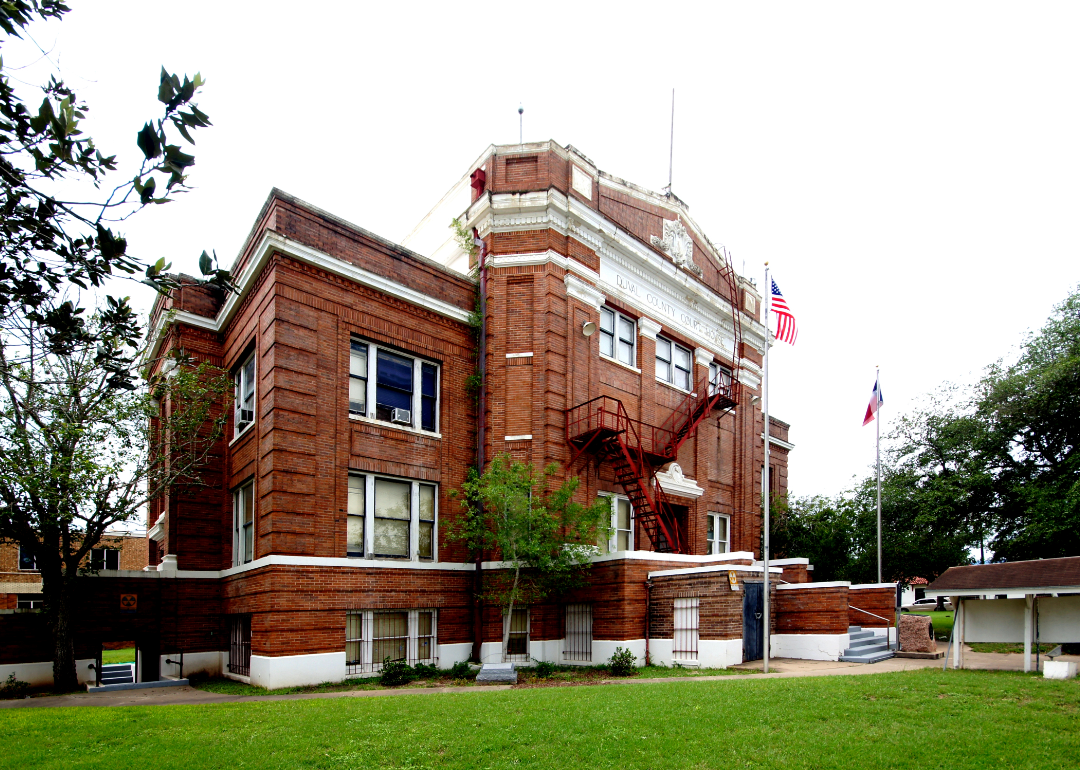
#37. Duval County (tie)
– Average commute to work: 30.5 minutes
– Share with commutes over an hour: 19.4%
– Share that worked outside their county of residence: 42.4%
– Means of transportation to work:
— Drove alone: 76.3%
— Carpooled: 13.8%
— Public transportation: 0%
— Walked: 1.2%
— Bicycle: 0%
— Taxicab, motorcycle, or other means: 2.3%
— Worked from home: 6.4%
Roberto Galan // Shutterstock
#33. Brazoria County (tie)
– Average commute to work: 30.9 minutes
– Share with commutes over an hour: 11.8%
– Share that worked outside their county of residence: 45.3%
– Means of transportation to work:
— Drove alone: 82.9%
— Carpooled: 7.9%
— Public transportation: 0.3%
— Walked: 0.6%
— Bicycle: 0.1%
— Taxicab, motorcycle, or other means: 0.9%
— Worked from home: 7.3%
Canva
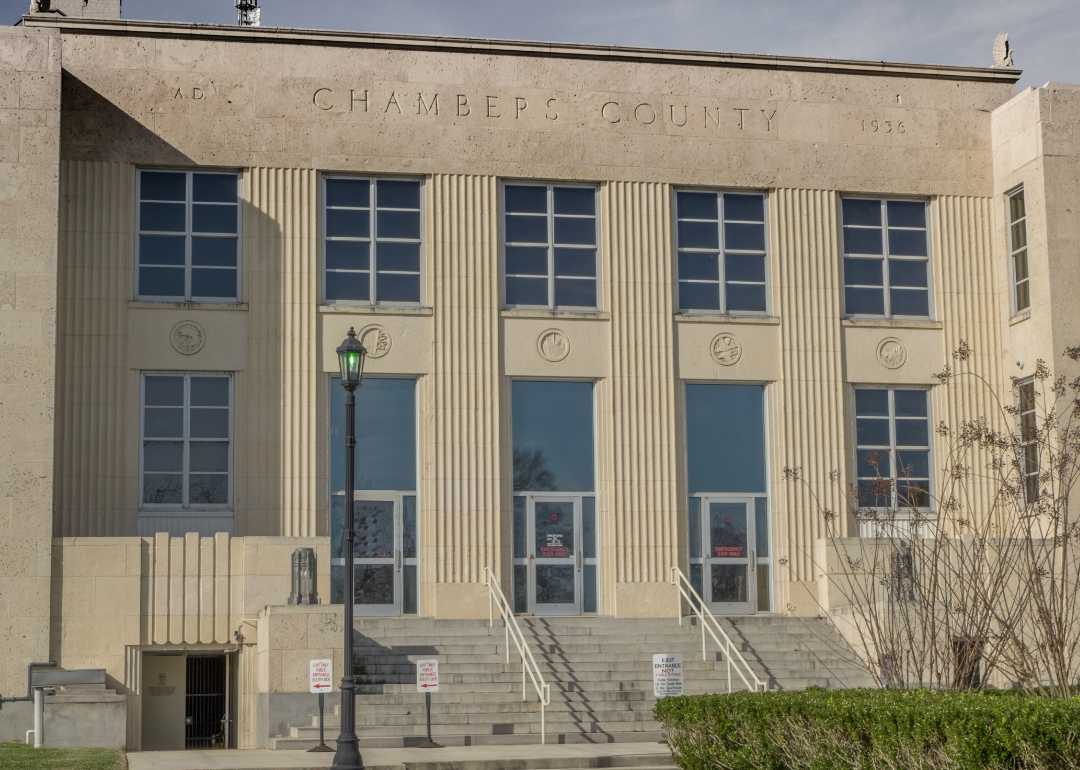
#33. Chambers County (tie)
– Average commute to work: 30.9 minutes
– Share with commutes over an hour: 12.2%
– Share that worked outside their county of residence: 63.1%
– Means of transportation to work:
— Drove alone: 87.5%
— Carpooled: 7.5%
— Public transportation: 0.4%
— Walked: 1.1%
— Bicycle: 0.2%
— Taxicab, motorcycle, or other means: 0.3%
— Worked from home: 2.9%
Canva
#33. Goliad County (tie)
– Average commute to work: 30.9 minutes
– Share with commutes over an hour: 11.1%
– Share that worked outside their county of residence: 54.8%
– Means of transportation to work:
— Drove alone: 78.8%
— Carpooled: 12.7%
— Public transportation: 0%
— Walked: 0.4%
— Bicycle: 0%
— Taxicab, motorcycle, or other means: 0%
— Worked from home: 8.1%
xradiophotog // Shutterstock
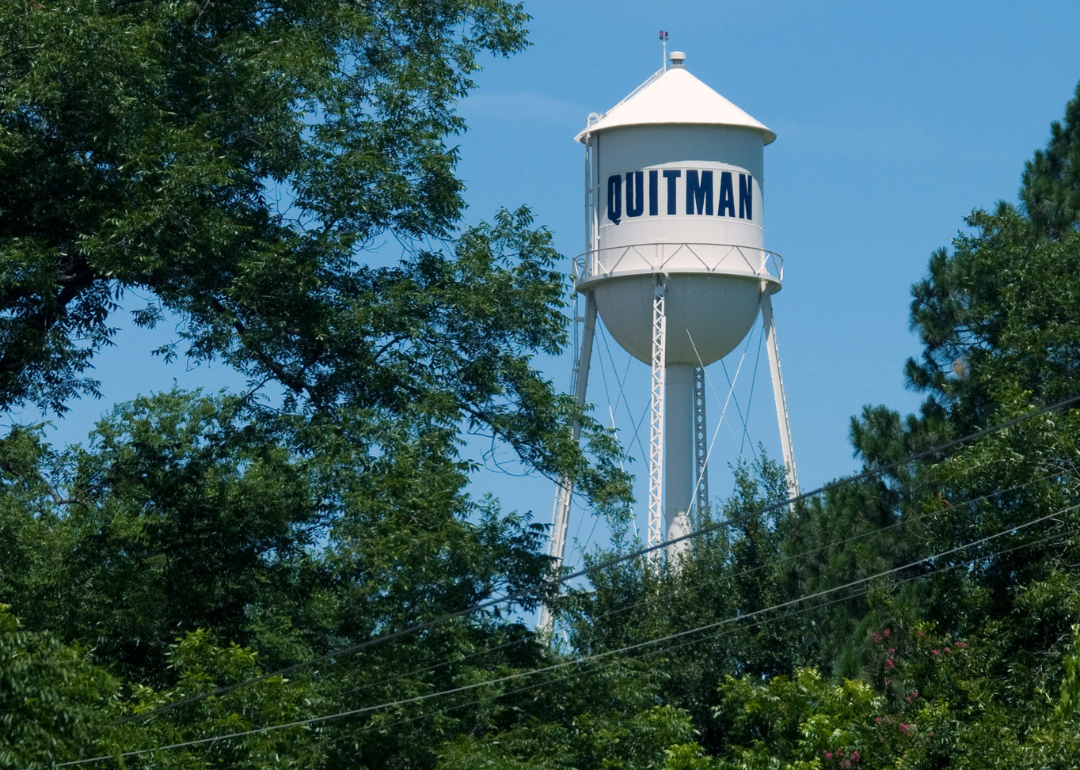
#33. Wood County (tie)
– Average commute to work: 30.9 minutes
– Share with commutes over an hour: 13%
– Share that worked outside their county of residence: 41.4%
– Means of transportation to work:
— Drove alone: 78.3%
— Carpooled: 11.8%
— Public transportation: 0.1%
— Walked: 1.9%
— Bicycle: 0%
— Taxicab, motorcycle, or other means: 1.1%
— Worked from home: 6.9%
xradiophotog // Shutterstock
#31. Atascosa County (tie)
– Average commute to work: 31 minutes
– Share with commutes over an hour: 10.2%
– Share that worked outside their county of residence: 49.9%
– Means of transportation to work:
— Drove alone: 79.6%
— Carpooled: 11.9%
— Public transportation: 0%
— Walked: 0.8%
— Bicycle: 0%
— Taxicab, motorcycle, or other means: 1.6%
— Worked from home: 6.1%
Roberto Galan // Shutterstock
#31. Hays County (tie)
– Average commute to work: 31 minutes
– Share with commutes over an hour: 13.4%
– Share that worked outside their county of residence: 45.7%
– Means of transportation to work:
— Drove alone: 75.6%
— Carpooled: 9.1%
— Public transportation: 0.3%
— Walked: 2%
— Bicycle: 0.3%
— Taxicab, motorcycle, or other means: 1.3%
— Worked from home: 11.4%
Edward H. Campbell // Shutterstock
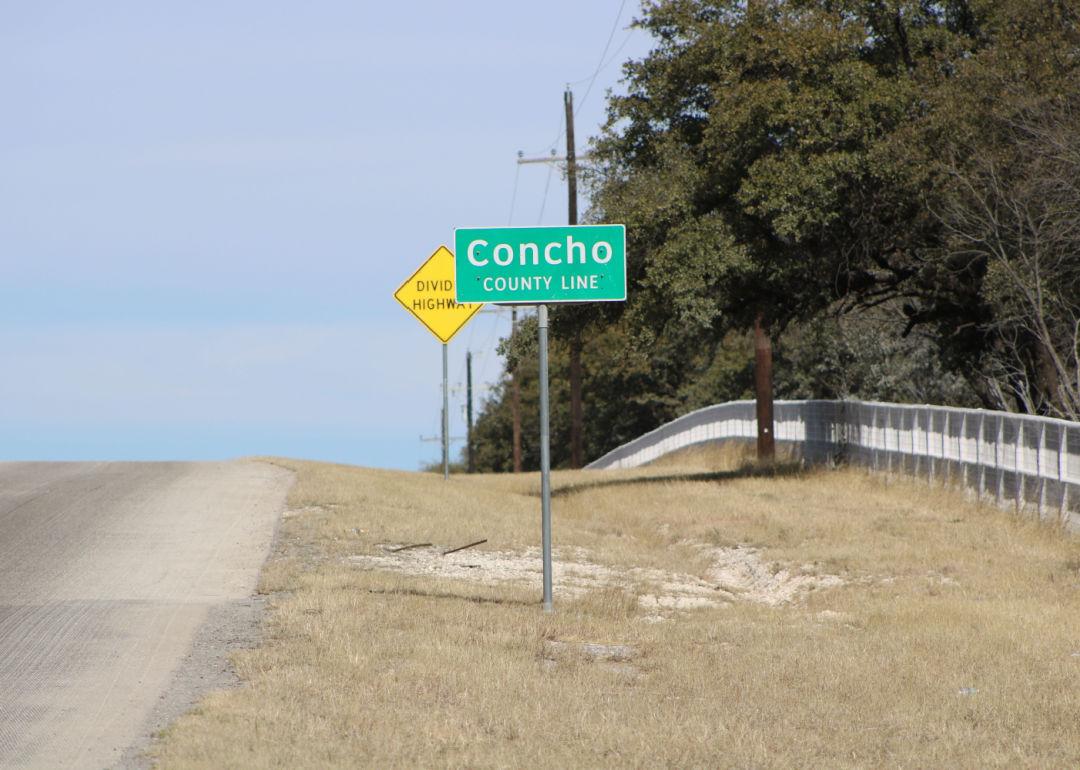
#29. Concho County (tie)
– Average commute to work: 31.1 minutes
– Share with commutes over an hour: 11.3%
– Share that worked outside their county of residence: 40.6%
– Means of transportation to work:
— Drove alone: 85.2%
— Carpooled: 9.5%
— Public transportation: 0%
— Walked: 0.8%
— Bicycle: 0%
— Taxicab, motorcycle, or other means: 0%
— Worked from home: 4.6%
LMPark Photos // Shutterstock
#29. Henderson County (tie)
– Average commute to work: 31.1 minutes
– Share with commutes over an hour: 16.2%
– Share that worked outside their county of residence: 40.6%
– Means of transportation to work:
— Drove alone: 81.3%
— Carpooled: 9.5%
— Public transportation: 0.3%
— Walked: 1.3%
— Bicycle: 0%
— Taxicab, motorcycle, or other means: 0.6%
— Worked from home: 7%
xradiophotog // Shutterstock
#26. Clay County (tie)
– Average commute to work: 31.2 minutes
– Share with commutes over an hour: 10.6%
– Share that worked outside their county of residence: 69.8%
– Means of transportation to work:
— Drove alone: 81.4%
— Carpooled: 11.5%
— Public transportation: 0%
— Walked: 1.9%
— Bicycle: 0%
— Taxicab, motorcycle, or other means: 0.1%
— Worked from home: 5.1%
Canva
#26. Comal County (tie)
– Average commute to work: 31.2 minutes
– Share with commutes over an hour: 12.9%
– Share that worked outside their county of residence: 41.4%
– Means of transportation to work:
— Drove alone: 77.8%
— Carpooled: 7.3%
— Public transportation: 0.2%
— Walked: 1%
— Bicycle: 0.3%
— Taxicab, motorcycle, or other means: 1.2%
— Worked from home: 12.1%
Canva
#26. Tyler County (tie)
– Average commute to work: 31.2 minutes
– Share with commutes over an hour: 20.6%
– Share that worked outside their county of residence: 34.6%
– Means of transportation to work:
— Drove alone: 83.5%
— Carpooled: 9%
— Public transportation: 0%
— Walked: 1.8%
— Bicycle: 0%
— Taxicab, motorcycle, or other means: 2.5%
— Worked from home: 3.2%

Canva
#25. Grimes County
– Average commute to work: 31.4 minutes
– Share with commutes over an hour: 14.8%
– Share that worked outside their county of residence: 54.8%
– Means of transportation to work:
— Drove alone: 79.6%
— Carpooled: 12.6%
— Public transportation: 0%
— Walked: 1.9%
— Bicycle: 0%
— Taxicab, motorcycle, or other means: 1.6%
— Worked from home: 4.3%
Canva
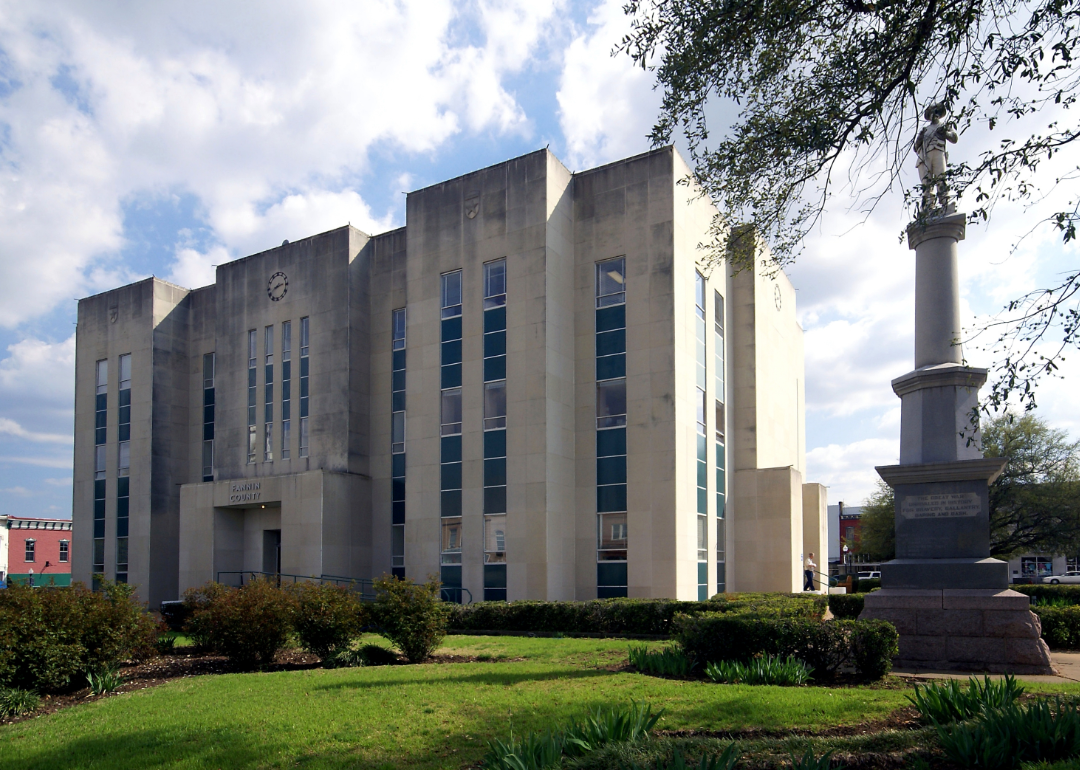
#22. Fannin County (tie)
– Average commute to work: 31.6 minutes
– Share with commutes over an hour: 17.5%
– Share that worked outside their county of residence: 42.4%
– Means of transportation to work:
— Drove alone: 77.1%
— Carpooled: 8.6%
— Public transportation: 0%
— Walked: 1.9%
— Bicycle: 0.1%
— Taxicab, motorcycle, or other means: 1.4%
— Worked from home: 10.9%
Sabrina Janelle Gordon // Shutterstock
#22. Hunt County (tie)
– Average commute to work: 31.6 minutes
– Share with commutes over an hour: 19.4%
– Share that worked outside their county of residence: 42.2%
– Means of transportation to work:
— Drove alone: 81.8%
— Carpooled: 8.5%
— Public transportation: 0.4%
— Walked: 1.8%
— Bicycle: 0.3%
— Taxicab, motorcycle, or other means: 1.2%
— Worked from home: 6%
Roberto Galan // Shutterstock
#22. Johnson County (tie)
– Average commute to work: 31.6 minutes
– Share with commutes over an hour: 9%
– Share that worked outside their county of residence: 51.1%
– Means of transportation to work:
— Drove alone: 87.5%
— Carpooled: 7.4%
— Public transportation: 0.1%
— Walked: 0.7%
— Bicycle: 0%
— Taxicab, motorcycle, or other means: 0.7%
— Worked from home: 3.7%
Canva
#21. Rockwall County
– Average commute to work: 32.1 minutes
– Share with commutes over an hour: 14.6%
– Share that worked outside their county of residence: 55.6%
– Means of transportation to work:
— Drove alone: 76.8%
— Carpooled: 8.5%
— Public transportation: 0.6%
— Walked: 0.6%
— Bicycle: 0%
— Taxicab, motorcycle, or other means: 0.9%
— Worked from home: 12.7%
Canva
#19. Montgomery County (tie)
– Average commute to work: 32.2 minutes
– Share with commutes over an hour: 15.4%
– Share that worked outside their county of residence: 38.7%
– Means of transportation to work:
— Drove alone: 78.6%
— Carpooled: 8.2%
— Public transportation: 1%
— Walked: 0.7%
— Bicycle: 0.2%
— Taxicab, motorcycle, or other means: 1%
— Worked from home: 10.4%
Canva
#19. Sabine County (tie)
– Average commute to work: 32.2 minutes
– Share with commutes over an hour: 13%
– Share that worked outside their county of residence: 22.8%
– Means of transportation to work:
— Drove alone: 85.3%
— Carpooled: 4.2%
— Public transportation: 0%
— Walked: 0.5%
— Bicycle: 0%
— Taxicab, motorcycle, or other means: 1.4%
— Worked from home: 8.6%

Canva
#17. Fort Bend County (tie)
– Average commute to work: 32.7 minutes
– Share with commutes over an hour: 12%
– Share that worked outside their county of residence: 54.7%
– Means of transportation to work:
— Drove alone: 76.3%
— Carpooled: 8.7%
— Public transportation: 1.1%
— Walked: 0.6%
— Bicycle: 0.1%
— Taxicab, motorcycle, or other means: 1.1%
— Worked from home: 12.3%
Canva
#17. Marion County (tie)
– Average commute to work: 32.7 minutes
– Share with commutes over an hour: 11.6%
– Share that worked outside their county of residence: 55.8%
– Means of transportation to work:
— Drove alone: 83.5%
— Carpooled: 9.4%
— Public transportation: 0.5%
— Walked: 1.2%
— Bicycle: 0%
— Taxicab, motorcycle, or other means: 2%
— Worked from home: 3.4%
Canva
#16. Parker County
– Average commute to work: 32.9 minutes
– Share with commutes over an hour: 13.9%
– Share that worked outside their county of residence: 51%
– Means of transportation to work:
— Drove alone: 80.3%
— Carpooled: 8.4%
— Public transportation: 0.1%
— Walked: 0.9%
— Bicycle: 0%
— Taxicab, motorcycle, or other means: 1.1%
— Worked from home: 9.2%
Canva
#14. Caldwell County (tie)
– Average commute to work: 33.3 minutes
– Share with commutes over an hour: 20.8%
– Share that worked outside their county of residence: 58.5%
– Means of transportation to work:
— Drove alone: 81.8%
— Carpooled: 8.3%
— Public transportation: 0.1%
— Walked: 2.7%
— Bicycle: 0.2%
— Taxicab, motorcycle, or other means: 2.1%
— Worked from home: 4.9%
Canva
#14. Somervell County (tie)
– Average commute to work: 33.3 minutes
– Share with commutes over an hour: 17.5%
– Share that worked outside their county of residence: 38.1%
– Means of transportation to work:
— Drove alone: 77.8%
— Carpooled: 7.4%
— Public transportation: 0%
— Walked: 1.5%
— Bicycle: 0.3%
— Taxicab, motorcycle, or other means: 4.4%
— Worked from home: 8.7%
xradiophotog // Shutterstock
#13. Hood County
– Average commute to work: 33.7 minutes
– Share with commutes over an hour: 17%
– Share that worked outside their county of residence: 42.6%
– Means of transportation to work:
— Drove alone: 83.6%
— Carpooled: 6.4%
— Public transportation: 0.1%
— Walked: 0.9%
— Bicycle: 0%
— Taxicab, motorcycle, or other means: 0.8%
— Worked from home: 8.1%

Canva
#12. Wise County
– Average commute to work: 34.1 minutes
– Share with commutes over an hour: 16.4%
– Share that worked outside their county of residence: 43.5%
– Means of transportation to work:
— Drove alone: 79.5%
— Carpooled: 10.1%
— Public transportation: 0.2%
— Walked: 1.4%
— Bicycle: 0%
— Taxicab, motorcycle, or other means: 0.8%
— Worked from home: 8%
Canva
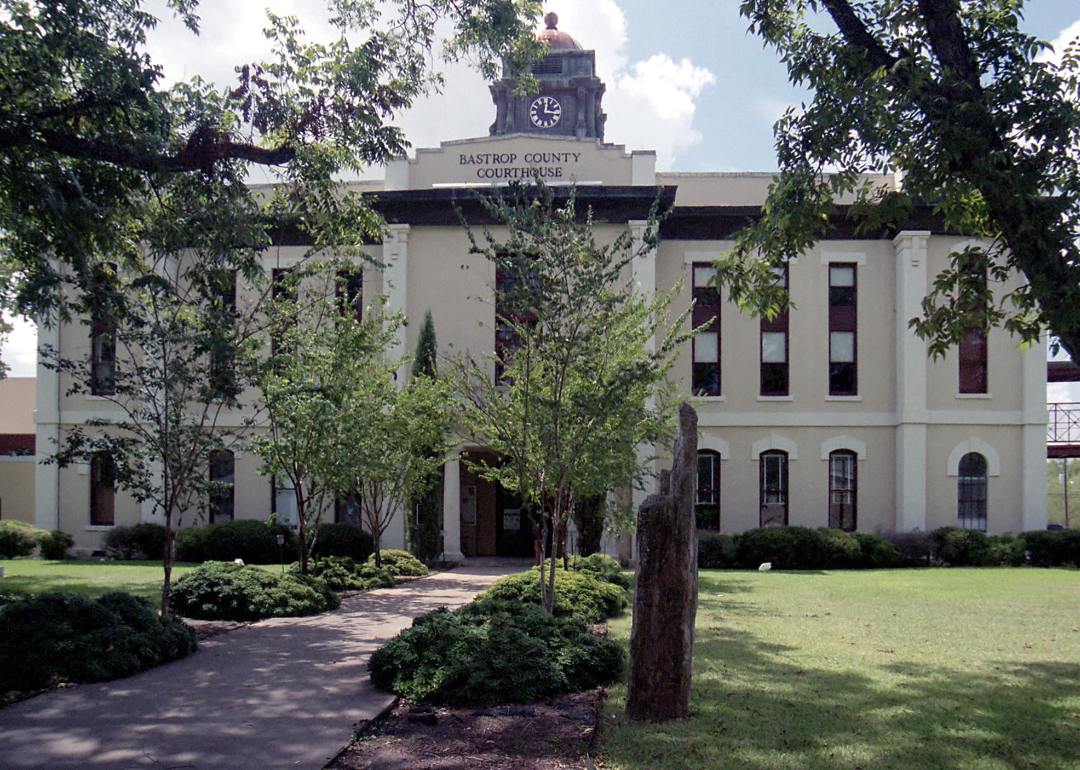
#11. Bastrop County
– Average commute to work: 35.5 minutes
– Share with commutes over an hour: 18.8%
– Share that worked outside their county of residence: 53.9%
– Means of transportation to work:
— Drove alone: 78.5%
— Carpooled: 10%
— Public transportation: 0.2%
— Walked: 1.6%
— Bicycle: 0.2%
— Taxicab, motorcycle, or other means: 1.6%
— Worked from home: 7.8%
Canva
#9. Kaufman County (tie)
– Average commute to work: 35.7 minutes
– Share with commutes over an hour: 20.3%
– Share that worked outside their county of residence: 57.4%
– Means of transportation to work:
— Drove alone: 81.1%
— Carpooled: 8.6%
— Public transportation: 0.1%
— Walked: 0.8%
— Bicycle: 0%
— Taxicab, motorcycle, or other means: 0.9%
— Worked from home: 8.5%
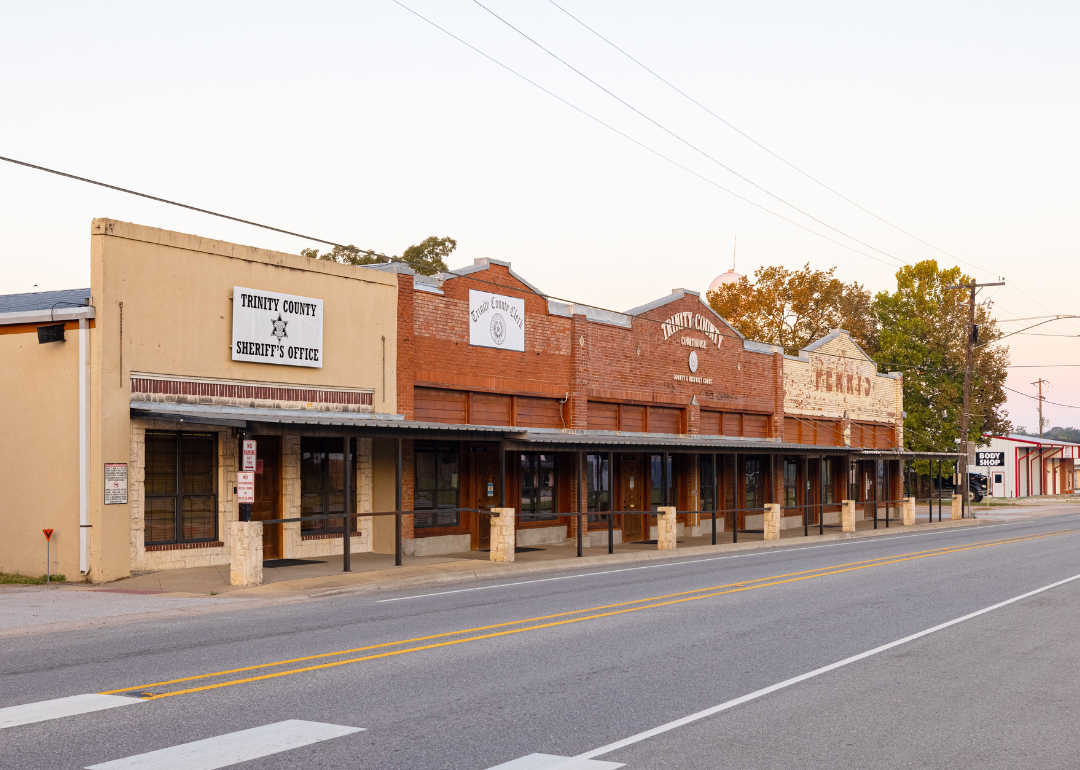
Roberto Galan // Shutterstock
#9. Trinity County (tie)
– Average commute to work: 35.7 minutes
– Share with commutes over an hour: 19.7%
– Share that worked outside their county of residence: 57.6%
– Means of transportation to work:
— Drove alone: 86.2%
— Carpooled: 6.5%
— Public transportation: 0.2%
— Walked: 2.6%
— Bicycle: 0%
— Taxicab, motorcycle, or other means: 0.9%
— Worked from home: 3.6%
mivod // Shutterstock
#7. Van Zandt County (tie)
– Average commute to work: 36.6 minutes
– Share with commutes over an hour: 23.4%
– Share that worked outside their county of residence: 49.9%
– Means of transportation to work:
— Drove alone: 80.3%
— Carpooled: 10.6%
— Public transportation: 0.1%
— Walked: 1.4%
— Bicycle: 0%
— Taxicab, motorcycle, or other means: 1%
— Worked from home: 6.6%

Canva
#7. Wilson County (tie)
– Average commute to work: 36.6 minutes
– Share with commutes over an hour: 14.9%
– Share that worked outside their county of residence: 57.1%
– Means of transportation to work:
— Drove alone: 77.3%
— Carpooled: 9.2%
— Public transportation: 0.1%
— Walked: 0.3%
— Bicycle: 0.1%
— Taxicab, motorcycle, or other means: 0.9%
— Worked from home: 12%
Canva
#6. Rains County
– Average commute to work: 36.8 minutes
– Share with commutes over an hour: 23.1%
– Share that worked outside their county of residence: 63.6%
– Means of transportation to work:
— Drove alone: 75.2%
— Carpooled: 14.2%
— Public transportation: 0%
— Walked: 1%
— Bicycle: 0%
— Taxicab, motorcycle, or other means: 3.9%
— Worked from home: 5.7%
Gestalt Imagery // Shutterstock
#5. Terrell County
– Average commute to work: 37.2 minutes
– Share with commutes over an hour: 25.6%
– Share that worked outside their county of residence: 4.8%
– Means of transportation to work:
— Drove alone: 71.9%
— Carpooled: 16.7%
— Public transportation: 0%
— Walked: 0%
— Bicycle: 0%
— Taxicab, motorcycle, or other means: 0%
— Worked from home: 11.3%
Canva
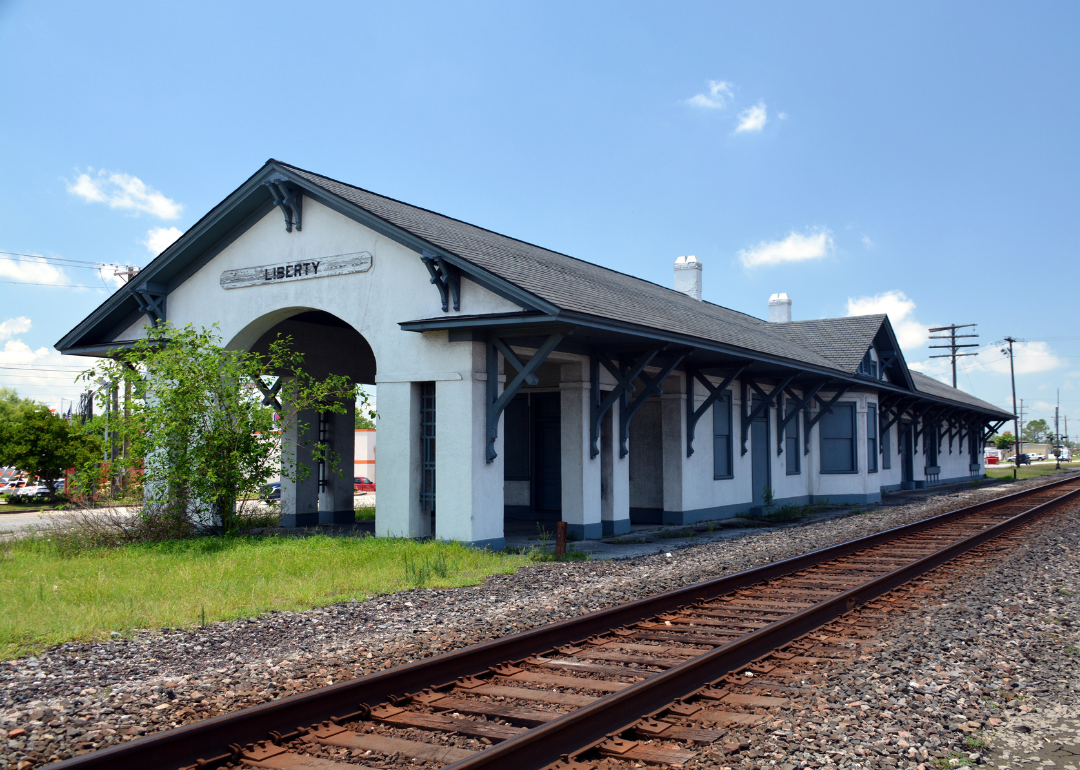
#4. Liberty County
– Average commute to work: 37.9 minutes
– Share with commutes over an hour: 25.1%
– Share that worked outside their county of residence: 56.1%
– Means of transportation to work:
— Drove alone: 81.4%
— Carpooled: 8.8%
— Public transportation: 0.4%
— Walked: 0.8%
— Bicycle: 0.4%
— Taxicab, motorcycle, or other means: 2%
— Worked from home: 6.2%
Canva
#3. Bandera County
– Average commute to work: 39.6 minutes
– Share with commutes over an hour: 25.5%
– Share that worked outside their county of residence: 56.6%
– Means of transportation to work:
— Drove alone: 78.6%
— Carpooled: 11%
— Public transportation: 0%
— Walked: 1.4%
— Bicycle: 0%
— Taxicab, motorcycle, or other means: 1.2%
— Worked from home: 7.8%
Roberto Galan // Shutterstock
#2. San Jacinto County
– Average commute to work: 40.2 minutes
– Share with commutes over an hour: 26.8%
– Share that worked outside their county of residence: 72.3%
– Means of transportation to work:
— Drove alone: 79.4%
— Carpooled: 12.5%
— Public transportation: 0.5%
— Walked: 0.5%
— Bicycle: 0%
— Taxicab, motorcycle, or other means: 3%
— Worked from home: 4.2%
Canva
#1. Newton County
– Average commute to work: 42.4 minutes
– Share with commutes over an hour: 26.6%
– Share that worked outside their county of residence: 61.7%
– Means of transportation to work:
— Drove alone: 90.1%
— Carpooled: 5.9%
— Public transportation: 0.7%
— Walked: 0.2%
— Bicycle: 0%
— Taxicab, motorcycle, or other means: 0.3%
— Worked from home: 2.9%
