Election Day rideshare data indicates where, how, and when Americans get to the polls

Lyft
Election Day rideshare data indicates where, how, and when Americans get to the polls
Illustration of pink map of U.S with white check mark symbolizing elections.
This year, citizens across the country will take time out of their busy days to vote. Lyft’s Election Day rideshare data provides a preview of how, and when, millions of them will be getting to the polls. (If you’d rather vote early, absentee, or by mail, most states also provide such options.) Lyft takes a look at which states’ voters go the extra mile (sometimes literally) to make sure their voices are heard.
![]()
Lyft
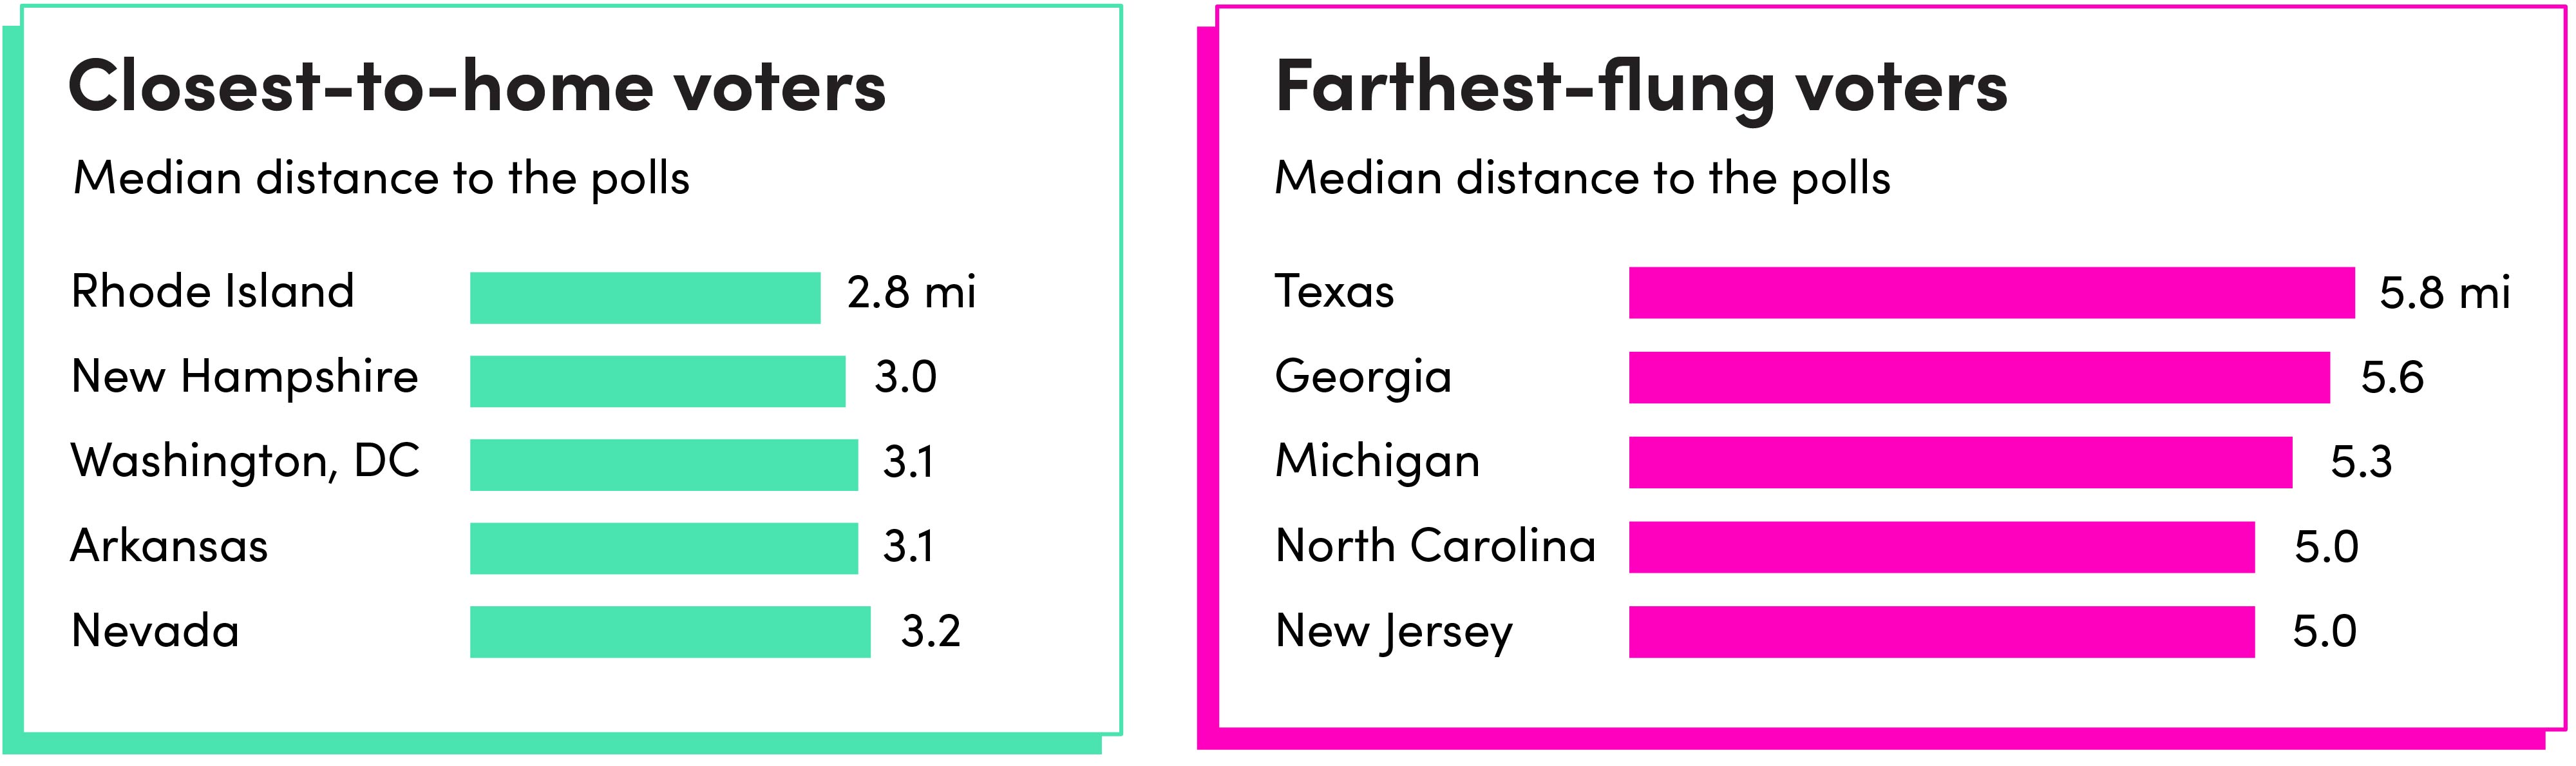
Where Voters Travel the Farthest
Graphic showing two charts: where are closest to home voters and farthest-flung voters.
A recent study estimated that even a one-mile increase in distance to polling locations can reduce turnout by up to 20%. On Election Day 2022, the typical (median) voter using Lyft traveled four miles to poll-like locations (see Methodology section below). But voters in Texas, Georgia, Michigan, North Carolina, and New Jersey traveled significantly farther—five miles or more—to cast a ballot. And the riders of Clayton County, Georgia, and Tarrant County, Texas, traveled more than seven miles to vote in 2022.
Lyft
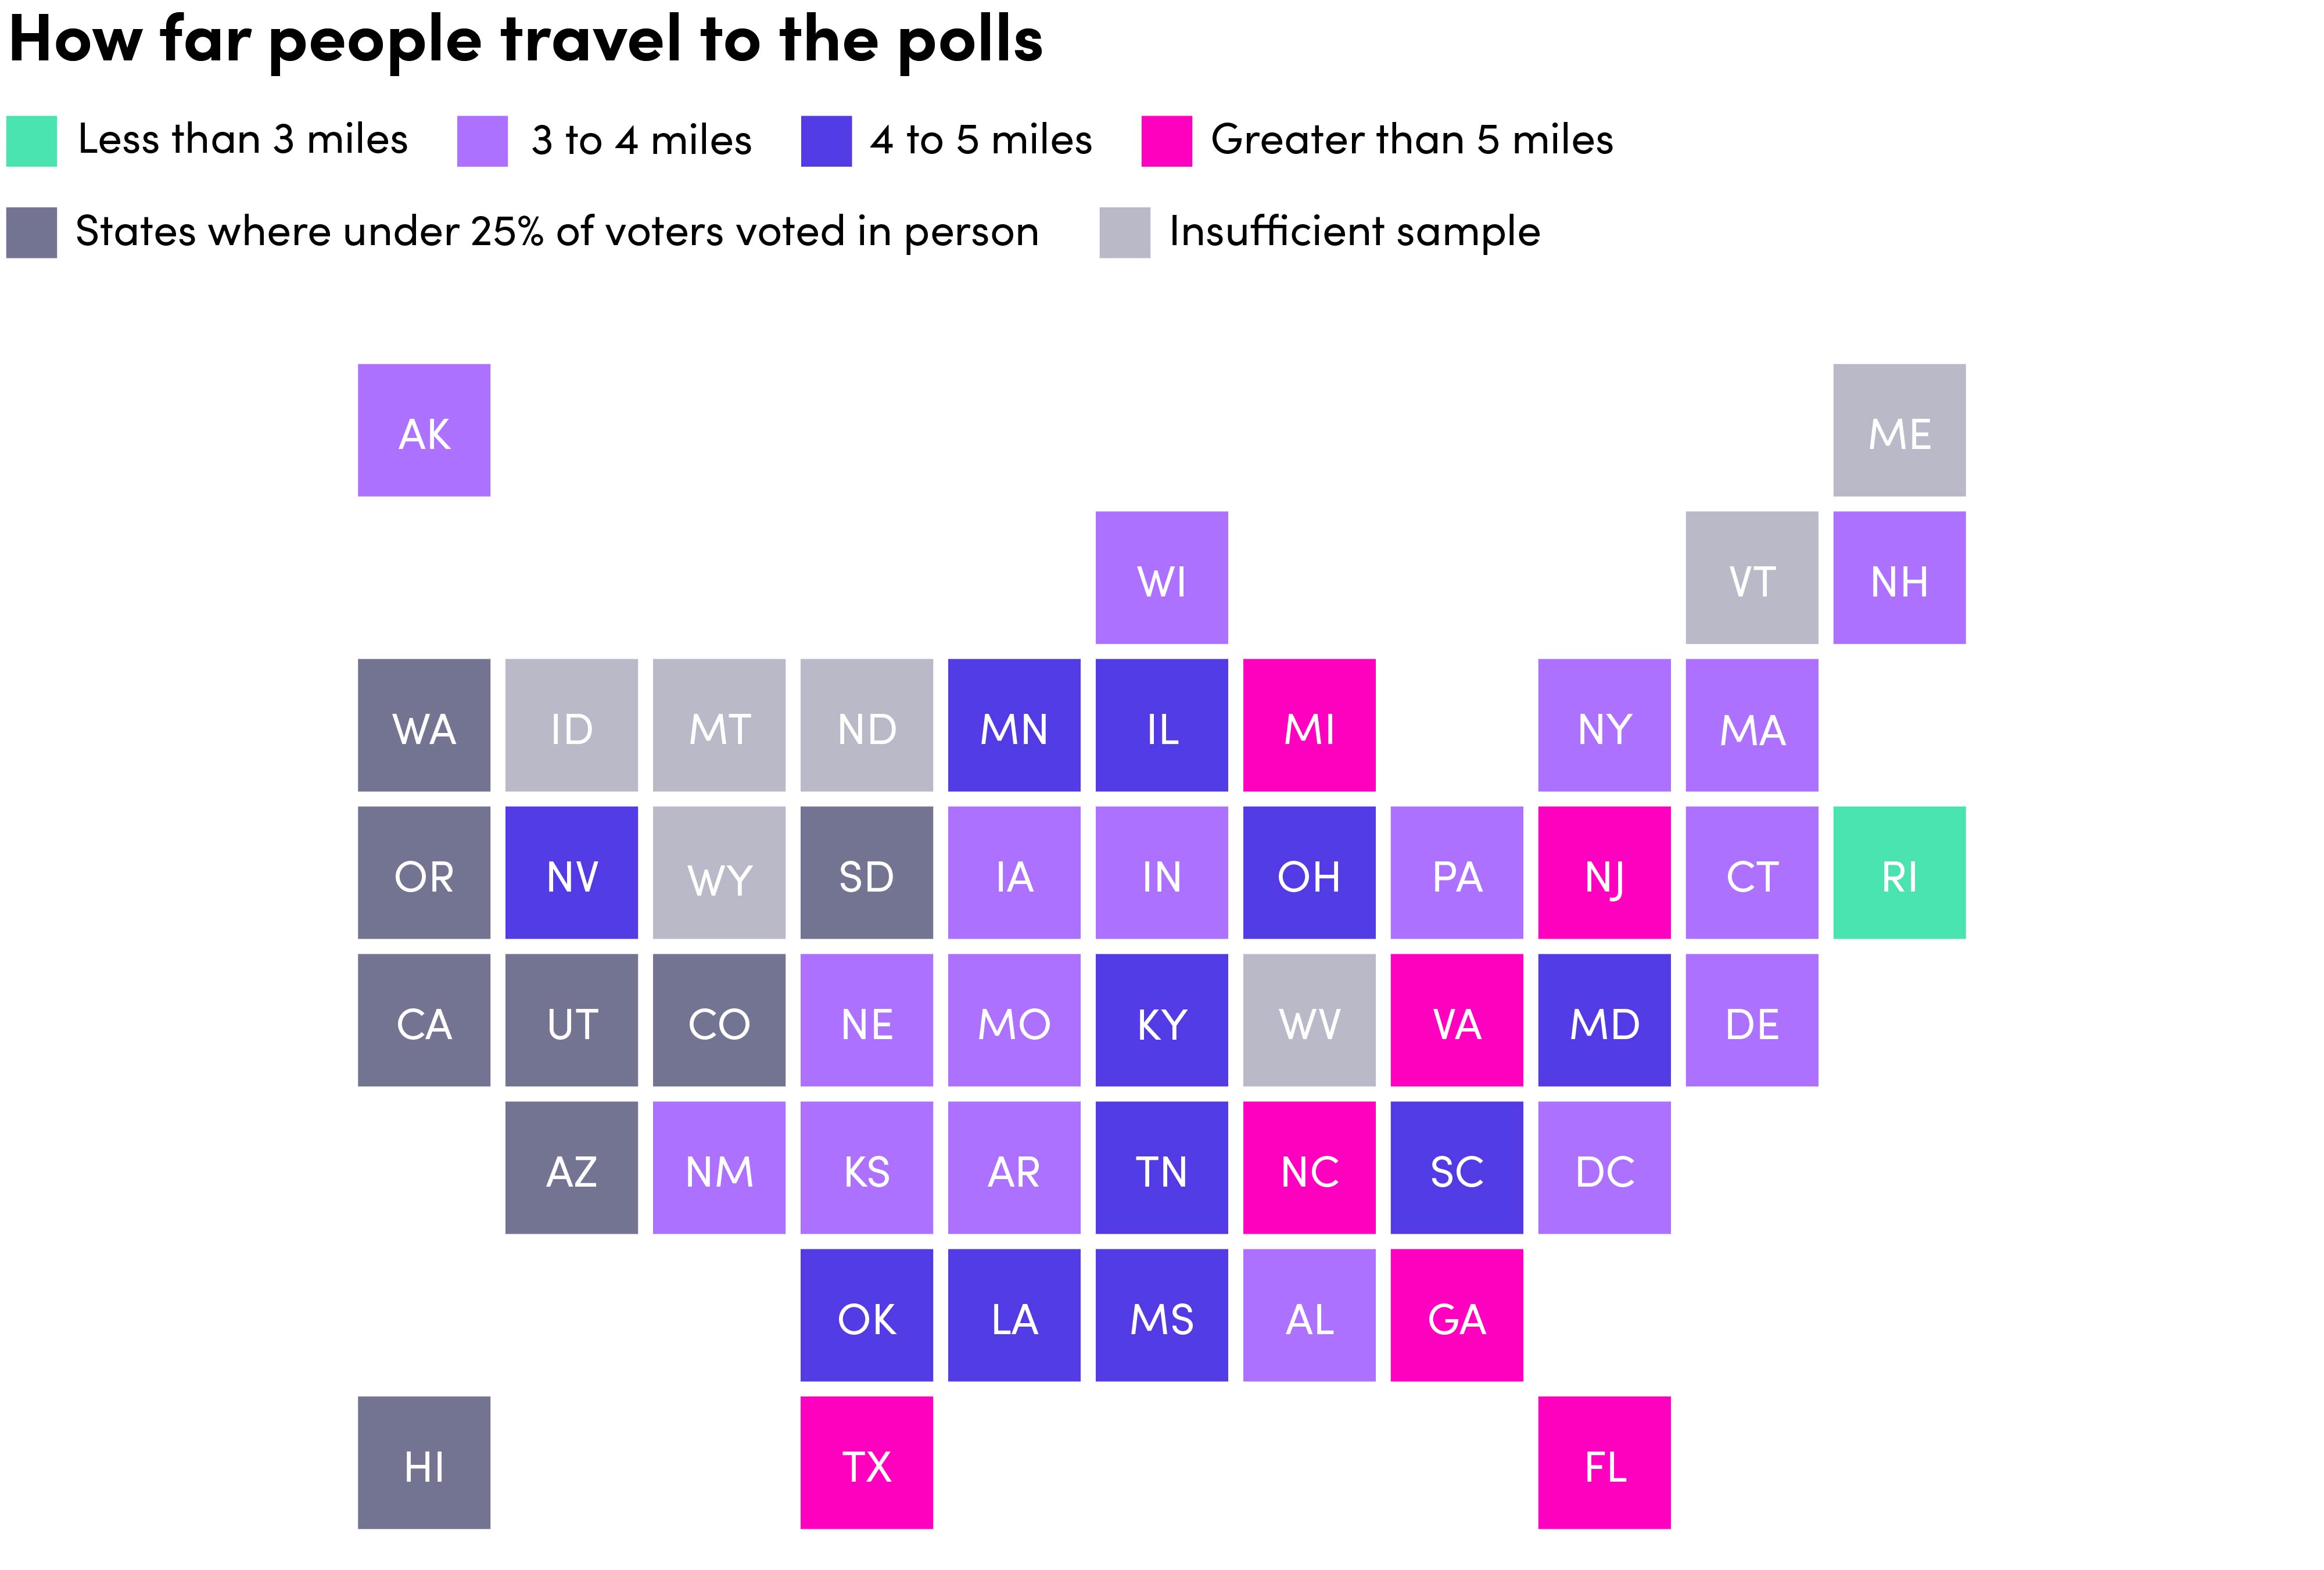
Where Voters Wait the Longest
Graphic showing how far people travel to the polls in different places.
What do the TSA, theme parks, and democracy have in common? Lines—sometimes long ones. The Bipartisan Policy Center estimates that half a million voters in 2016 failed to vote because of poor management of polling places (which includes long waits). And while many states have expanded their mail-in voting options over the past decade, for those who still choose to vote in person, lines over 30 minutes long remain a barrier.
The dedicated voters in Cumberland County, North Carolina (home to Fayetteville), and Duval County, Florida (Jacksonville), took, on average, 80 minutes out of their day to practice democracy.
Lyft
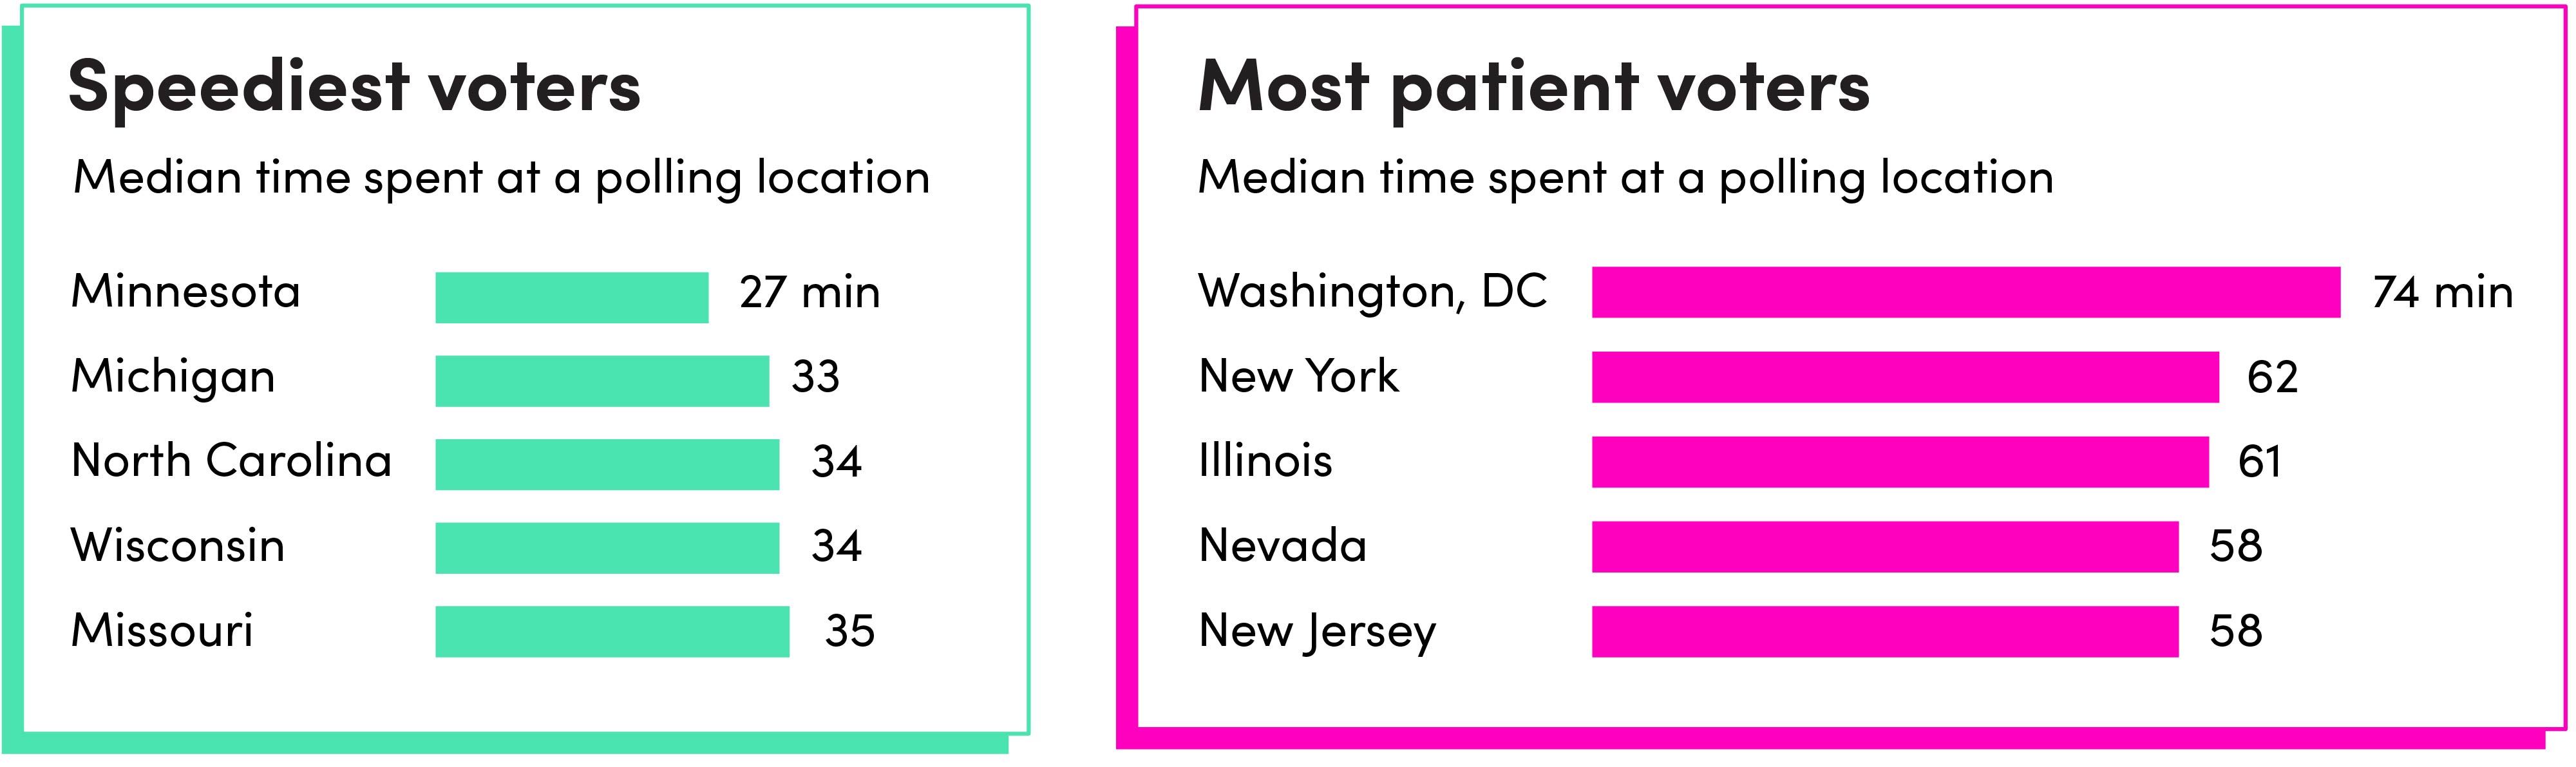
Where Voters Have the Shortest Waits
Graphic showing two charts: locations of speediest and slowest voters.
Of course, between drop-off and pickup, voters do more than wait in line. All told, the typical (median) Lyft rider spent 50 minutes at a poll-like location in 2022 and more than an hour in D.C., New York, and Illinois.
Lyft
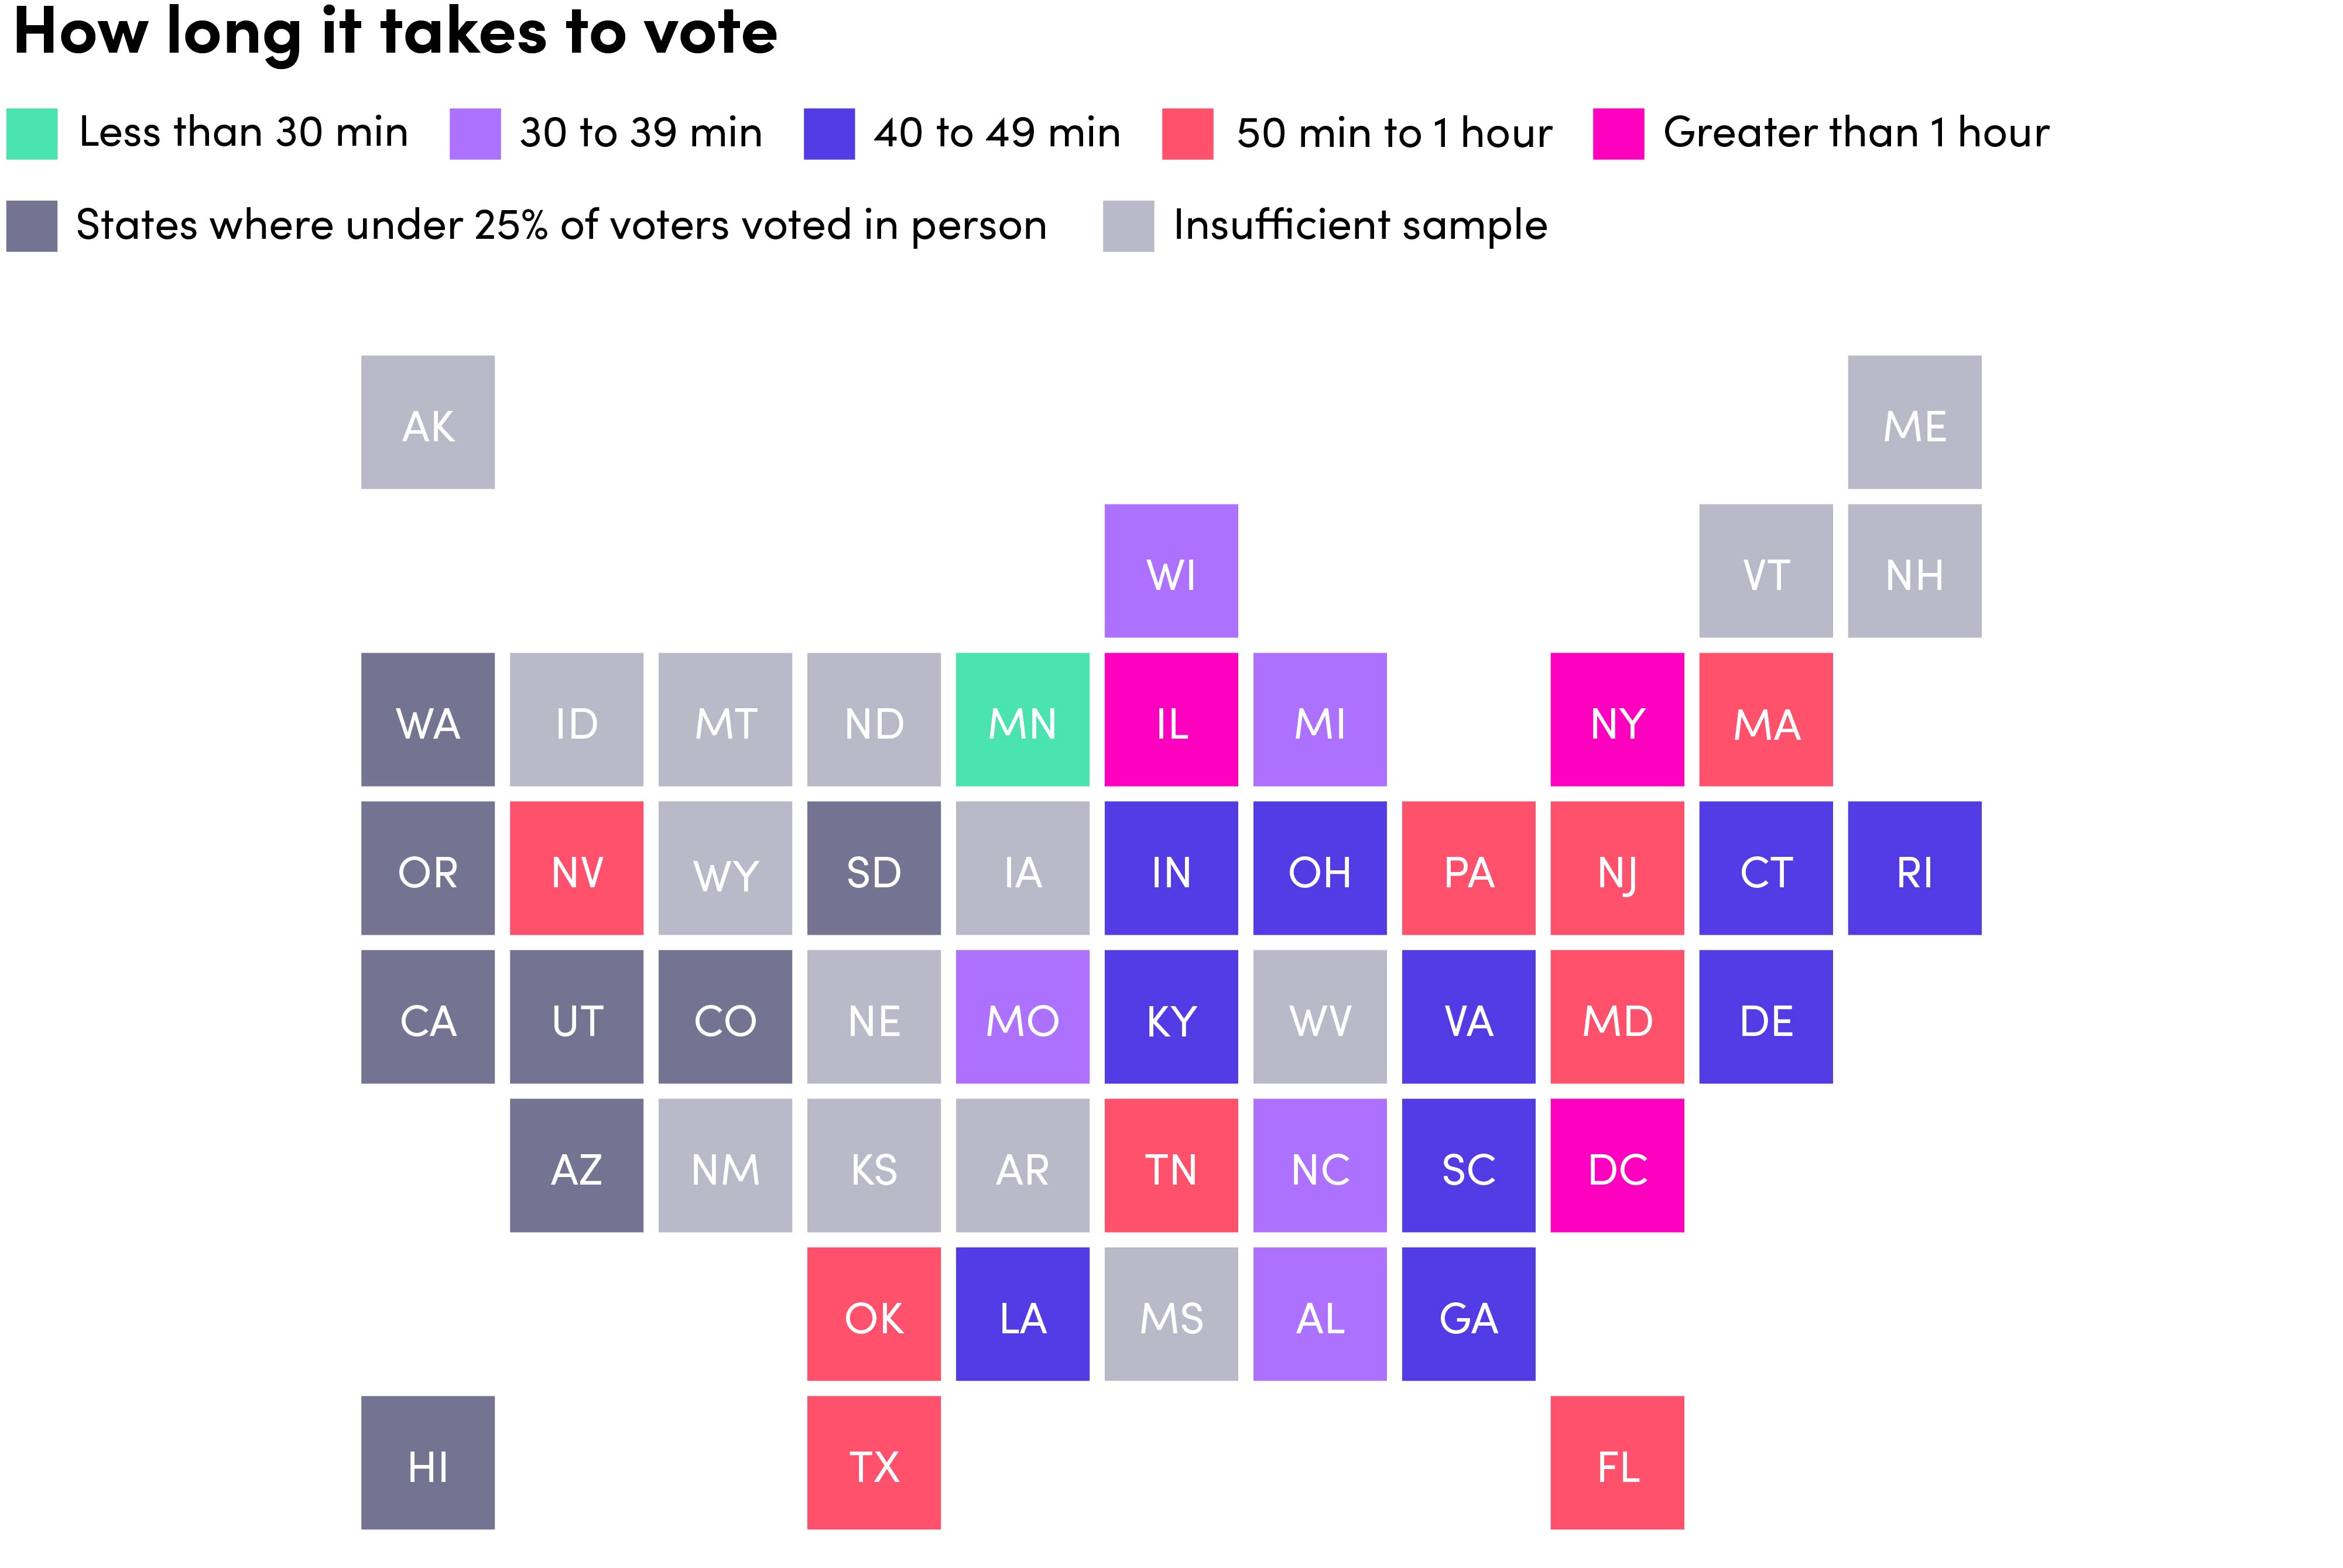
How Long It Takes to Vote
Graphic showing how long it takes to vote in different places.
Things generally moved twice as fast in upper Midwestern states like Minnesota, Michigan, and Wisconsin (around 30 minutes).
Lyft
When Voters Go to Vote
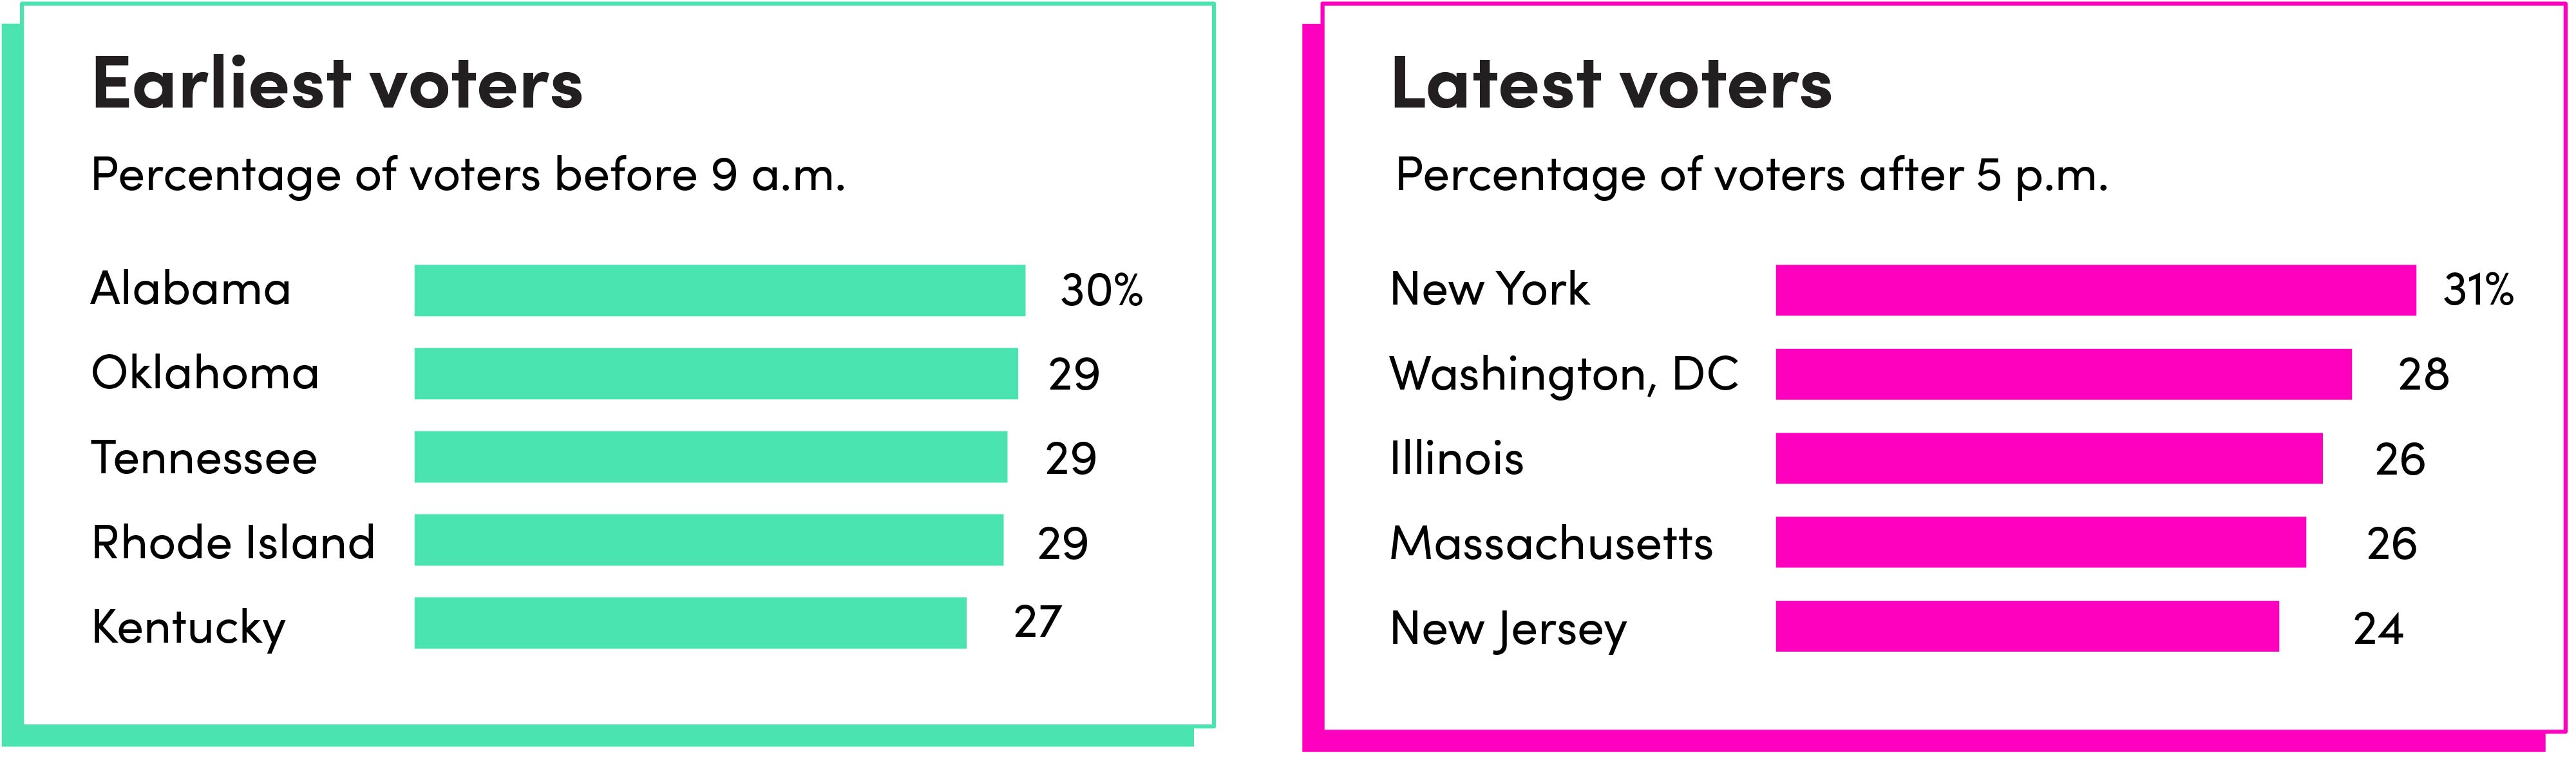
Graphic showing two charts: locations of earliest and latest voters.
One way to avoid anxiety around lines at polls is to vote before Election Day, by mail, or—failing that—as early in the day as possible. That seems to be the practice in Alabama, Oklahoma, and Tennessee, where voters are most likely to go to poll-like locations before 9 a.m. Meanwhile, in D.C. and New York, where the polls close on the later end, the most popular time to vote is after 5 p.m.
Lyft
Where Voters Use Lyft
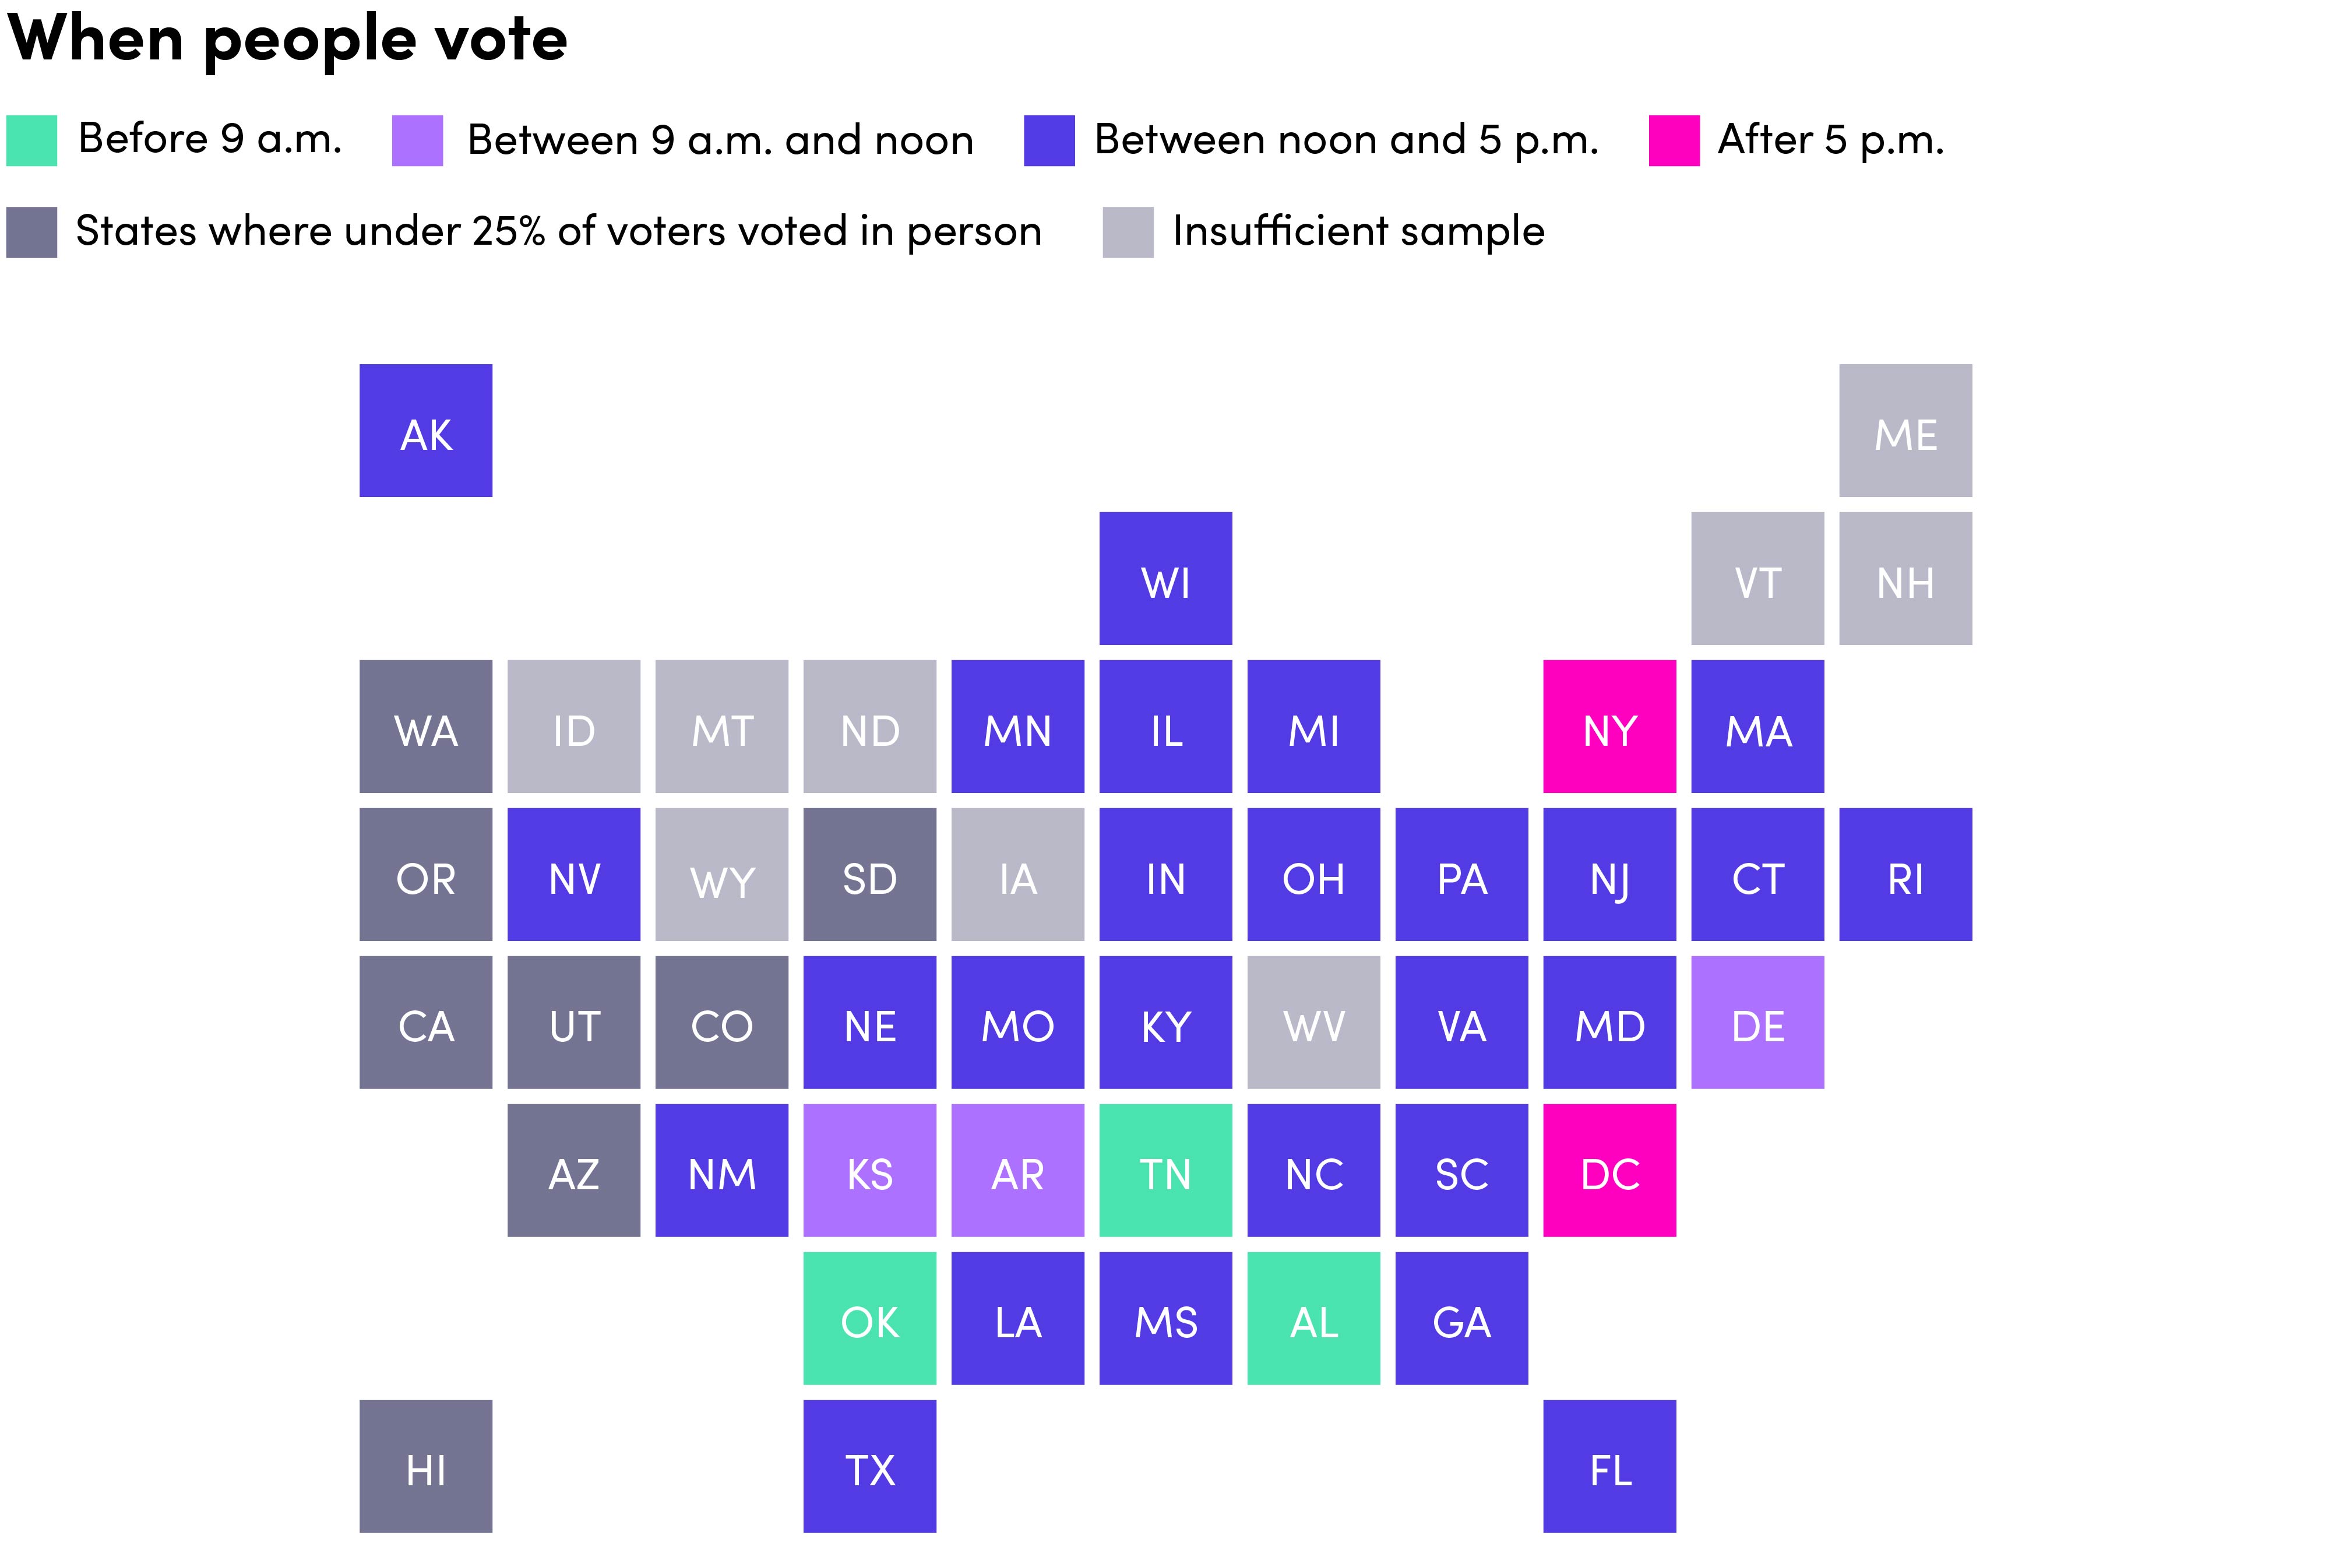
Graphic showing what time people vote in different places.
Over the course of the 2022 election, an estimated 2 million people took Lyft rides to the polls — but it was more common in some states than others.
Lyft
Where the Number of First-Time Rides to Polls Increased Most
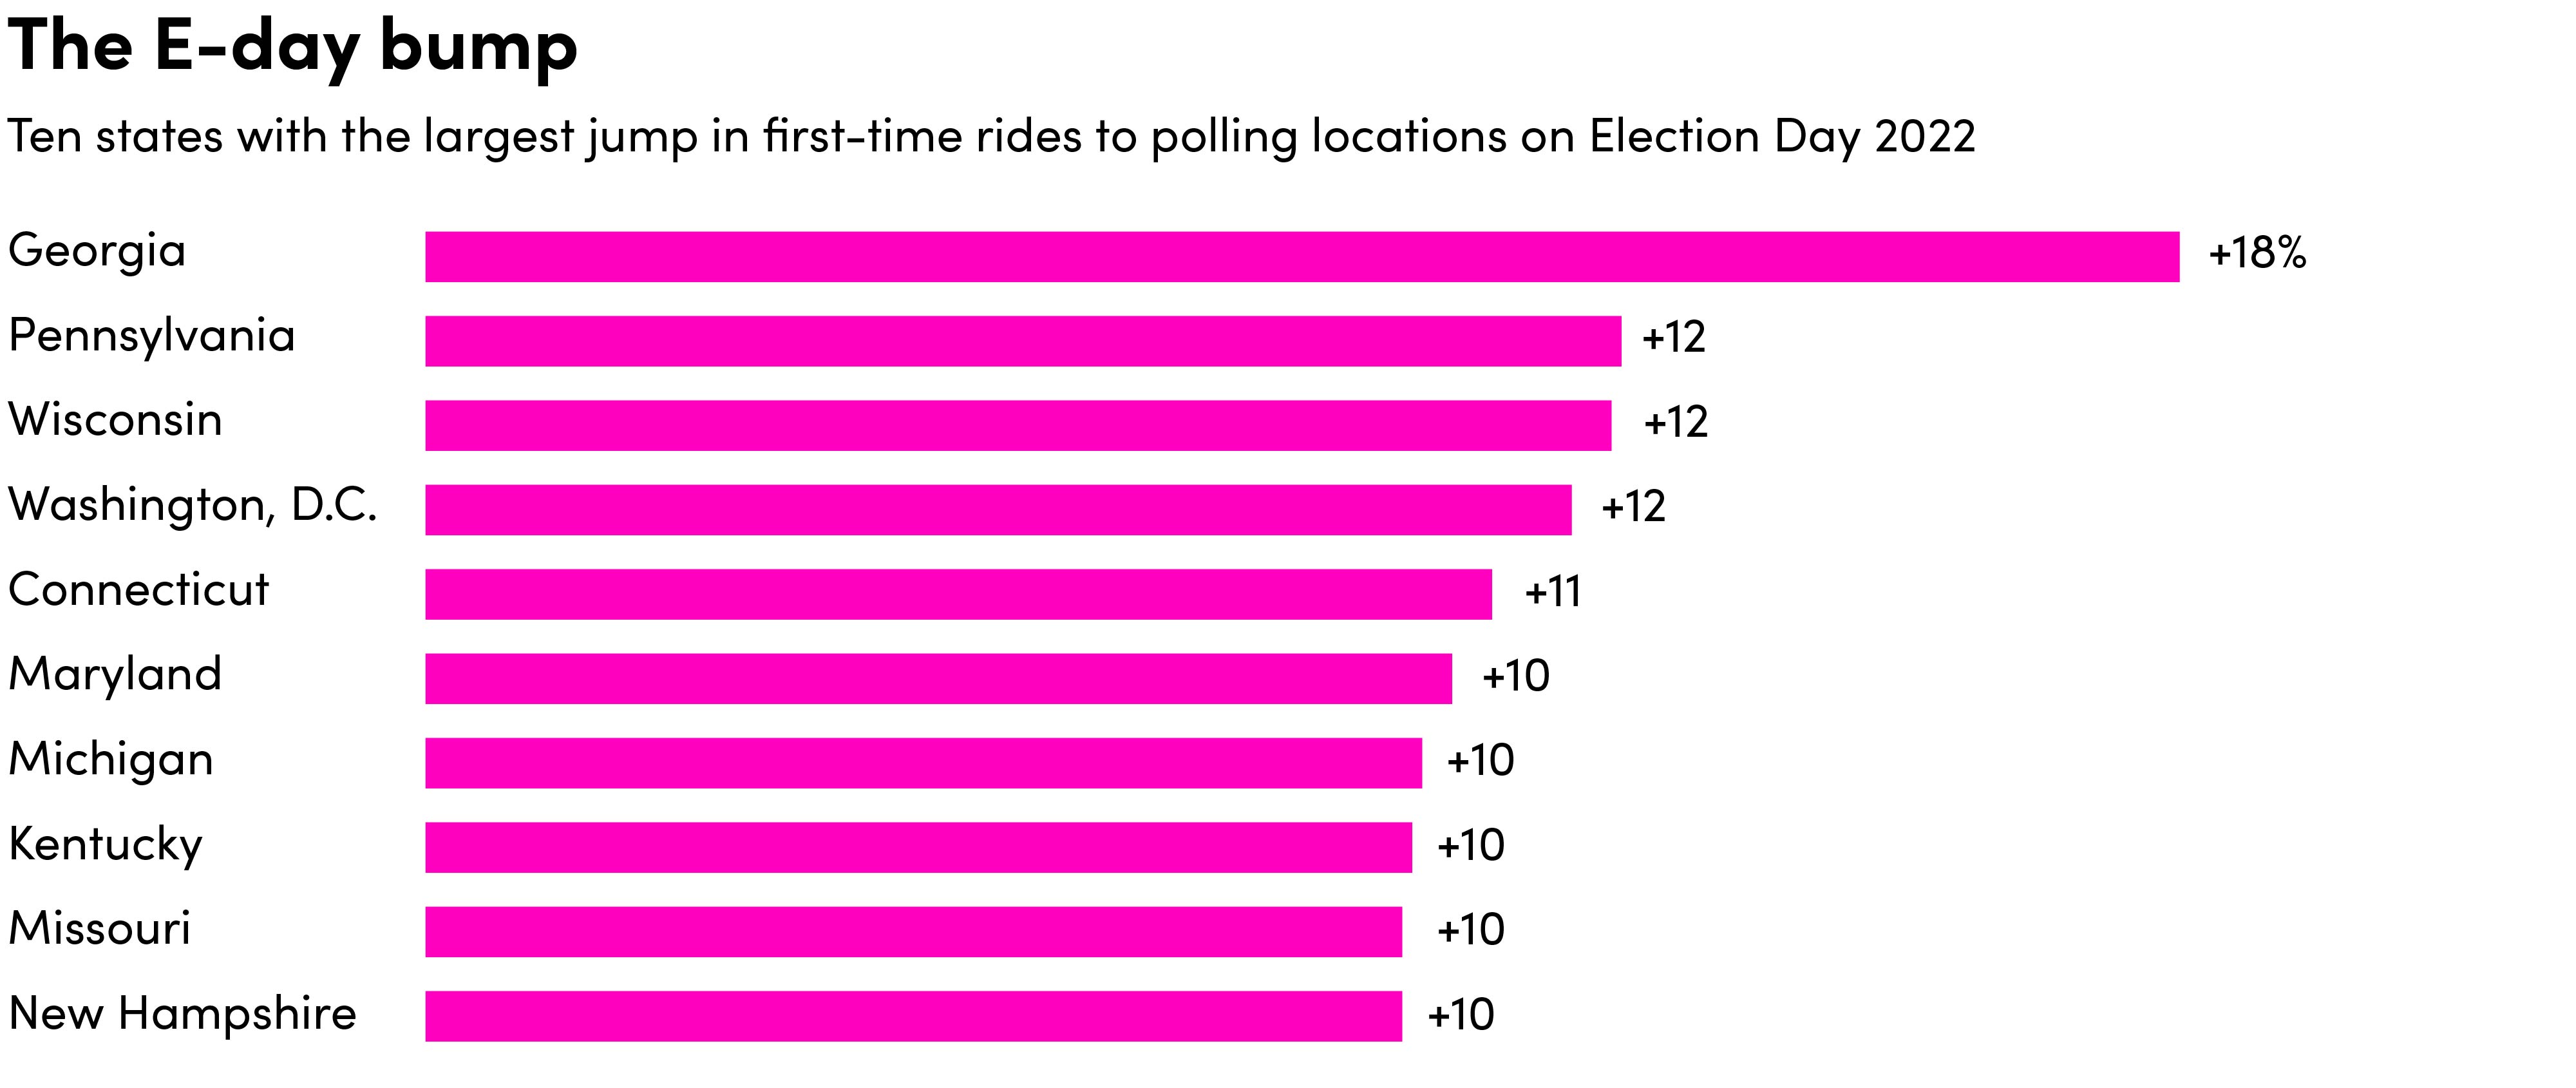
Bar chart showing ten states with the largest jump in first-time rides to polling locations in 2022.
In Georgia, there was an 18% increase in rides to poll-like locations on Election Day in 2022, and in Pennsylvania and Wisconsin, a 12% increase. Notably, these states had some of the most competitive Senate races during the last election cycle, suggesting that voters might use rideshare when they feel more is at stake. Meanwhile, Western states like Nevada, New Mexico, and Alaska were much less likely to use rideshare to vote: Activity at poll-like locations increased by only 5% on Election Day.
Lyft
Methodology
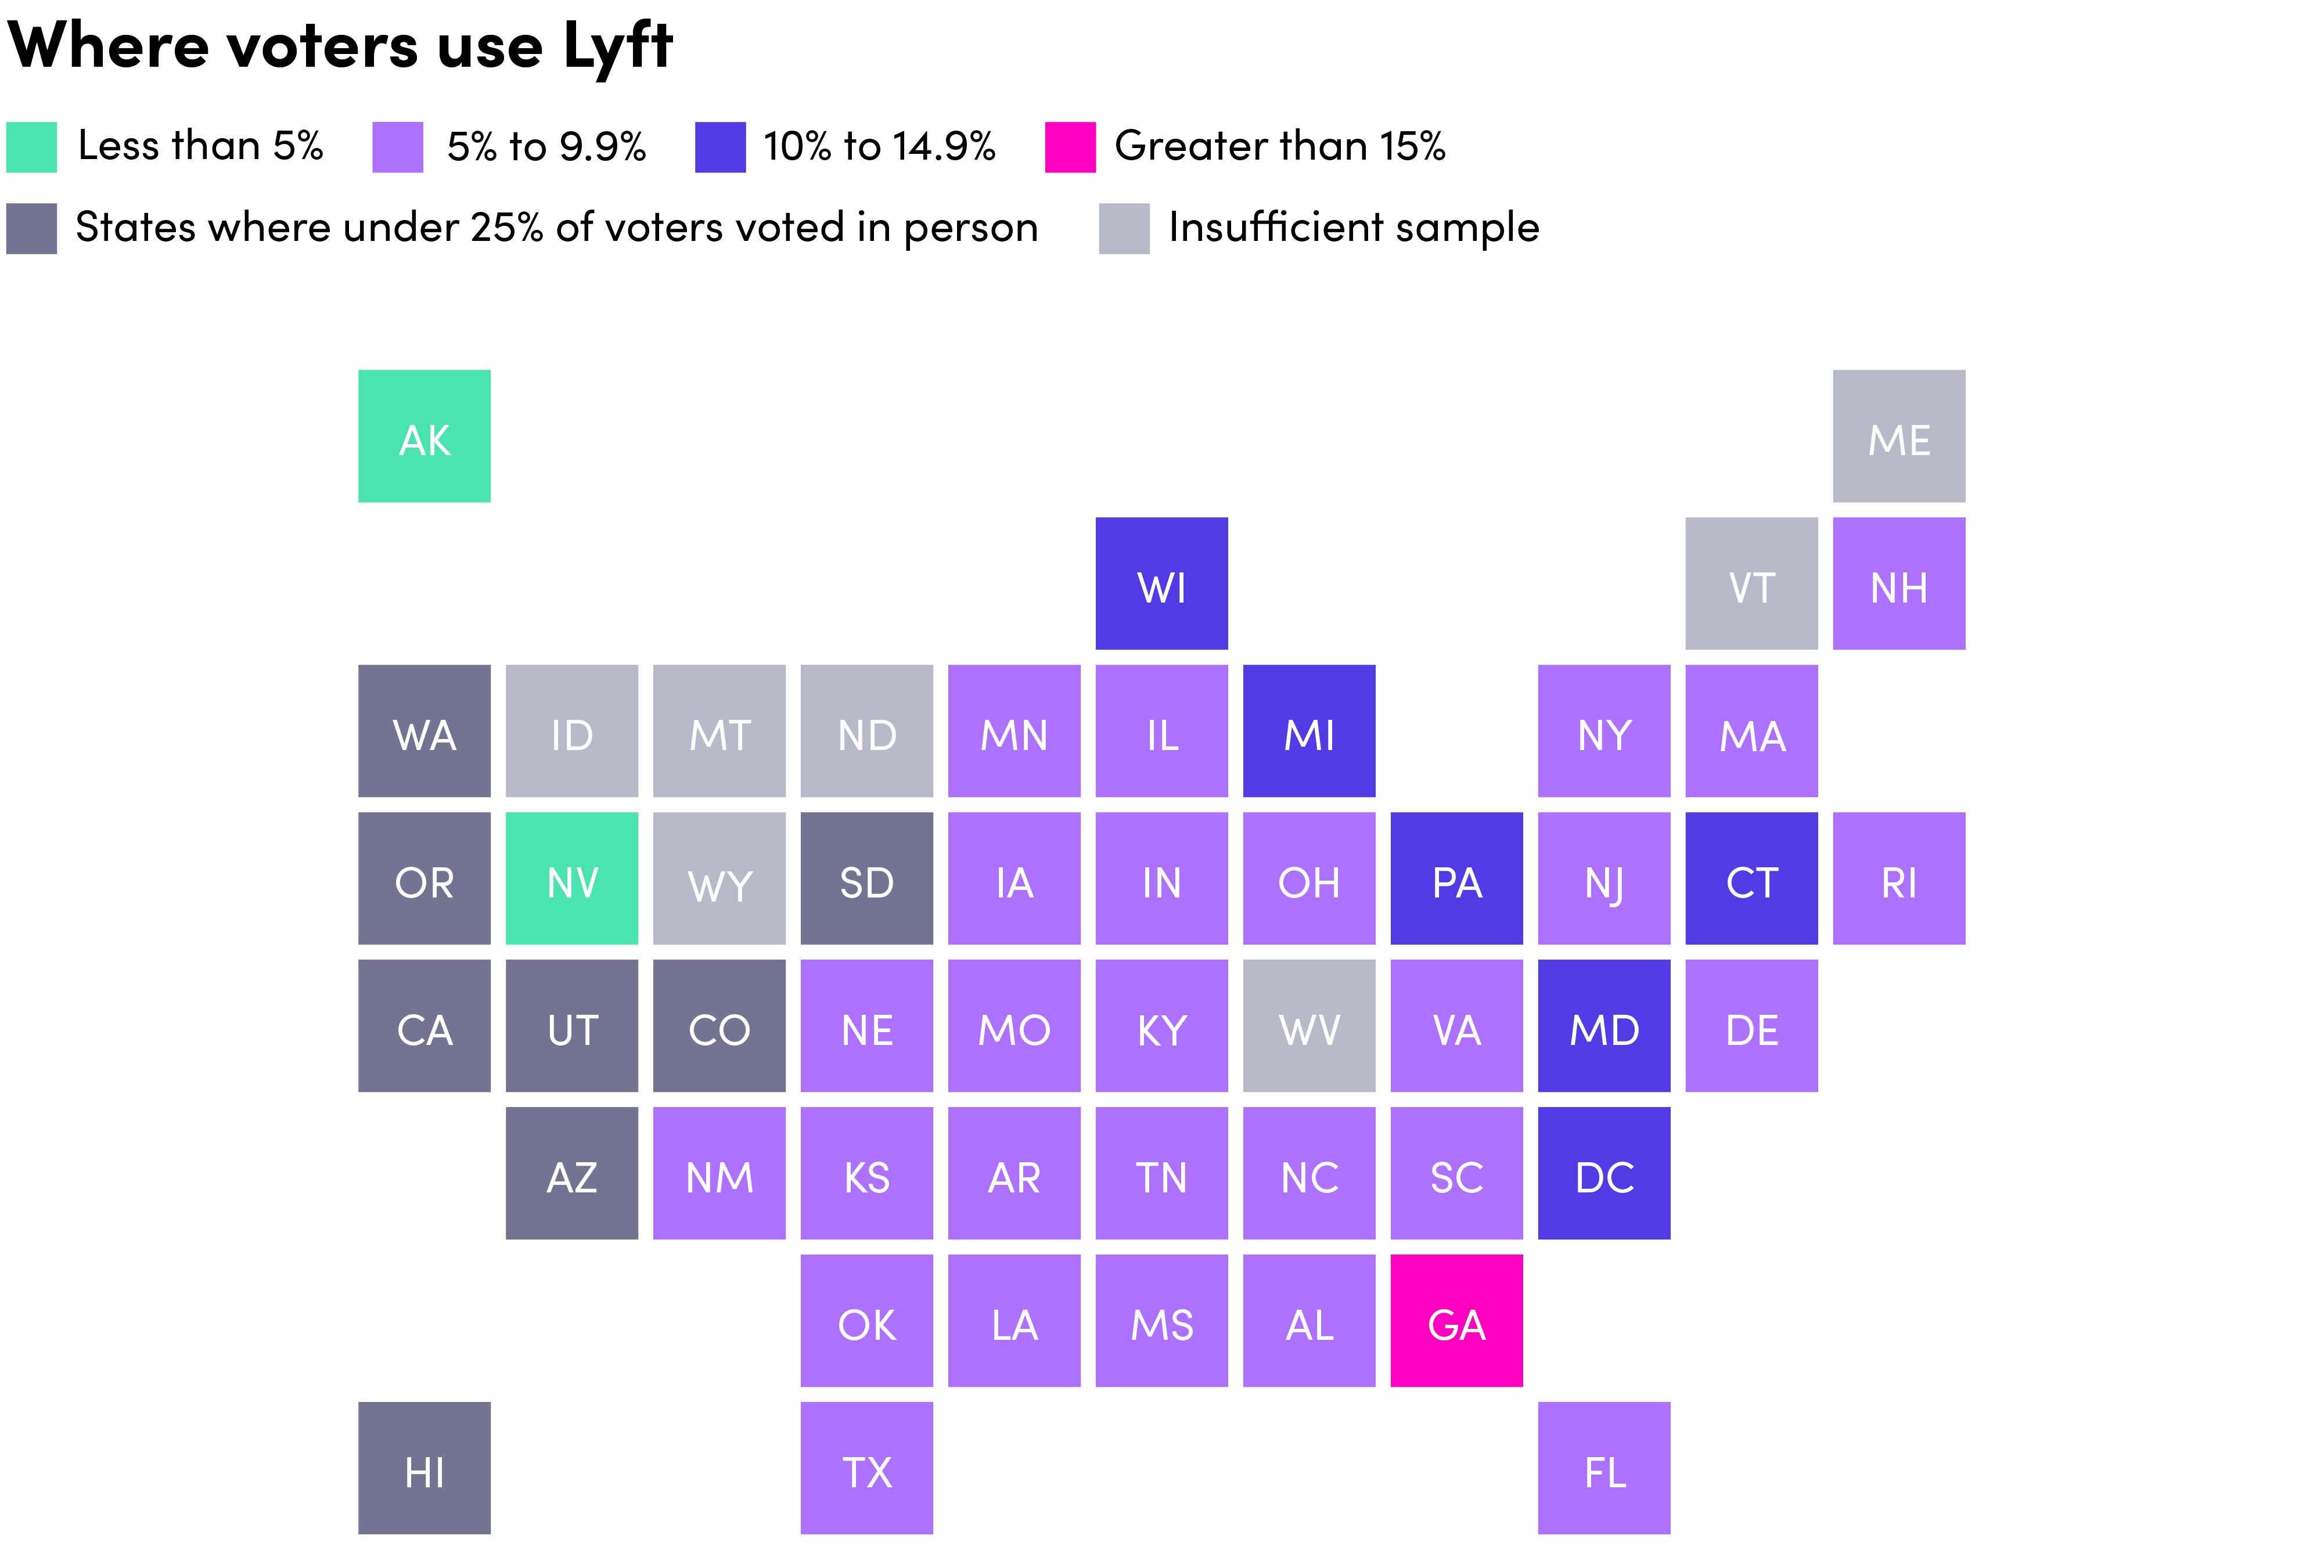
Graphic showing locations that people use Lyft for election day.
The sample includes all Lyft rides in the U.S. on November 8, 2022 to/from poll-like locations (see below) by riders who had not previously been dropped off at or picked up from that location. States with an insufficient number of observations in the Lyft data were excluded, as were states where less than 25% of voters did so in person, per the 2022 EAVS Report.
Definitions
- Poll-like locations: Libraries, schools, and civic and religious buildings.
- How far people travel to the polls: median distance, in miles, to/from the poll-like locations.
- When people vote: The most common time at which riders are dropped off / picked up at poll-like locations.
- E-day bump: The share of rides to poll-like locations from new riders that year relative to a typical Tuesday in October or November 2022.
- How long it takes to vote: Median amount of time (in minutes) between drop-off and request for pickup from the same location (excluding requests occurring over three hours after initial dropoff) for riders using one of Lyft’s voting coupon codes on November 8, 2022.
This story was produced by Lyft and reviewed and distributed by Stacker Media.
