States with the most unfunded retirement benefits

Ground Picture // Shutterstock
States with the most unfunded retirement benefits
Older woman with coffee mug looking at computer.
Most U.S. states promise their employees pensions upon retirement, but aren’t saving enough money to be able to deliver on those promises. The fallout could threaten state budgets more broadly.
In a pension plan, employees and employers both pay into a system which the employer invests in order to be able to make payouts when the employee retires. Employees’ contributions are deducted from every paycheck.
But when state budgets are tight, many states put off paying the employer’s share. This leaves them with payments due to fund future pension payments. This debt tends to be a state’s largest financial liability, according to Pew, ahead of retiree health care benefits and overall debt. When the liabilities get too high, states may be forced to take money out of health care, safety, and education to meet minimum requirements for funding pension plans.
Stacker examined pension liability data compiled by Pew Trusts to see which states have the highest rates of unfunded retirement benefits. The analysis shows the states that have the highest unfunded pension liabilities (for state-administered defined benefit plans), unfunded retiree health care costs, and tax-supported state debt. These figures are all expressed as a share of overall personal income in a state, excluding capital gains, to normalize the size of the liability based on the state’s potential tax income. States are ranked by the ratio of unfunded pension liabilities to income, with ties broken by the percentage point change from 2007 to 2019.
Liabilities vary depending on the size of a state’s budget and population, as well as the health of the overall economy. Collectively, states’ unfunded pension benefits added up to $1.25 trillion in fiscal year 2019. That’s 6.8% of total income.
Only two states, South Dakota and Wisconsin, had pension plan savings that were equal to or higher than what they owed.
You may also like: Former jobs of every Supreme Court justice
![]()

Sean Pavone // Shutterstock
#50. Wisconsin
Madison state capitol in the daytime.
– Unfunded pension liabilities (2019): -1.0%
— Percentage point change from 2007: -1.2
– Unfunded retiree health care costs (2016): 0.5% (tied for #14 lowest)
— Percentage point change from 2010: -0.2
– Debt (2020): 2.7%
— Percentage point change since 2007: -1.1

Inside Creative House // Shutterstock
#49. South Dakota
Elderly couple putting coin into money box.
– Unfunded pension liabilities (2019): 0.0%
— Percentage point change from 2007: -0.6
– Unfunded retiree health care costs (2016): 0.0% (#3 lowest)
— Percentage point change from 2010: -0.2
– Debt (2020): 0.8%
— Percentage point change since 2007: +0.4

Jerome L Lawson // Shutterstock
#48. Tennessee
Social security administration brick sign.
– Unfunded pension liabilities (2019): 0.2%
— Percentage point change from 2007: -0.5
– Unfunded retiree health care costs (2016): 0.5% (tied for #14 lowest)
— Percentage point change from 2010: -0.2
– Debt (2020): 0.5%
— Percentage point change since 2007: -0.1

Dmytro Zinkevych // Shutterstock
#47. New York
Close up of a nurse helping a patient.
– Unfunded pension liabilities (2019): 0.6%
— Percentage point change from 2007: +1.5
– Unfunded retiree health care costs (2016): 7.7% (#7 highest)
— Percentage point change from 2010: +1.7
– Debt (2020): 4.9%
— Percentage point change since 2007: -0.9

SCStock // Shutterstock
#46. Washington
Seattle downtown skyline and Mt. Rainier.
– Unfunded pension liabilities (2019): 0.8%
— Percentage point change from 2007: +0.7
– Unfunded retiree health care costs (2016): 2.7% (#23 highest)
— Percentage point change from 2010: 0
– Debt (2020): 3.9%
— Percentage point change since 2007: -0.5

wutzkohphoto // Shutterstock
#45. Nebraska
Close up of a hand on a calculator.
– Unfunded pension liabilities (2019): 1.1%
— Percentage point change from 2007: +0.1
– Unfunded retiree health care costs (2016): 0.0% (tied for #1 lowest)
— Percentage point change from 2010: 0
– Debt (2020): 0.0%
— Percentage point change since 2007: 0

Charles Knowles // Shutterstock
#44. Idaho
Boise street leading to the capitol building in fall.
– Unfunded pension liabilities (2019): 1.2%
— Percentage point change from 2007: +2.4
– Unfunded retiree health care costs (2016): 0.2% (tied for #9 lowest)
— Percentage point change from 2010: -0.1
– Debt (2020): 1.0%
— Percentage point change since 2007: -0.1

Sean Pavone // Shutterstock
#43. Utah
Salt Lake City downtown city skyline at dusk.
– Unfunded pension liabilities (2019): 2.0%
— Percentage point change from 2007: +0.8
– Unfunded retiree health care costs (2016): 0.1% (tied for #7 lowest)
— Percentage point change from 2010: -0.3
– Debt (2020): 1.7%
— Percentage point change since 2007: 0

Monkey Business Images // Shutterstock
#42. North Carolina
Senior couple sitting on a wooden dock by a lake.
– Unfunded pension liabilities (2019): 2.6%
— Percentage point change from 2007: +3.4
– Unfunded retiree health care costs (2016): 7.5% (#8 highest)
— Percentage point change from 2010: -2.1
– Debt (2020): 1.0%
— Percentage point change since 2007: -1.5

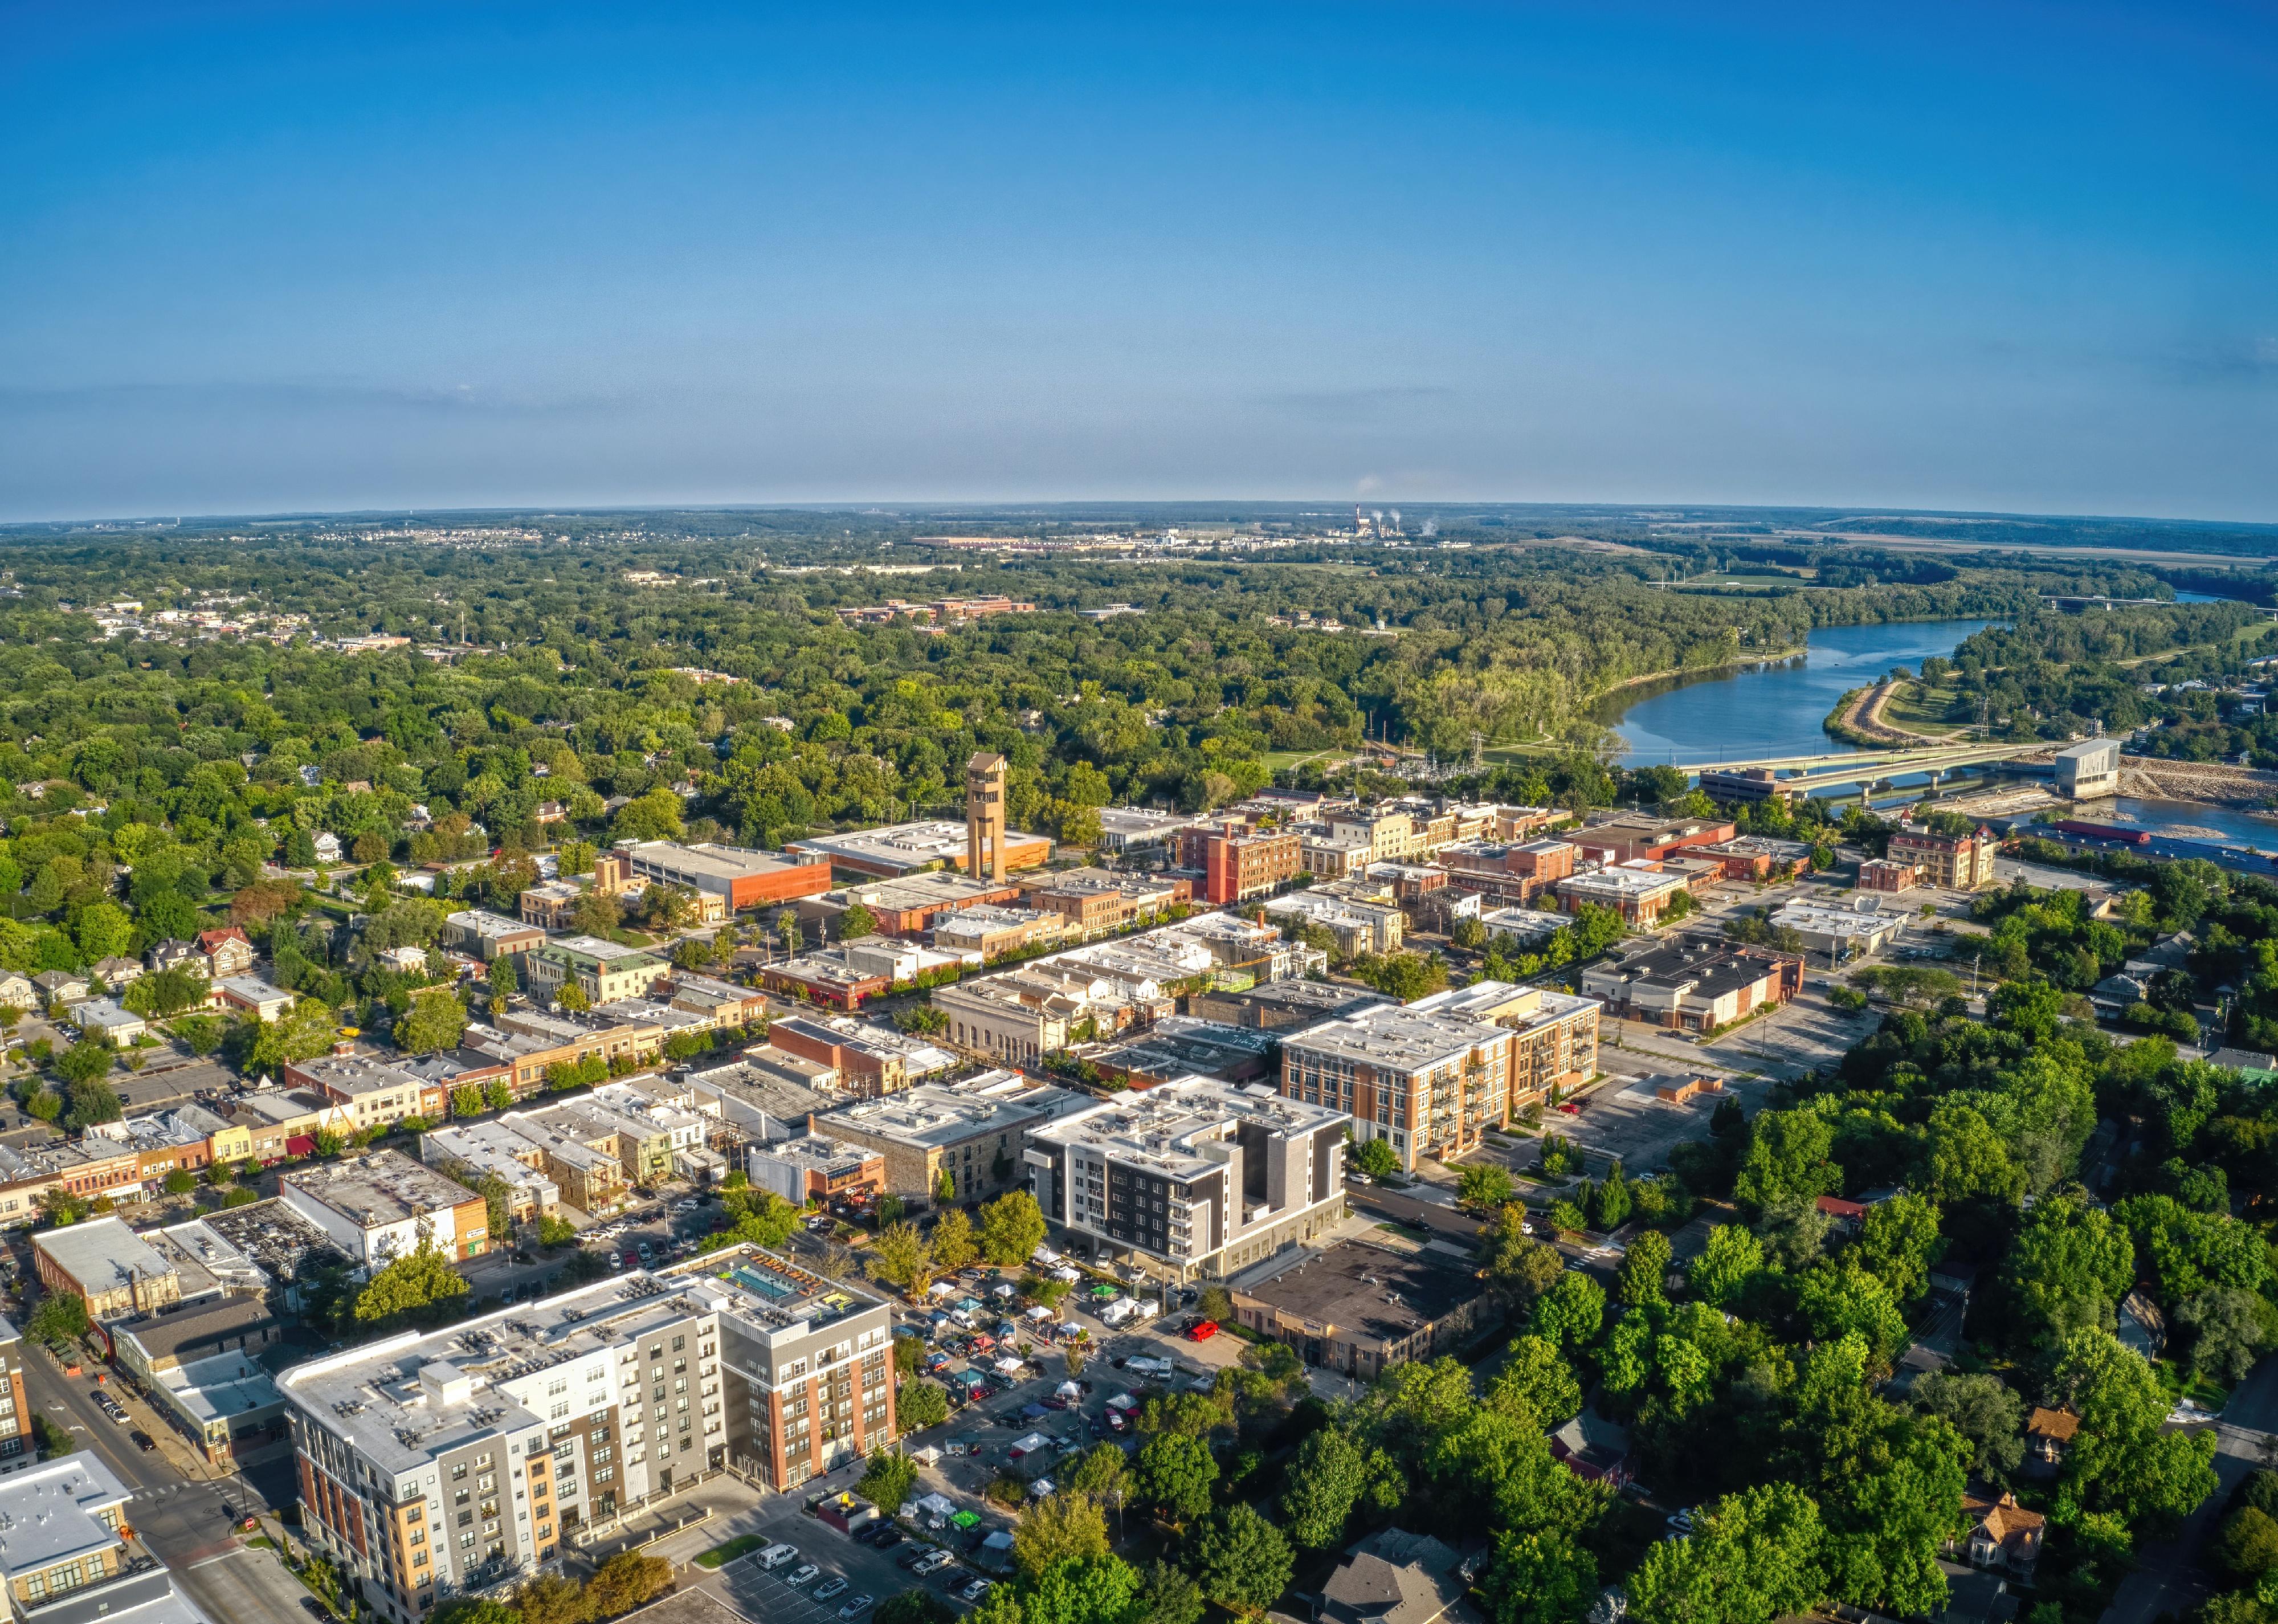
Jacob Boomsma // Shutterstock
#41. Iowa
Aerial view of downtown Council Bluffs.
– Unfunded pension liabilities (2019): 3.7%
— Percentage point change from 2007: +1.5
– Unfunded retiree health care costs (2016): 0.4% (#12 lowest)
— Percentage point change from 2010: 0
– Debt (2020): 0.3%
— Percentage point change since 2007: 0

Sergii Gnatiuk // Shutterstock
#40. Delaware
Elderly person reads a printed letter, sitting at a desk.
– Unfunded pension liabilities (2019): 3.9%
— Percentage point change from 2007: +3.6
– Unfunded retiree health care costs (2016): 15.4% (#3 highest)
— Percentage point change from 2010: -0.3
– Debt (2020): 6.1%
— Percentage point change since 2007: +1.3

J.A. Dunbar // Shutterstock
#39. Florida
Senior couple holding hands walking on the beach.
– Unfunded pension liabilities (2019): 4.0%
— Percentage point change from 2007: +4.3
– Unfunded retiree health care costs (2016): 1.0% (#17 lowest)
— Percentage point change from 2010: +0.3
– Debt (2020): 1.3%
— Percentage point change since 2007: -1.2

Sean Pavone // Shutterstock
#38. Oklahoma
Oklahoma City downtown skyline in the afternoon.
– Unfunded pension liabilities (2019): 4.1%
— Percentage point change from 2007: -4.8
– Unfunded retiree health care costs (2016): 0.0% (tied for #1 lowest)
— Percentage point change from 2010: 0
– Debt (2020): 0.7%
— Percentage point change since 2007: -0.6

Monkey Business Images // Shutterstock
#37. Maine
Retired couple sitting outdoors having coffee.
– Unfunded pension liabilities (2019): 4.1%
— Percentage point change from 2007: -1.5
– Unfunded retiree health care costs (2016): 3.0% (#21 highest)
— Percentage point change from 2010: -1.8
– Debt (2020): 1.9%
— Percentage point change since 2007: +0.2

Sean Pavone // Shutterstock
#36. West Virginia
West Virginia State Capitol on the Kanawha River in Charleston, West Virginia.
– Unfunded pension liabilities (2019): 4.2%
— Percentage point change from 2007: -3.7
– Unfunded retiree health care costs (2016): 4.0% (#14 highest)
— Percentage point change from 2010: -7.5
– Debt (2020): 3.6%
— Percentage point change since 2007: +0.1

Prostock-studio // Shutterstock
#35. Indiana
Senior talking on phone while holding paper looking concerned.
– Unfunded pension liabilities (2019): 4.3%
— Percentage point change from 2007: -0.6
– Unfunded retiree health care costs (2016): 0.1% (#7 lowest)
— Percentage point change from 2010: -0.1
– Debt (2020): 0.4%
— Percentage point change since 2007: -0.9
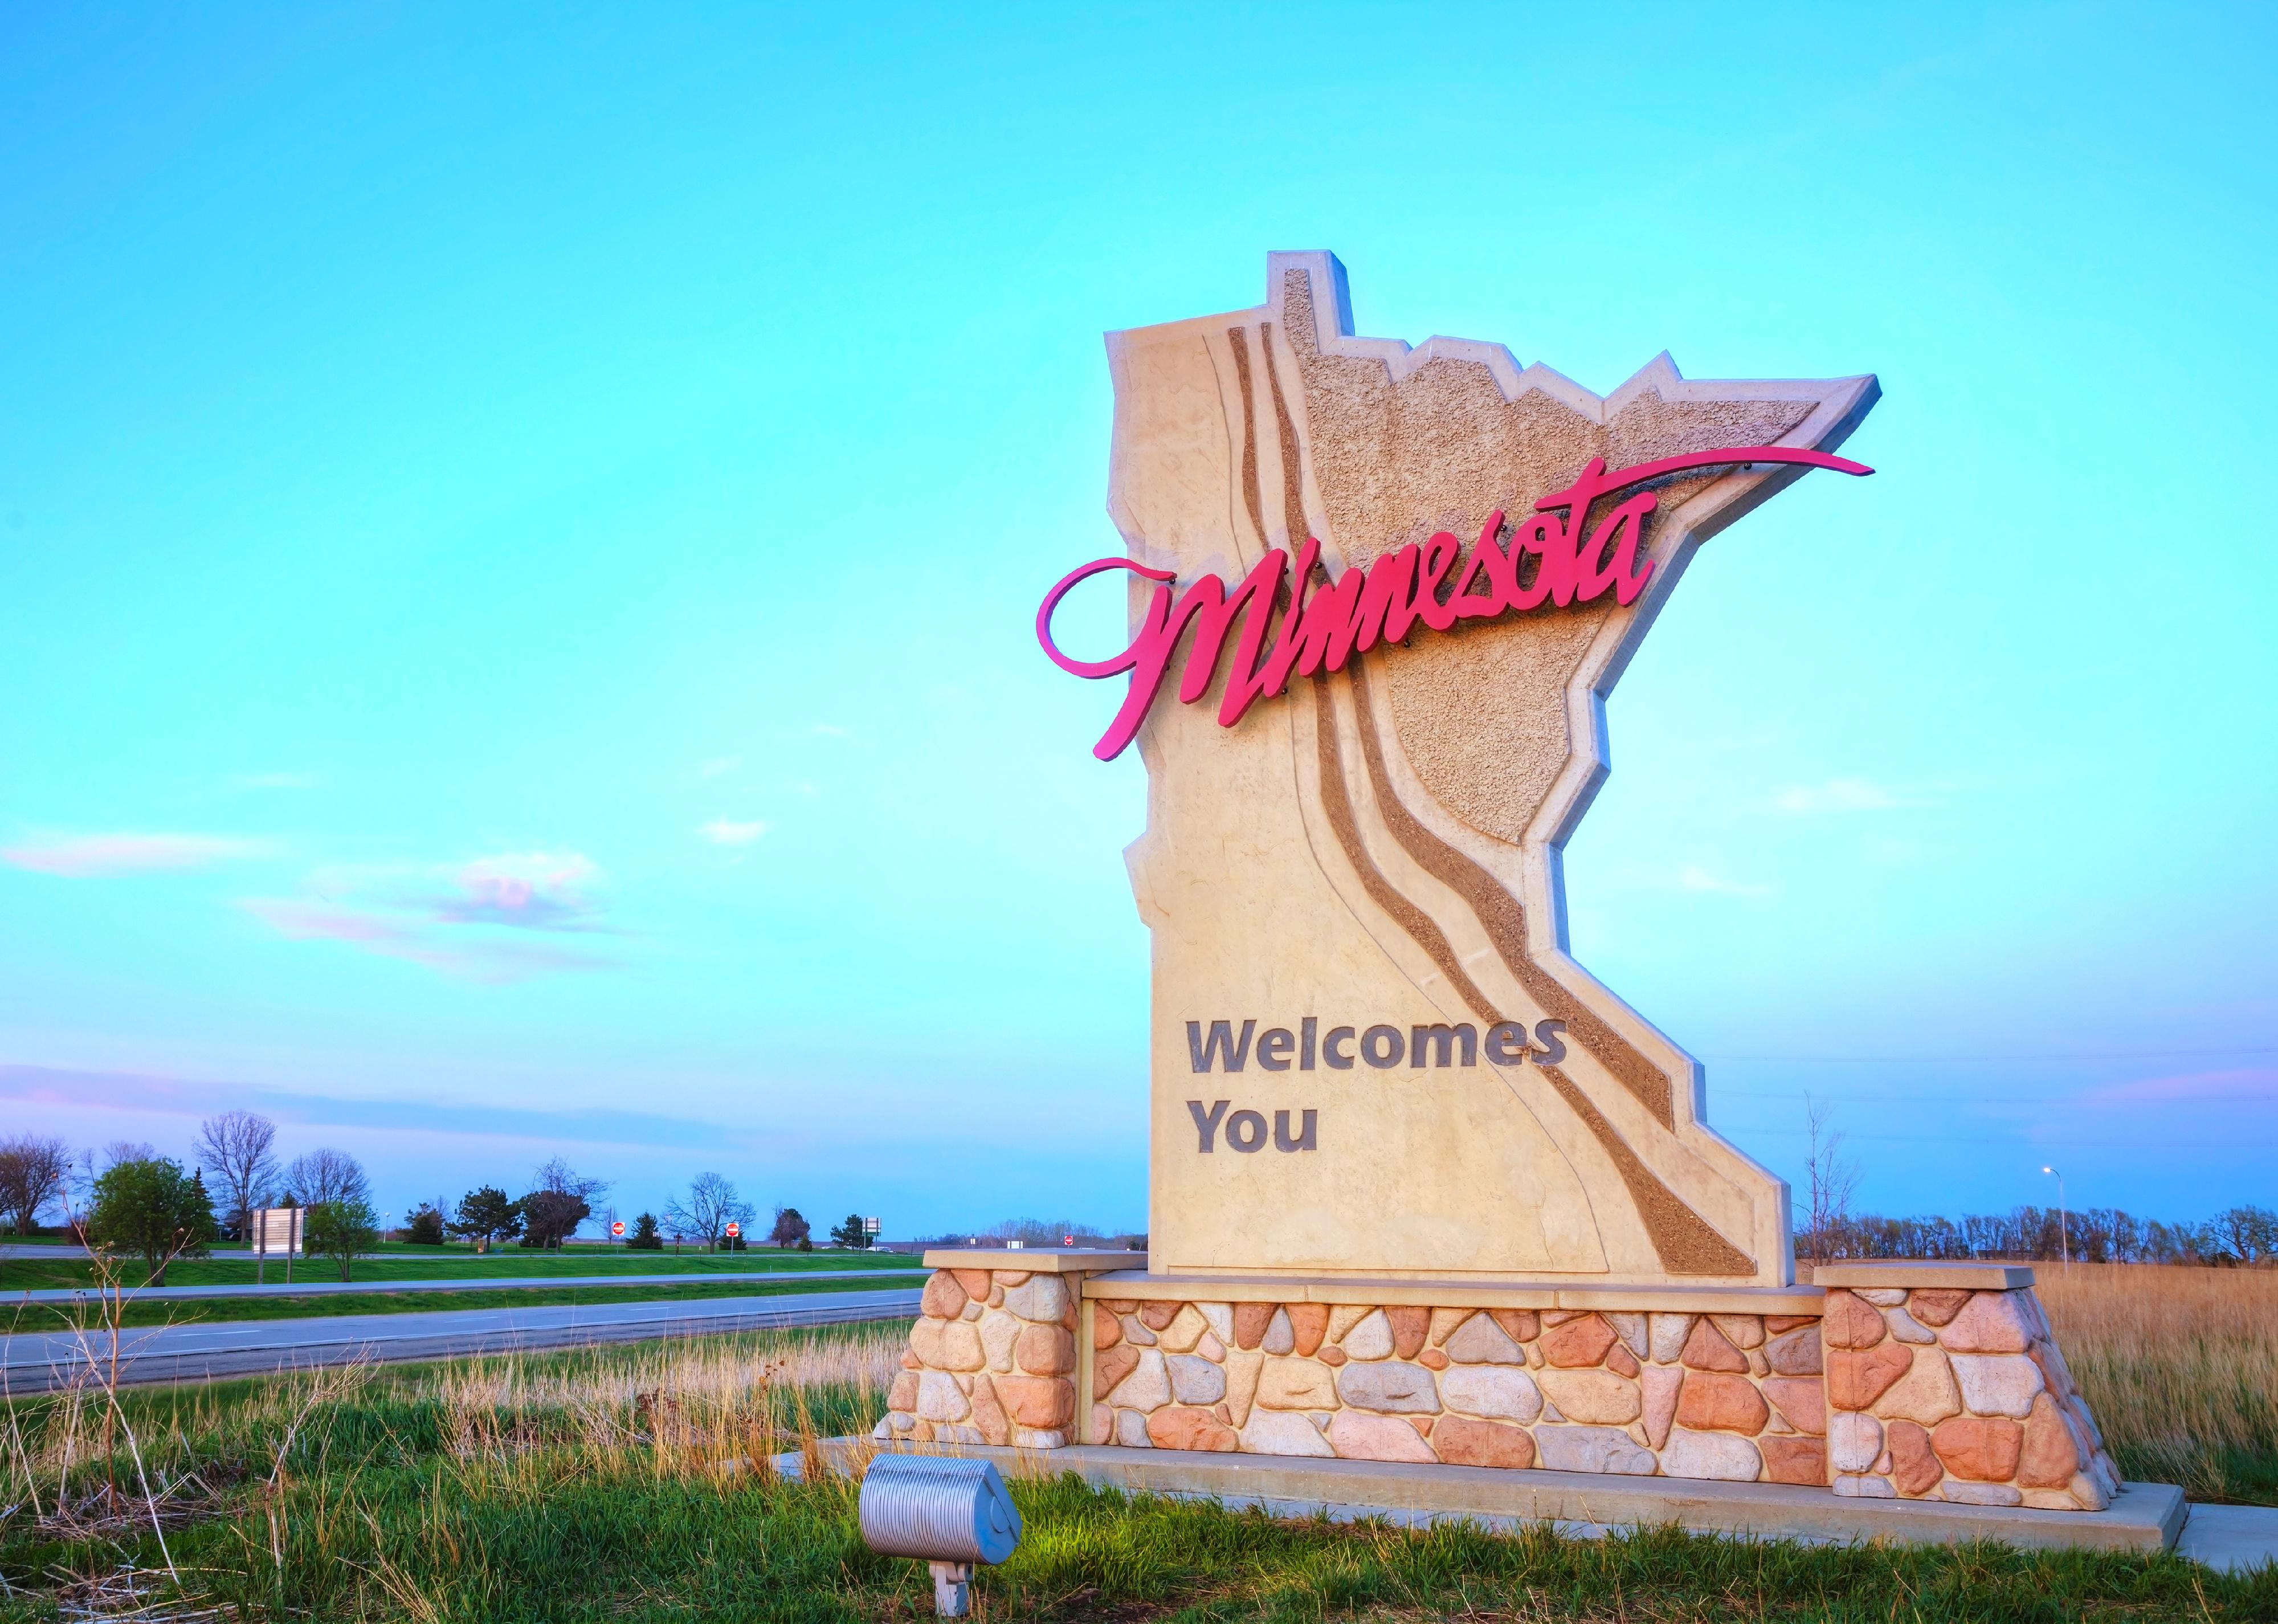
photo.ua // Shutterstock
#34. Minnesota
Minnesota welcomes you sign at the state border.
– Unfunded pension liabilities (2019): 4.6%
— Percentage point change from 2007: +0.5
– Unfunded retiree health care costs (2016): 0.3% (#11 lowest)
— Percentage point change from 2010: -0.2
– Debt (2020): 2.3%
— Percentage point change since 2007: +0.2

John S. Quinn // Shutterstock
#33. Virginia
View of Virginia beach homes near the beach.
– Unfunded pension liabilities (2019): 4.7%
— Percentage point change from 2007: +1.5
– Unfunded retiree health care costs (2016): 1.2% (#21 lowest)
— Percentage point change from 2010: -0.2
– Debt (2020): 2.8%
— Percentage point change since 2007: +1.1

Piyaset // Shutterstock
#32. Georgia
Senior’s hands holding a piggy bank.
– Unfunded pension liabilities (2019): 5.0%
— Percentage point change from 2007: +3.8
– Unfunded retiree health care costs (2016): 3.7% (#16 highest)
— Percentage point change from 2010: -1.9
– Debt (2020): 1.9%
— Percentage point change since 2007: -0.8

Maria Surtu // Shutterstock
#31. Arkansas
Elderly people enjoy a view of a lake.
– Unfunded pension liabilities (2019): 5.3%
— Percentage point change from 2007: +2.4
– Unfunded retiree health care costs (2016): 1.9% (#23 lowest)
— Percentage point change from 2010: -0.1
– Debt (2020): 1.2%
— Percentage point change since 2007: +0.4

R.A. Walker Photography // Shutterstock
#30. Texas
Man and woman with a walker witting on a bench.
– Unfunded pension liabilities (2019): 5.4%
— Percentage point change from 2007: +3.9
– Unfunded retiree health care costs (2016): 6.8% (#9 highest)
— Percentage point change from 2010: +1.2
– Debt (2020): 0.7%
— Percentage point change since 2007: -0.6

Robert Kneschke // Shutterstock
#29. New Hampshire
Elderly hands and younger hands solving a jigsaw puzzle together.
– Unfunded pension liabilities (2019): 5.6%
— Percentage point change from 2007: +1.5
– Unfunded retiree health care costs (2016): 3.9% (#15 highest)
— Percentage point change from 2010: -1.3
– Debt (2020): 1.1%
— Percentage point change since 2007: 0
Jacob Boomsma // Shutterstock
#28. Kansas
Aerial view of Lawrence and Kansas State University.
– Unfunded pension liabilities (2019): 5.7%
— Percentage point change from 2007: +0.5
– Unfunded retiree health care costs (2016): 0.2% (#10 lowest)
— Percentage point change from 2010: -0.3
– Debt (2020): 2.6%
— Percentage point change since 2007: -0.6

StockImageFactory.com // Shutterstock
#27. Missouri
Senior couple working on finances together.
– Unfunded pension liabilities (2019): 5.7%
— Percentage point change from 2007: +1.7
– Unfunded retiree health care costs (2016): 1.1% (#19 lowest)
— Percentage point change from 2010: -0.2
– Debt (2020): 0.8%
— Percentage point change since 2007: -1.1

Ground Picture // Shutterstock
#26. Maryland
Senior with laptop and smartphone.
– Unfunded pension liabilities (2019): 5.7%
— Percentage point change from 2007: +2.1
– Unfunded retiree health care costs (2016): 3.5% (#19 highest)
— Percentage point change from 2010: -2.1
– Debt (2020): 3.6%
— Percentage point change since 2007: +0.9
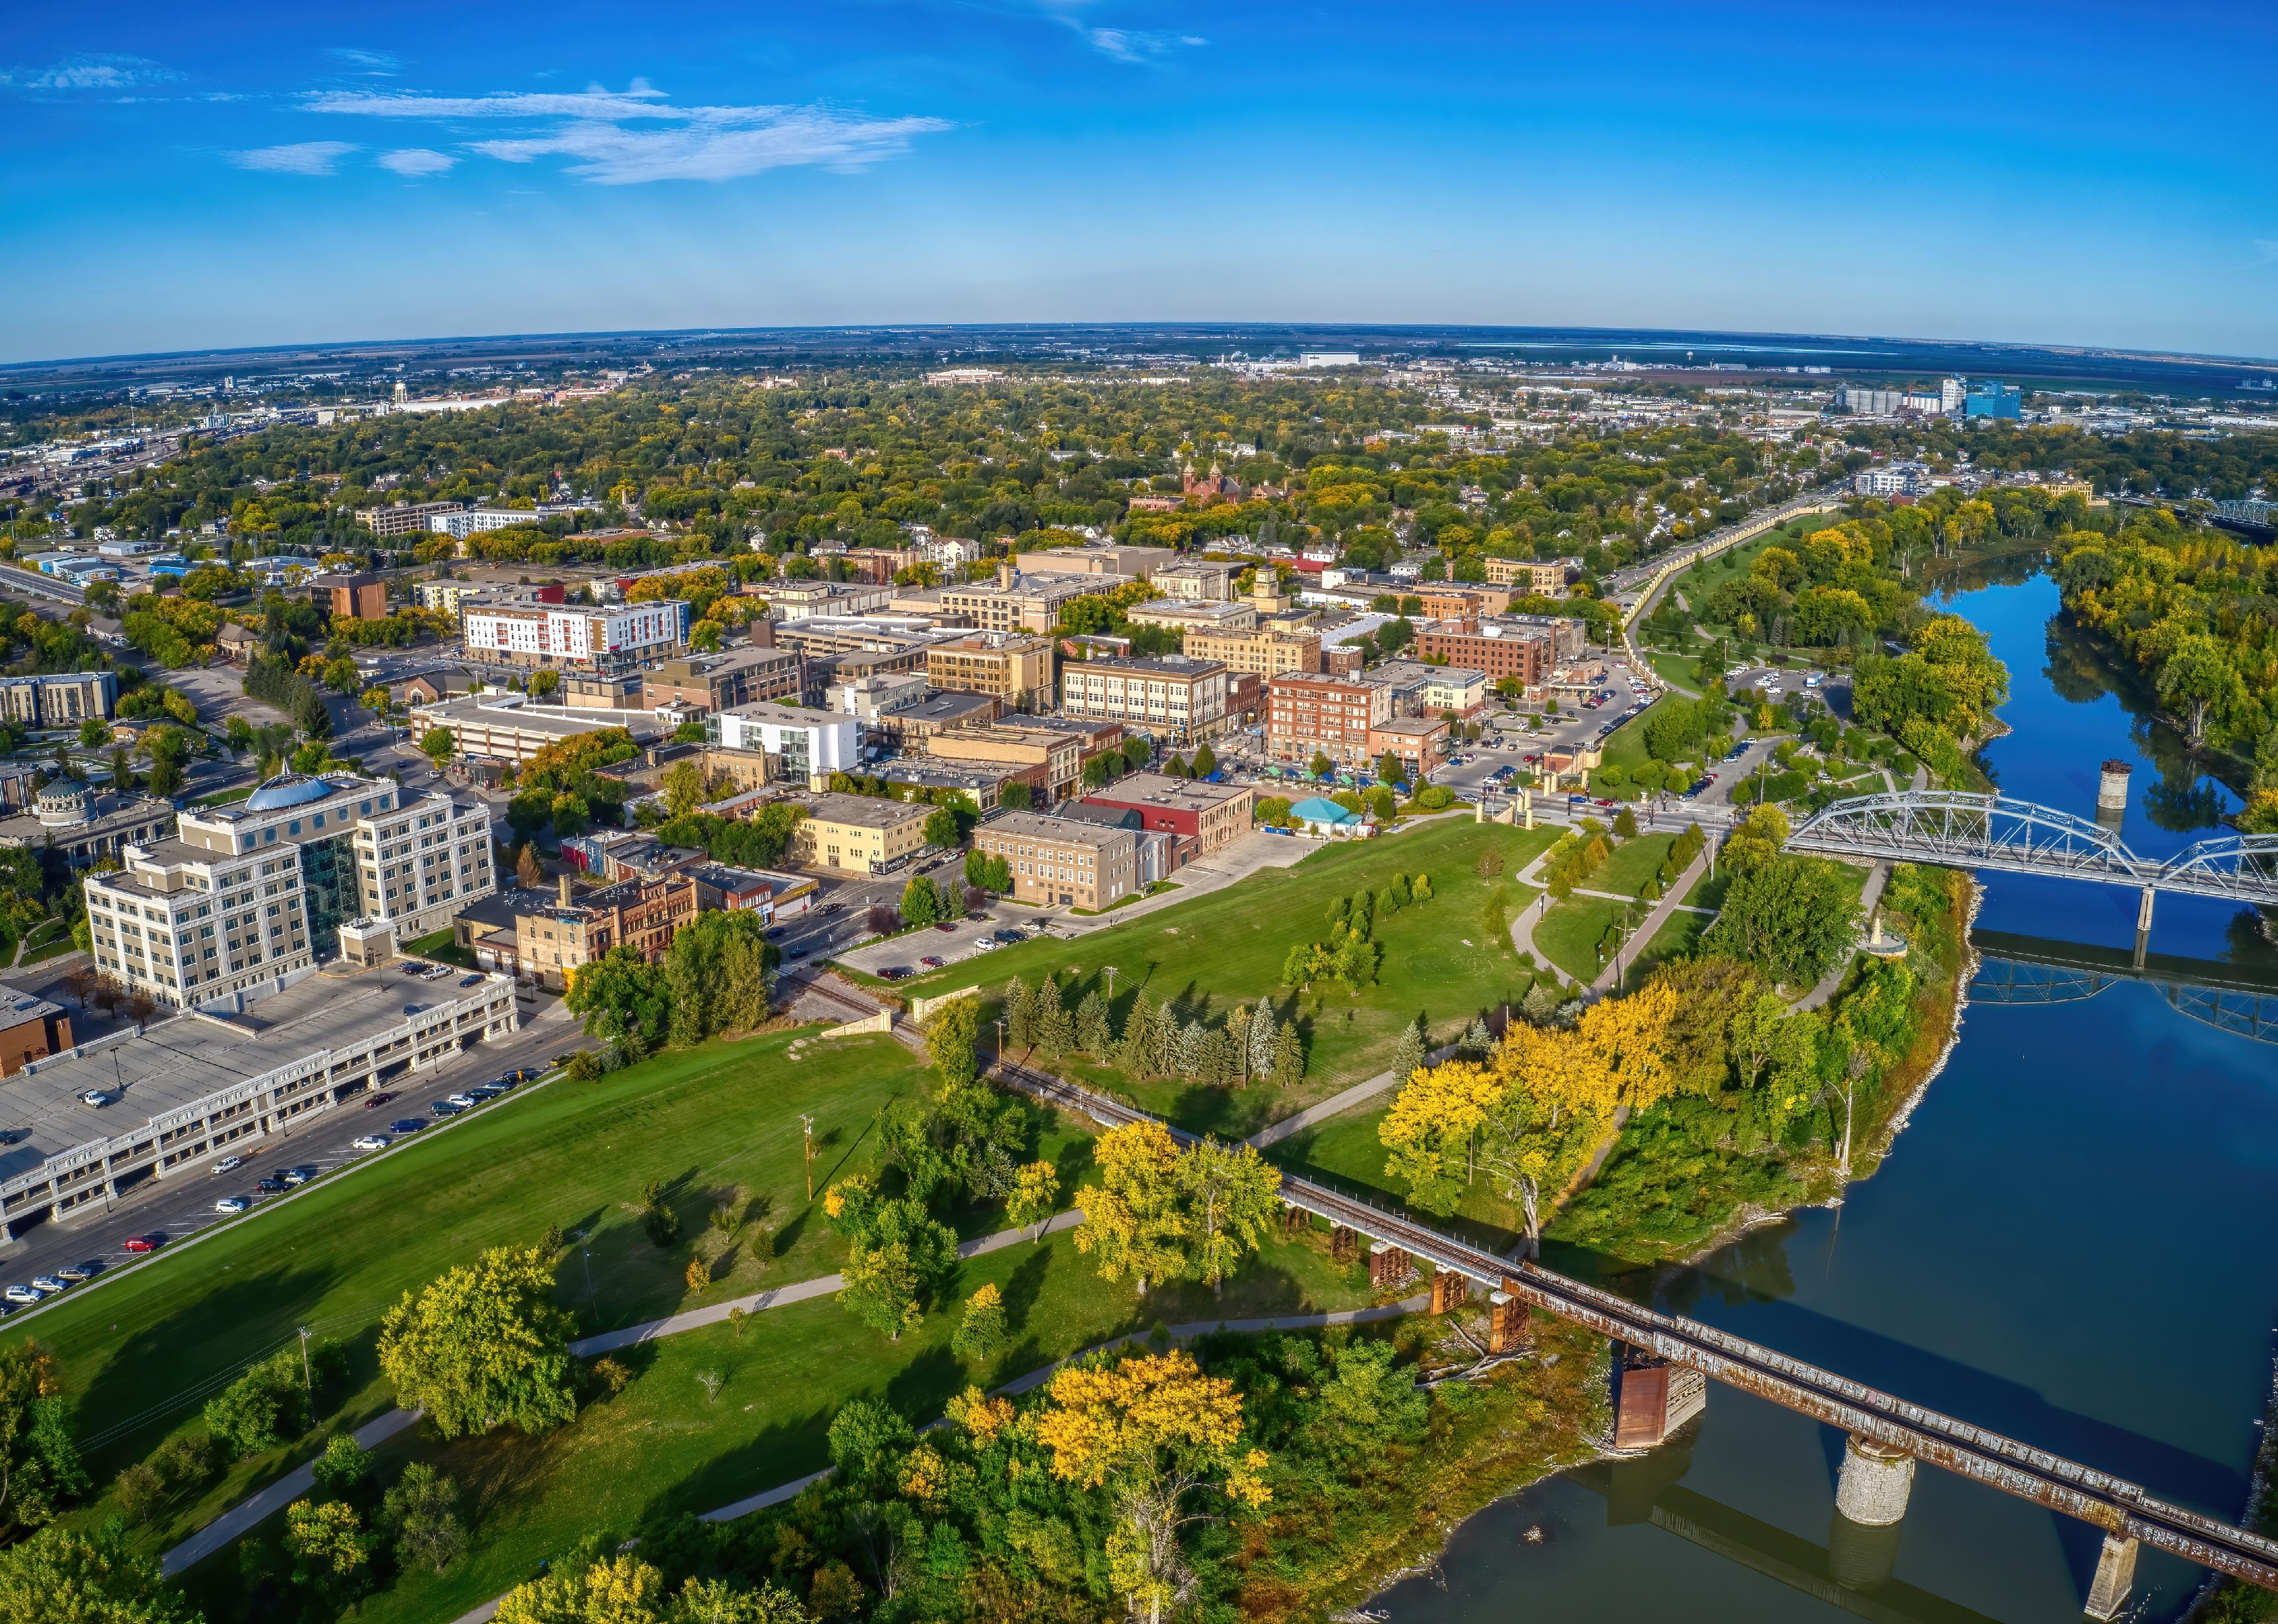
Jacob Boomsma // Shutterstock
#25. North Dakota
Aerial view of Grand Forks in autumn.
– Unfunded pension liabilities (2019): 5.7%
— Percentage point change from 2007: +3.4
– Unfunded retiree health care costs (2016): 0.2% (tied for #9 lowest)
— Percentage point change from 2010: -0.1
– Debt (2020): 0.1%
— Percentage point change since 2007: -0.9

DisobeyArt // Shutterstock
#24. Ohio
Smiley people doing yoga class at city park.
– Unfunded pension liabilities (2019): 7.2%
— Percentage point change from 2007: +3
– Unfunded retiree health care costs (2016): 1.9% (#24 lowest)
— Percentage point change from 2010: -3.8
– Debt (2020): 2.1%
— Percentage point change since 2007: -0.5

Rawpixel.com // Shutterstock
#23. California
Elderly couple enjoying cotton candy at Pacific Park in Santa Monica.
– Unfunded pension liabilities (2019): 7.3%
— Percentage point change from 2007: +4
– Unfunded retiree health care costs (2016): 3.5% (#20 highest)
— Percentage point change from 2010: -1.3
– Debt (2020): 3.1%
— Percentage point change since 2007: -0.9

PeopleImages.com – Yuri A // Shutterstock
#22. Colorado
Elderly couple working on a budget on couch.
– Unfunded pension liabilities (2019): 7.5%
— Percentage point change from 2007: +1
– Unfunded retiree health care costs (2016): 0.7% (#16 lowest)
— Percentage point change from 2010: -0.2
– Debt (2020): 1.1%
— Percentage point change since 2007: +0.4

NEKVT // Shutterstock
#21. Vermont
Aerial view of Peacham in the fall.
– Unfunded pension liabilities (2019): 7.5%
— Percentage point change from 2007: +6.8
– Unfunded retiree health care costs (2016): 5.8% (#10 highest)
— Percentage point change from 2010: -0.4
– Debt (2020): 1.9%
— Percentage point change since 2007: +0.1

Monkey Business Images // Shutterstock
#20. Wyoming
Couple reviewing and signing paperwork in kitchen.
– Unfunded pension liabilities (2019): 7.8%
— Percentage point change from 2007: +6.3
– Unfunded retiree health care costs (2016): 2.1% (#25 lowest)
— Percentage point change from 2010: +1.2
– Debt (2020): 0.0%
— Percentage point change since 2007: -0.2

Josemaria Toscano // Shutterstock
#19. Oregon
Sunrise view of Portland from the Pittock Mansion.
– Unfunded pension liabilities (2019): 7.8%
— Percentage point change from 2007: +12.7
– Unfunded retiree health care costs (2016): 0.1% (tied for #7 lowest)
— Percentage point change from 2010: -0.3
– Debt (2020): 3.6%
— Percentage point change since 2007: -1

Jacob Lund // Shutterstock
#18. Alabama
Retired couple walking around the town with a map.
– Unfunded pension liabilities (2019): 7.9%
— Percentage point change from 2007: +2.7
– Unfunded retiree health care costs (2016): 4.6% (#13 highest)
— Percentage point change from 2010: -4.6
– Debt (2020): 2.2%
— Percentage point change since 2007: -0.4

Michael Sean OLeary // Shutterstock
#17. Massachusetts
Person fishing on small boat on lake.
– Unfunded pension liabilities (2019): 7.9%
— Percentage point change from 2007: +4.2
– Unfunded retiree health care costs (2016): 3.7% (#17 highest)
— Percentage point change from 2010: -0.6
– Debt (2020): 8.0%
— Percentage point change since 2007: +0.9

wavebreakmedia // Shutterstock
#16. Arizona
Senior couple working with their bills at home.
– Unfunded pension liabilities (2019): 8.0%
— Percentage point change from 2007: +4.5
– Unfunded retiree health care costs (2016): 0.0% (#4 lowest)
— Percentage point change from 2010: -0.3
– Debt (2020): 0.9%
— Percentage point change since 2007: -0.9

Kristi Blokhin // Shutterstock
#15. Louisiana
Couple walking by stores in downtown New Orleans.
– Unfunded pension liabilities (2019): 8.2%
— Percentage point change from 2007: +1.5
– Unfunded retiree health care costs (2016): 2.7% (#22 highest)
— Percentage point change from 2010: -4
– Debt (2020): 3.1%
— Percentage point change since 2007: +0.7

Ground Picture // Shutterstock
#14. Montana
Elderly person using wooden walking cane.
– Unfunded pension liabilities (2019): 8.4%
— Percentage point change from 2007: +3.9
– Unfunded retiree health care costs (2016): 1.0% (#18 lowest)
— Percentage point change from 2010: -0.5
– Debt (2020): 0.3%
— Percentage point change since 2007: -0.7

Hanson L // Shutterstock
#13. Michigan
Michigan Theater on State Street in downtown Ann Arbor.
– Unfunded pension liabilities (2019): 8.4%
— Percentage point change from 2007: +6.2
– Unfunded retiree health care costs (2016): 2.1% (#25 highest)
— Percentage point change from 2010: -10.4
– Debt (2020): 1.2%
— Percentage point change since 2007: -0.9

Monkey Business Images // Shutterstock
#12. Nevada
Senior relaxing in hammock with e-book.
– Unfunded pension liabilities (2019): 8.6%
— Percentage point change from 2007: +2.5
– Unfunded retiree health care costs (2016): 1.1% (#20 lowest)
— Percentage point change from 2010: -0.5
– Debt (2020): 1.1%
— Percentage point change since 2007: -0.5

Sean Pavone // Shutterstock
#11. Pennsylvania
Downtown skyline of Pittsburgh.
– Unfunded pension liabilities (2019): 8.8%
— Percentage point change from 2007: +6.8
– Unfunded retiree health care costs (2016): 3.6% (#18 highest)
— Percentage point change from 2010: +0.4
– Debt (2020): 2.3%
— Percentage point change since 2007: +0.2

Me dia // Shutterstock
#10. Rhode Island
Close up shot of person opening empty wallet.
– Unfunded pension liabilities (2019): 9.2%
— Percentage point change from 2007: -2.1
– Unfunded retiree health care costs (2016): 1.4% (#22 lowest)
— Percentage point change from 2010: -0.5
– Debt (2020): 3.9%
— Percentage point change since 2007: -0.4

f11photo // Shutterstock
#9. South Carolina
Historical downtown area of Charleston.
– Unfunded pension liabilities (2019): 11.1%
— Percentage point change from 2007: +3.5
– Unfunded retiree health care costs (2016): 5.2% (#11 highest)
— Percentage point change from 2010: -0.8
– Debt (2020): 0.9%
— Percentage point change since 2007: -2.1

SeventyFour // Shutterstock
#8. Connecticut
Group of smiling senior people dancing.
– Unfunded pension liabilities (2019): 14.8%
— Percentage point change from 2007: +7.3
– Unfunded retiree health care costs (2016): 8.8% (#5 highest)
— Percentage point change from 2010: -3.2
– Debt (2020): 8.9%
— Percentage point change since 2007: +2.5

Rotorhead 30A Productions // Shutterstock
#7. Kentucky
Aerial view of Covington and downtown Cincinnati from Devou Park.
– Unfunded pension liabilities (2019): 15.2%
— Percentage point change from 2007: +7.5
– Unfunded retiree health care costs (2016): 2.6% (#24 highest)
— Percentage point change from 2010: -2.6
– Debt (2020): 4.2%
— Percentage point change since 2007: -0.2

Katherine Welles // Shutterstock
#6. Mississippi
The Mississippi State Capitol Building in downtown Jackson.
– Unfunded pension liabilities (2019): 15.3%
— Percentage point change from 2007: +6.8
– Unfunded retiree health care costs (2016): 0.7% (#15 lowest)
— Percentage point change from 2010: -0.1
– Debt (2020): 4.5%
— Percentage point change since 2007: +0.2

belushi // Shutterstock
#5. New Mexico
Side view of a happy senior smiling while painting.
– Unfunded pension liabilities (2019): 15.7%
— Percentage point change from 2007: +8.6
– Unfunded retiree health care costs (2016): 4.7% (#12 highest)
— Percentage point change from 2010: -0.1
– Debt (2020): 2.2%
— Percentage point change since 2007: -2.4

Ingo70 // Shutterstock
#4. Alaska
Alaska welcome sign.
– Unfunded pension liabilities (2019): 16.3%
— Percentage point change from 2007: +4.3
– Unfunded retiree health care costs (2016): 19.7% (#1 highest)
— Percentage point change from 2010: +2.2
– Debt (2020): 1.8%
— Percentage point change since 2007: -0.3

bbernard // Shutterstock
#3. Hawaii
Senior couple sitting at table doing finances.
– Unfunded pension liabilities (2019): 18.0%
— Percentage point change from 2007: +8.5
– Unfunded retiree health care costs (2016): 12.7% (#4 highest)
— Percentage point change from 2010: -15.3
– Debt (2020): 10.4%
— Percentage point change since 2007: +1.7

Page Light Studios // Shutterstock
#2. Illinois
Senior couple walking in Millennium Park.
– Unfunded pension liabilities (2019): 19.4%
— Percentage point change from 2007: +11.6
– Unfunded retiree health care costs (2016): 8.0% (#6 highest)
— Percentage point change from 2010: -0.1
– Debt (2020): 4.5%
— Percentage point change since 2007: -0.2

Jacob Lund // Shutterstock
#1. New Jersey
Close up shot of a person signing a document.
– Unfunded pension liabilities (2019): 20.2%
— Percentage point change from 2007: +13.7
– Unfunded retiree health care costs (2016): 15.5% (#2 highest)
— Percentage point change from 2010: -0.4
– Debt (2020): 6.2%
— Percentage point change since 2007: -0.7