How every state's casino gaming industry compares to the rest of the country

Wpadington // Shutterstock
How every state’s casino gaming industry compares to the rest of the country
Close-up of a person placing sports bets on a laptop.
Casino gaming has been integral to America’s economy since 1931, following its commercialization in Nevada by state lawmakers. Over the next few decades, a bevy of jurisdictions across the United States authorized casino gaming creating a new opportunity to drive profits and bolster the economy.
Casino gaming has allowed the market to thrive as technology and interests change. In the last few decades, online gambling has bridged the gap between casinos and consumers, allowing operators to generate additional revenue and expand their reach. It has also benefited consumers, who are offered upgraded visual and design experiences thanks to ever-evolving technology.
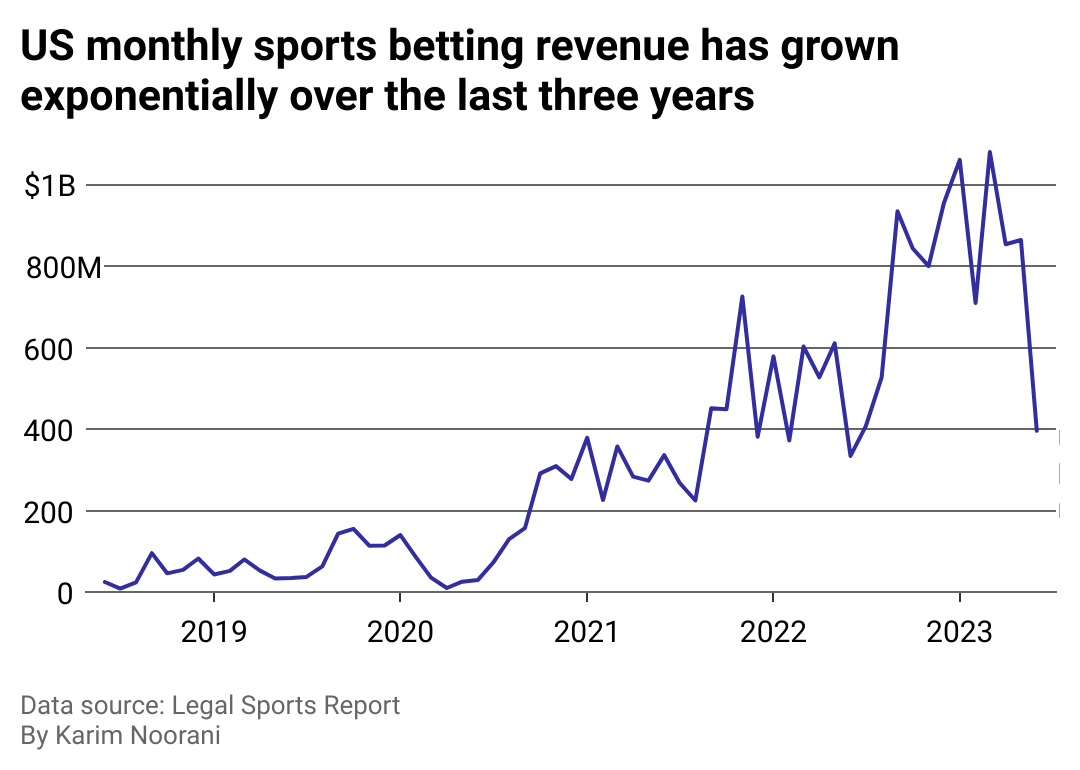
The casino gaming industry has also seen gains from the emergence of sports betting. In 2018, the Supreme Court permitted states outside Nevada to offer sanctioned sports betting, opening a new way for sports fans across America to immerse themselves in gaming. Since then, sports betting has become a market projected to generate $182.12 billion in global revenue by 2030.
Despite the evolution of online gambling and sports betting, casino gaming remains relevant. The industry provides states across America with jobs and support for their local governments and tribes. As more casinos operate in the state, employment and revenue increase. In 2022 alone, U.S. commercial gaming operations paid state and local governments a record $13.49 billion in direct gaming tax revenue—a 15% increase year over year.
ATS.io compiled a list of every state’s casino gaming industry—including sports betting, traditional gaming, and iGaming—to see how it compares to the rest of the country, using American Gaming Association data. Economic impact tallies casino patrons’ revenue, jobs, taxes, and ancillary spending. States with no publicly available casino gaming information were excluded. State population from the American Community Survey and state gross domestic product from the Bureau of Economic Analysis were used to normalize data. Data is as of Dec. 31, 2022. See how each state’s casino industry compares.
![]()
ATS.io
Nevada’s casino gaming industry laps the field in supported jobs
Nevada’s casino gaming industry supports nearly 13,000 jobs per 100K residents.
It’s likely no surprise that Nevada, home of Las Vegas and Reno, ranks highest in the country when it comes to jobs supported by the casino gaming industry. With nearly 13,000 jobs per 100,000 residents, Nevada has more than six times as many people working in the industry as the second-highest state (Oklahoma) and 5,000 more than the rest of the top 10 states combined per capita.
The casino gaming industry supports 386,200 jobs, 27% of the state’s workforce, according to a 2023 Nevada Resort Association report.
The second and third biggest states regarding jobs supported by the industry are Oklahoma and Mississippi, respectively. The former has a particularly thriving tribal gaming industry: Oklahoma collected more than $191.5 million in tribal gaming exclusivity fees alone in 2022, an 18% increase from the year prior.
Meanwhile, Mississippi crossed $3 billion in revenue from the gaming industry overall for the first time in 2022, about $2.5 billion of which came from the industry directly and an additional $800 million tangentially coming from hotels and food.
Alabama
Number of casinos: 3 casinos (fourth lowest per one million residents)
Economic impact: $1.4 billion (13th lowest in relation to state GDP)
Jobs supported: 12,270 jobs (11th lowest per 100K residents)
Tax impact & tribal revenue share: $149.8 million (seventh lowest in relation to state GDP)
Alaska
Number of casinos: 2 casinos (19th lowest per one million residents)
Economic impact: $3.7 million (lowest in the country in relation to state GDP)
Jobs supported: 27 jobs (lowest in the country per 100K residents)
Tax impact & tribal revenue share: $350,528 (lowest in the country in relation to state GDP)
Arizona
Number of casinos: 27 casinos (16th highest per one million residents)
Economic impact: $4.8 billion (eighth highest in relation to state GDP)
Jobs supported: 38,069 jobs (ninth highest per 100K residents)
Tax impact & tribal revenue share: $691.4 million (16th highest in relation to state GDP)
Gross gaming revenue: $582.9 million (seventh lowest in relation to state GDP)
Arkansas
Number of casinos: 3 casinos (ninth lowest per one million residents)
Gross gaming revenue: $614.1 million (16th highest in relation to state GDP)
California
Number of casinos: 85 casinos (16th lowest per one million residents)
Economic impact: $20.0 billion (15th lowest in relation to state GDP)
Jobs supported: 124,274 jobs (17th lowest per 100K residents)
Tax impact & tribal revenue share: $3.5 billion (12th lowest in relation to state GDP)
Gross gaming revenue: $8.4 billion (15th lowest in relation to state GDP)
Colorado
Number of casinos: 35 casinos (ninth highest per one million residents)
Economic impact: $1.8 billion (11th lowest in relation to state GDP)
Jobs supported: 10,842 jobs (10th lowest per 100K residents)
Tax impact & tribal revenue share: $403.5 million (10th lowest in relation to state GDP)
Gross gaming revenue: $1.4 billion (17th lowest in relation to state GDP)
Connecticut
Number of casinos: 2 casinos (third lowest per one million residents)
Economic impact: $3.7 billion (seventh highest in relation to state GDP)
Jobs supported: 24,245 jobs (sixth highest per 100K residents)
Tax impact & tribal revenue share: $768.9 million (12th highest in relation to state GDP)
Gross gaming revenue: $416.2 million (eighth lowest in relation to state GDP)
Delaware
Number of casinos: 3 casinos (18th highest per one million residents)
Economic impact: $685.3 million (14th highest in relation to state GDP)
Jobs supported: 5,299 jobs (eighth highest per 100K residents)
Tax impact & tribal revenue share: $295.9 million (seventh highest in relation to state GDP)
Gross gaming revenue: $491.8 million (12th highest in relation to state GDP)
District of Columbia
Gross gaming revenue: $23.2 million (second lowest in relation to state GDP)
Florida
Number of casinos: 15 casinos (fifth lowest per one million residents)
Economic impact: $7.5 billion (14th lowest in relation to state GDP)
Jobs supported: 54,142 jobs (12th lowest per 100K residents)
Tax impact & tribal revenue share: $1.6 billion (17th lowest in relation to state GDP)
Gross gaming revenue: $3.2 billion (14th lowest in relation to state GDP)
Idaho
Number of casinos: 10 casinos (12th highest per one million residents)
Economic impact: $353.5 million (10th lowest in relation to state GDP)
Jobs supported: 3,305 jobs (ninth lowest per 100K residents)
Tax impact & tribal revenue share: $38.9 million (sixth lowest in relation to state GDP)
Gross gaming revenue: $157.1 million (ninth lowest in relation to state GDP)
Illinois
Number of casinos: 11 casinos (sixth lowest per one million residents)
Economic impact: $3.0 billion (seventh lowest in relation to state GDP)
Jobs supported: 15,396 jobs (sixth lowest per 100K residents)
Tax impact & tribal revenue share: $923.3 million (11th lowest in relation to state GDP)
Gross gaming revenue: $2.1 billion (13th lowest in relation to state GDP)
Indiana
Number of casinos: 13 casinos (14th lowest per one million residents)
Economic impact: $3.9 billion (12th highest in relation to state GDP)
Jobs supported: 22,133 jobs (18th highest per 100K residents)
Tax impact & tribal revenue share: $1.3 billion (ninth highest in relation to state GDP)
Gross gaming revenue: $2.9 billion (10th highest in relation to state GDP)
Kansas
Number of casinos: 11 casinos (15th highest per one million residents)
Economic impact: $1.3 billion (16th lowest in relation to state GDP)
Jobs supported: 7,457 jobs (14th lowest per 100K residents)
Tax impact & tribal revenue share: $261.5 million (17th highest in relation to state GDP)
Gross gaming revenue: $736.2 million (17th highest in relation to state GDP)
Louisiana
Number of casinos: 24 casinos (10th highest per one million residents)
Economic impact: $6.1 billion (fourth highest in relation to state GDP)
Jobs supported: 40,919 jobs (fourth highest per 100K residents)
Tax impact & tribal revenue share: $1.5 billion (fifth highest in relation to state GDP)
Gross gaming revenue: $3.2 billion (fourth highest in relation to state GDP)
Maine
Number of casinos: 2 casinos (11th lowest per one million residents)
Economic impact: $244.2 million (eighth lowest in relation to state GDP)
Jobs supported: 1,468 jobs (fifth lowest per 100K residents)
Tax impact & tribal revenue share: $86.6 million (14th lowest in relation to state GDP)
Gross gaming revenue: $165.1 million (12th lowest in relation to state GDP)
Maryland
Number of casinos: 6 casinos (eighth lowest per one million residents)
Economic impact: $3.0 billion (17th lowest in relation to state GDP)
Jobs supported: 15,364 jobs (13th lowest per 100K residents)
Tax impact & tribal revenue share: $962.2 million (14th highest in relation to state GDP)
Gross gaming revenue: $2.2 billion (14th highest in relation to state GDP)
Massachusetts
Number of casinos: 3 casinos (second lowest per one million residents)
Economic impact: $307.9 million (fourth lowest in relation to state GDP)
Jobs supported: 1,646 jobs (third lowest per 100K residents)
Tax impact & tribal revenue share: $129.2 million (fourth lowest in relation to state GDP)
Gross gaming revenue: $1.1 billion (10th lowest in relation to state GDP)
Michigan
Number of casinos: 26 casinos (18th lowest per one million residents)
Economic impact: $6.3 billion (ninth highest in relation to state GDP)
Jobs supported: 37,911 jobs (17th highest per 100K residents)
Tax impact & tribal revenue share: $1.3 billion (13th highest in relation to state GDP)
Gross gaming revenue: $4.7 billion (eighth highest in relation to state GDP)
Minnesota
Number of casinos: 40 casinos (eighth highest per one million residents)
Economic impact: $3.7 billion (13th highest in relation to state GDP)
Jobs supported: 29,160 jobs (10th highest per 100K residents)
Tax impact & tribal revenue share: $516.4 million (18th lowest in relation to state GDP)
Gross gaming revenue: $1.5 billion (19th lowest in relation to state GDP)
Mississippi
Number of casinos: 29 casinos (seventh highest per one million residents)
Economic impact: $4.4 billion (third highest in relation to state GDP)
Jobs supported: 37,277 jobs (third highest per 100K residents)
Tax impact & tribal revenue share: $975.6 million (third highest in relation to state GDP)
Gross gaming revenue: $2.6 billion (third highest in relation to state GDP)
Missouri
Number of casinos: 13 casinos (15th lowest per one million residents)
Economic impact: $3.5 billion (10th highest in relation to state GDP)
Jobs supported: 19,987 jobs (18th lowest per 100K residents)
Tax impact & tribal revenue share: $997.8 million (11th highest in relation to state GDP)
Gross gaming revenue: $1.9 billion (13th highest in relation to state GDP)
Montana
Number of casinos: 15 casinos (fifth highest per one million residents)
Economic impact: $55.8 million (fifth lowest in relation to state GDP)
Jobs supported: 484 jobs (fourth lowest per 100K residents)
Tax impact & tribal revenue share: $6.1 million (third lowest in relation to state GDP)
Gross gaming revenue: $34.0 million (fourth lowest in relation to state GDP)
Nebraska
Number of casinos: 7 casinos (17th highest per one million residents)
Gross gaming revenue: $15.1 million (lowest in the country in relation to state GDP)
Nevada
Number of casinos: 220 casinos (highest in the country per a million residents)
Economic impact: $56.0 billion (highest in the country in relation to state GDP)
Jobs supported: 410,456 jobs (highest in the country per 100K residents)
Tax impact & tribal revenue share: $8.3 billion (highest in the country in relation to state GDP)
Gross gaming revenue: $14.8 billion (highest in the country in relation to state GDP)
New Hampshire
Gross gaming revenue: $66.7 million (fifth lowest in relation to state GDP)
New Jersey
Number of casinos: 9 casinos (seventh lowest per one million residents)
Economic impact: $6.5 billion (11th highest in relation to state GDP)
Jobs supported: 39,007 jobs (16th highest per 100K residents)
Tax impact & tribal revenue share: $1.2 billion (15th highest in relation to state GDP)
Gross gaming revenue: $5.2 billion (ninth highest in relation to state GDP)
New Mexico
Number of casinos: 26 casinos (sixth highest per one million residents)
Economic impact: $2.2 billion (fifth highest in relation to state GDP)
Jobs supported: 17,393 jobs (fifth highest per 100K residents)
Tax impact & tribal revenue share: $380.5 million (eighth highest in relation to state GDP)
Gross gaming revenue: $1.1 billion (sixth highest in relation to state GDP)
New York
Number of casinos: 31 casinos (12th lowest per one million residents)
Economic impact: $6.5 billion (ninth lowest in relation to state GDP)
Jobs supported: 25,784 jobs (seventh lowest per 100K residents)
Tax impact & tribal revenue share: $2.0 billion (13th lowest in relation to state GDP)
Gross gaming revenue: $5.2 billion (16th lowest in relation to state GDP)
North Dakota
Number of casinos: 11 casinos (fourth highest per one million residents)
Economic impact: $491.2 million (17th highest in relation to state GDP)
Jobs supported: 4,275 jobs (seventh highest per 100K residents)
Tax impact & tribal revenue share: $59.5 million (ninth lowest in relation to state GDP)
Gross gaming revenue: $243.8 million (19th highest in relation to state GDP)
Oklahoma
Number of casinos: 142 casinos (second highest per one million residents)
Economic impact: $9.8 billion (second highest in relation to state GDP)
Jobs supported: 75,885 jobs (second highest per 100K residents)
Tax impact & tribal revenue share: $1.7 billion (second highest in relation to state GDP)
Gross gaming revenue: $4.5 billion (second highest in relation to state GDP)
Oregon
Number of casinos: 10 casinos (17th lowest per one million residents)
Economic impact: $1.3 billion (12th lowest in relation to state GDP)
Jobs supported: 10,770 jobs (15th lowest per 100K residents)
Tax impact & tribal revenue share: $163.0 million (eighth lowest in relation to state GDP)
Gross gaming revenue: $559.9 million (11th lowest in relation to state GDP)
Pennsylvania
Number of casinos: 16 casinos (10th lowest per one million residents)
Economic impact: $6.3 billion (18th highest in relation to state GDP)
Jobs supported: 33,171 jobs (16th lowest per 100K residents)
Tax impact & tribal revenue share: $2.5 billion (10th highest in relation to state GDP)
Gross gaming revenue: $5.3 billion (11th highest in relation to state GDP)
Rhode Island
Number of casinos: 2 casinos (13th lowest per one million residents)
Economic impact: $1.1 billion (sixth highest in relation to state GDP)
Jobs supported: 5,215 jobs (11th highest per 100K residents)
Tax impact & tribal revenue share: $485.0 million (fourth highest in relation to state GDP)
Gross gaming revenue: $688.2 million (fifth highest in relation to state GDP)
South Dakota
Number of casinos: 32 casinos (third highest per one million residents)
Economic impact: $457.3 million (18th lowest in relation to state GDP)
Jobs supported: 4,238 jobs (13th highest per 100K residents)
Tax impact & tribal revenue share: $77.8 million (18th highest in relation to state GDP)
Gross gaming revenue: $290.9 million (15th highest in relation to state GDP)
Tennessee
Gross gaming revenue: $379.4 million (sixth lowest in relation to state GDP)
Texas
Number of casinos: 2 casinos (lowest in the country per a million residents)
Economic impact: $418.9 million (second lowest in relation to state GDP)
Jobs supported: 3,111 jobs (second lowest per 100K residents)
Tax impact & tribal revenue share: $50.0 million (second lowest in relation to state GDP)
Washington
Number of casinos: 35 casinos (13th highest per one million residents)
Economic impact: $5.4 billion (16th highest in relation to state GDP)
Jobs supported: 35,044 jobs (15th highest per 100K residents)
Tax impact & tribal revenue share: $768.9 million (15th lowest in relation to state GDP)
Gross gaming revenue: $2.5 billion (18th highest in relation to state GDP)
West Virginia
Number of casinos: 5 casinos (19th highest per one million residents)
Economic impact: $30.0 million (third lowest in relation to state GDP)
Jobs supported: 8,347 jobs (12th highest per 100K residents)
Tax impact & tribal revenue share: $487.1 million (sixth highest in relation to state GDP)
Gross gaming revenue: $769.2 million (seventh highest in relation to state GDP)
Wisconsin
Number of casinos: 24 casinos (14th highest per one million residents)
Economic impact: $3.1 billion (15th highest in relation to state GDP)
Jobs supported: 26,882 jobs (14th highest per 100K residents)
Tax impact & tribal revenue share: $446.4 million (16th lowest in relation to state GDP)
Gross gaming revenue: $1.3 billion (18th lowest in relation to state GDP)
Wyoming
Number of casinos: 3 casinos (11th highest per one million residents)
Economic impact: $110.4 million (sixth lowest in relation to state GDP)
Jobs supported: 974 jobs (eighth lowest per 100K residents)
Tax impact & tribal revenue share: $14.4 million (fifth lowest in relation to state GDP)
Gross gaming revenue: $14.6 million (third lowest in relation to state GDP)
Story editing by Carren Jao. Copy editing by Paris Close.
This story originally appeared on ATS.io and was produced and
distributed in partnership with Stacker Studio.
