Counties with the most tornadoes in Texas

Canva
Counties with the most tornadoes in Texas
It’s been a busy year for tornadoes in the U.S. According to the National Oceanic and Atmospheric Administration, as many as 1,155 twisters have touched down across the country since the start of the year, above the average for this time of year.
A single day can drive up tornado counts. March 31, 2023, accounted for 163 tornadoes across the Midwest and South. Tornado activity usually peaks in the spring and early summer, and the pace of tornadoes usually slows around late summer. A smaller-scale second tornado season emerges in the fall, mostly in the Gulf Coast states.
Stacker used data from NOAA’s National Centers for Environmental Information to find the counties in Texas that have experienced the most tornadoes since 2000. While data is available going back to 1950, tornado tracking by the National Weather Service became more robust and accurate in the 1990s. Since counties can vary in size, they are ranked by the number of tornadoes per 100 square miles. Counties that experienced less than five tornadoes are not included.
The counties that encounter the most tornadoes aren’t all in the infamous Tornado Alley. When adjusted for county area, the top 10 counties that experienced the most tornadoes since 2000 are from nine different states, all in the Southeast with the exception of Cleveland County, Oklahoma.
Research has shown that Tornado Alley is shifting due to warming temperatures fueled by climate change. In the future, the Southeast could become the region that receives the bulk of the country’s tornadoes. It’s a concerning trend as the South is more populated than the Great Plains and has a higher concentration of mobile homes than other parts of the country, making the storms potentially deadlier and costlier.
As of August 2023, 75 people have died from tornadoes this year, and over 60% of those deaths occurred in mobile homes.
The best way to stay protected during tornadoes is to have multiple ways of receiving storm updates including social media, radio, television, and sirens, and to immediately seek shelter in a basement or interior room without windows when a tornado watch escalates to a warning.
Read on to see which counties experience the most tornadoes in Texas.
![]()

Canva
#50. Taylor County
– Tornadoes since 2000: 20 (2.18 per 100 square miles)
– #939 nationally
– Tornadoes this year, as of May 31: 0

Canva
#49. Willacy County
– Tornadoes since 2000: 13 (2.20 per 100 square miles)
– #931 nationally
– Tornadoes this year, as of May 31: 0

Canva
#48. Glasscock County
– Tornadoes since 2000: 20 (2.22 per 100 square miles)
– #912 nationally
– Tornadoes this year, as of May 31: 0
Canva
#47. Moore County
– Tornadoes since 2000: 20 (2.22 per 100 square miles)
– #909 nationally
– Tornadoes this year, as of May 31: 0

Canva
#46. Smith County
– Tornadoes since 2000: 21 (2.28 per 100 square miles)
– #866 nationally
– Tornadoes this year, as of May 31: 1

Canva
#45. Hemphill County
– Tornadoes since 2000: 21 (2.32 per 100 square miles)
– #849 nationally
– Tornadoes this year, as of May 31: 0

Canva
#44. Newton County
– Tornadoes since 2000: 22 (2.36 per 100 square miles)
– #821 nationally
– Tornadoes this year, as of May 31: 0

Canva
#43. Lipscomb County
– Tornadoes since 2000: 22 (2.36 per 100 square miles)
– #819 nationally
– Tornadoes this year, as of May 31: 0

Canva
#42. Hutchinson County
– Tornadoes since 2000: 21 (2.37 per 100 square miles)
– #815 nationally
– Tornadoes this year, as of May 31: 0

xradiophotog // Shutterstock
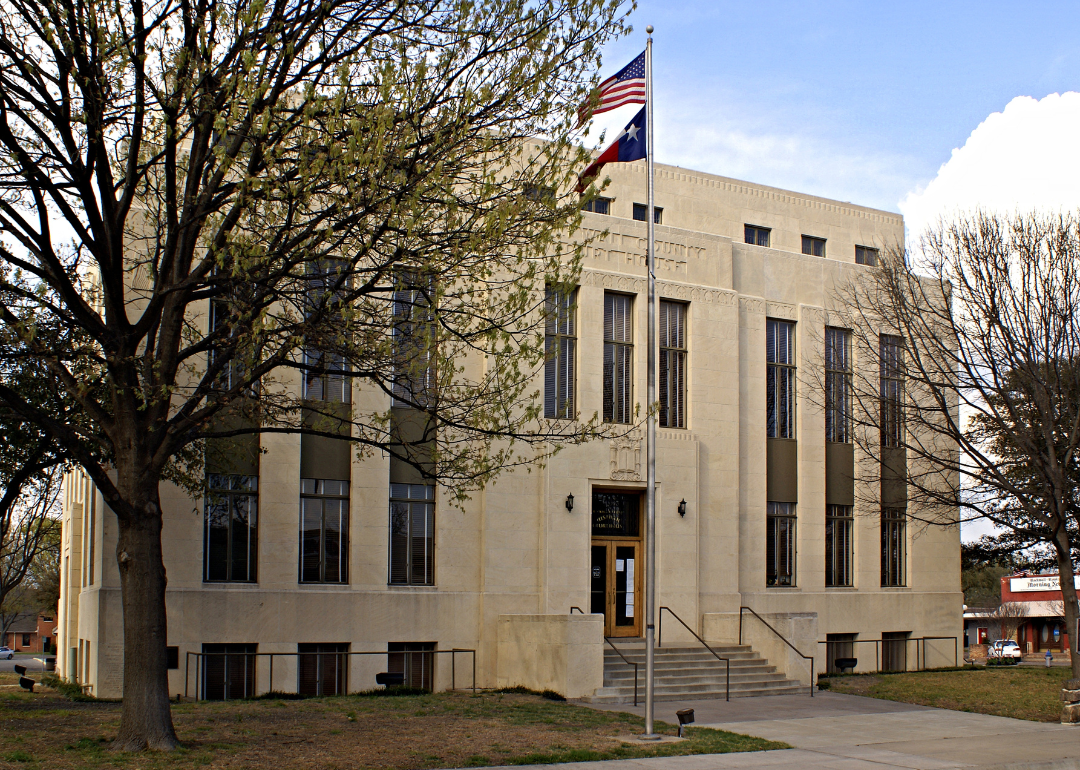
#41. Hood County
– Tornadoes since 2000: 10 (2.38 per 100 square miles)
– #807 nationally
– Tornadoes this year, as of May 31: 0

Canva
#40. Nolan County
– Tornadoes since 2000: 22 (2.41 per 100 square miles)
– #778 nationally
– Tornadoes this year, as of May 31: 0
Canva
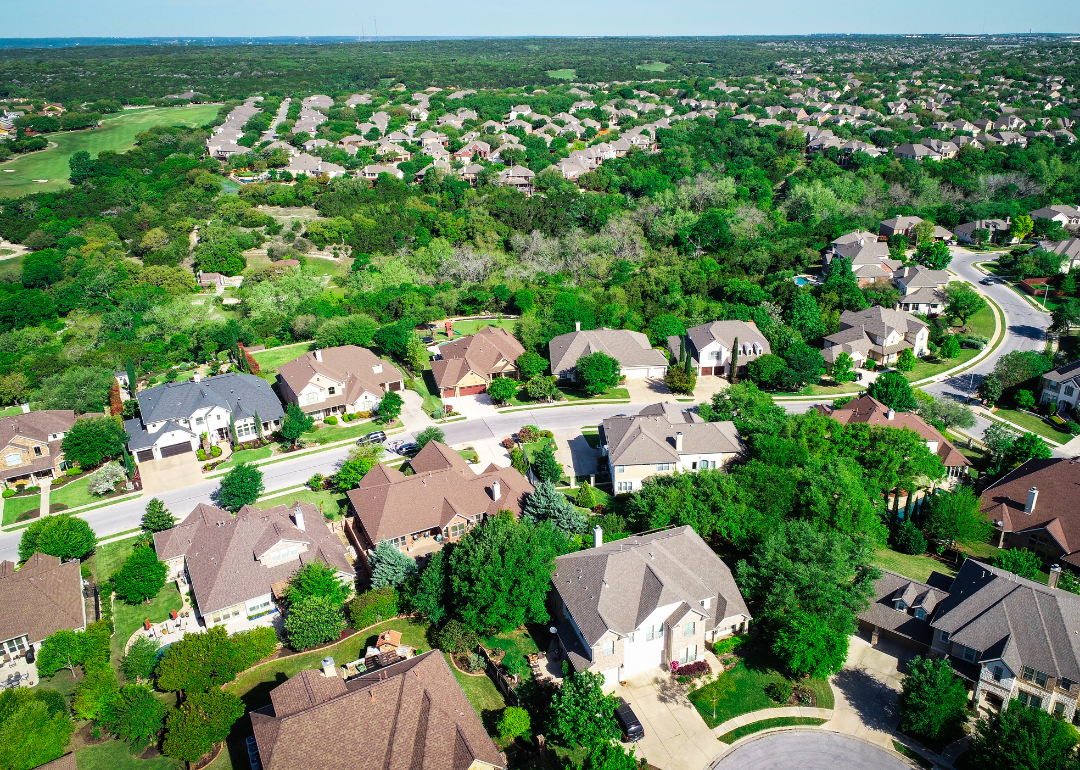
#39. Williamson County
– Tornadoes since 2000: 27 (2.41 per 100 square miles)
– #777 nationally
– Tornadoes this year, as of May 31: 0

xradiophotog // Shutterstock
#38. Floyd County
– Tornadoes since 2000: 24 (2.42 per 100 square miles)
– #773 nationally
– Tornadoes this year, as of May 31: 1

Canva
#37. Wise County
– Tornadoes since 2000: 22 (2.43 per 100 square miles)
– #763 nationally
– Tornadoes this year, as of May 31: 1

Canva
#36. Cameron County
– Tornadoes since 2000: 22 (2.47 per 100 square miles)
– #741 nationally
– Tornadoes this year, as of May 31: 1

Canva
#35. Mitchell County
– Tornadoes since 2000: 23 (2.52 per 100 square miles)
– #720 nationally
– Tornadoes this year, as of May 31: 0
Canva
#34. Armstrong County
– Tornadoes since 2000: 23 (2.53 per 100 square miles)
– #713 nationally
– Tornadoes this year, as of May 31: 0

Canva
#33. Wichita County
– Tornadoes since 2000: 16 (2.55 per 100 square miles)
– #705 nationally
– Tornadoes this year, as of May 31: 0

Canva
#32. Brazos County
– Tornadoes since 2000: 15 (2.56 per 100 square miles)
– #698 nationally
– Tornadoes this year, as of May 31: 0

mivod // Shutterstock
#31. Van Zandt County
– Tornadoes since 2000: 22 (2.61 per 100 square miles)
– #672 nationally
– Tornadoes this year, as of May 31: 0

Canva
#30. Nueces County
– Tornadoes since 2000: 22 (2.62 per 100 square miles)
– #665 nationally
– Tornadoes this year, as of May 31: 0
Canva
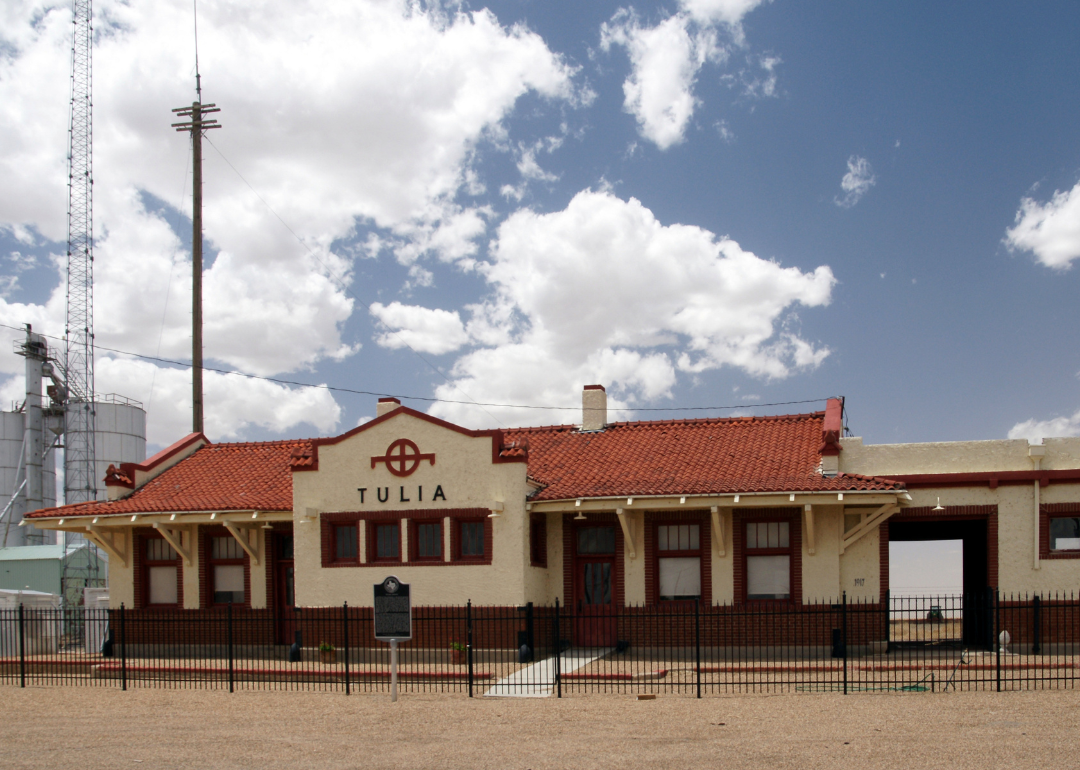
#29. Swisher County
– Tornadoes since 2000: 24 (2.70 per 100 square miles)
– #632 nationally
– Tornadoes this year, as of May 31: 1

Roberto Galan // Shutterstock
#28. Brazoria County
– Tornadoes since 2000: 37 (2.73 per 100 square miles)
– #626 nationally
– Tornadoes this year, as of May 31: 1
Canva
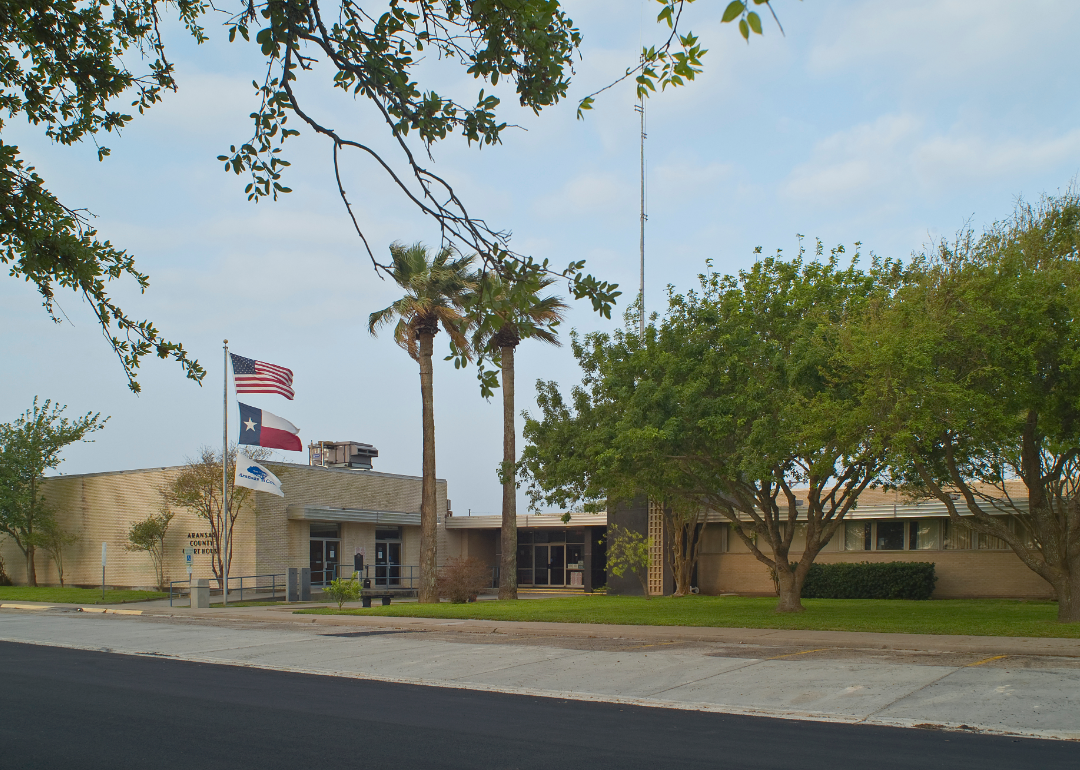
#27. Aransas County
– Tornadoes since 2000: 7 (2.78 per 100 square miles)
– #599 nationally
– Tornadoes this year, as of May 31: 0
Canva
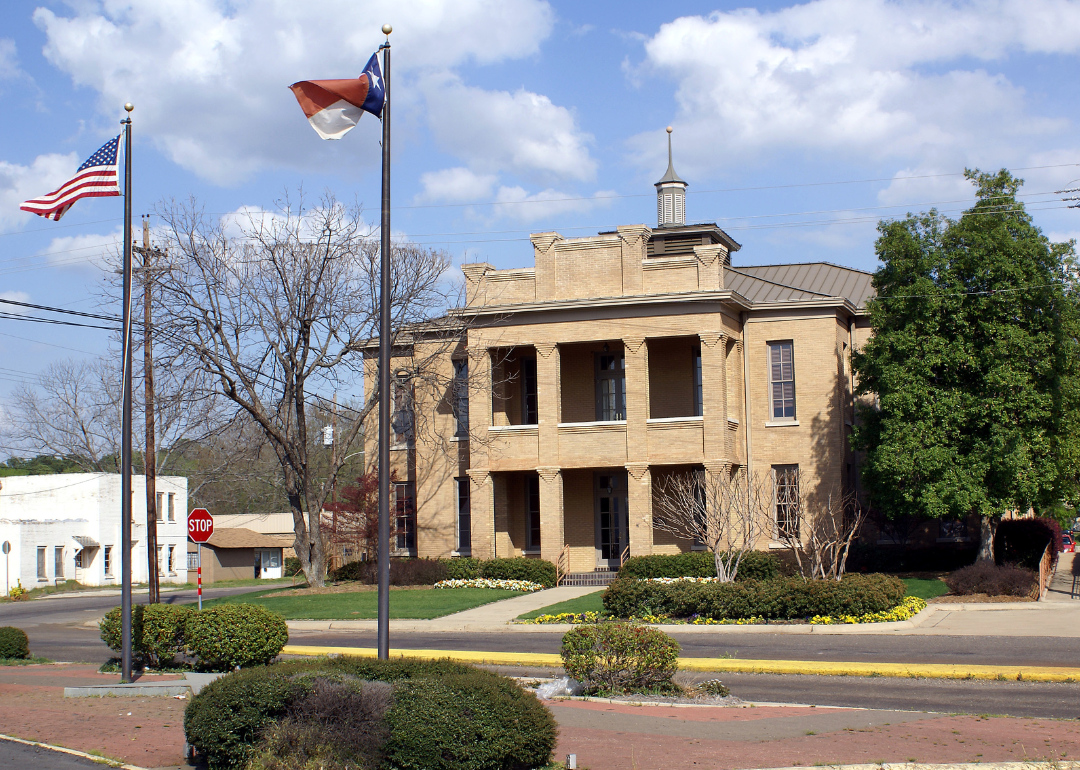
#26. Morris County
– Tornadoes since 2000: 7 (2.78 per 100 square miles)
– #598 nationally
– Tornadoes this year, as of May 31: 0

Canva
#25. Denton County
– Tornadoes since 2000: 25 (2.85 per 100 square miles)
– #568 nationally
– Tornadoes this year, as of May 31: 0

Canva
#24. Ellis County
– Tornadoes since 2000: 27 (2.89 per 100 square miles)
– #554 nationally
– Tornadoes this year, as of May 31: 0

Canva
#23. Castro County
– Tornadoes since 2000: 26 (2.91 per 100 square miles)
– #542 nationally
– Tornadoes this year, as of May 31: 0

Roberto Galan // Shutterstock
#22. Gregg County
– Tornadoes since 2000: 8 (2.93 per 100 square miles)
– #537 nationally
– Tornadoes this year, as of May 31: 0
Canva
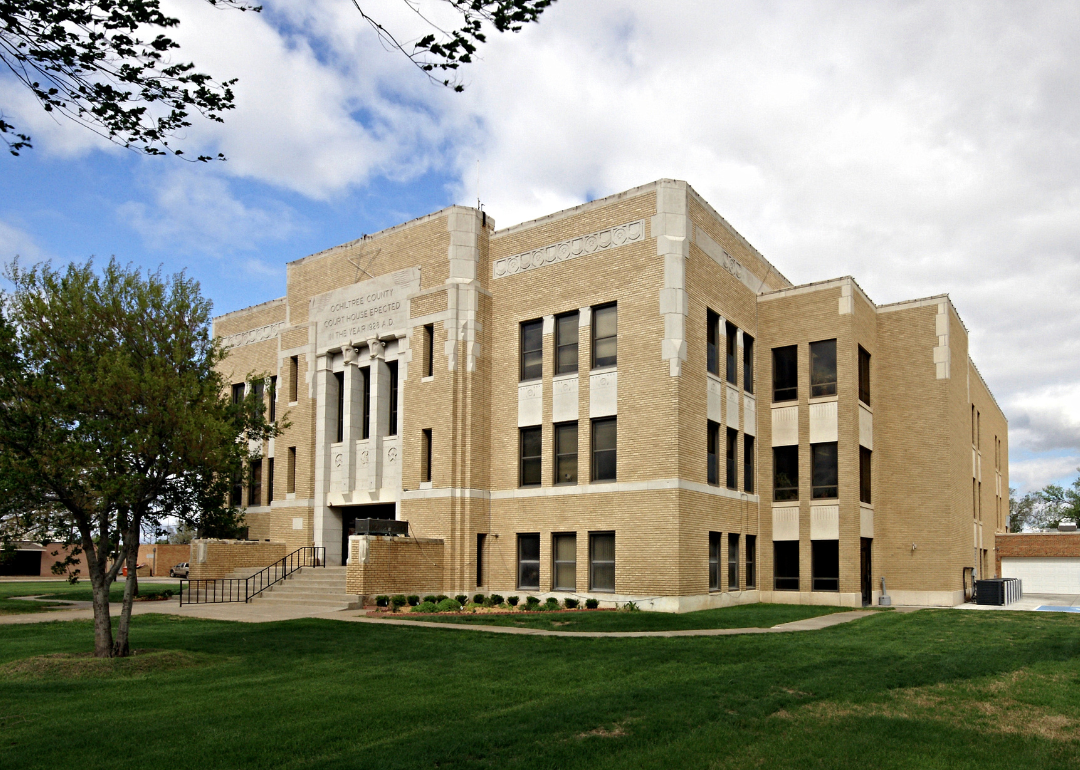
#21. Ochiltree County
– Tornadoes since 2000: 27 (2.94 per 100 square miles)
– #527 nationally
– Tornadoes this year, as of May 31: 0

Canva
#20. Randall County
– Tornadoes since 2000: 27 (2.96 per 100 square miles)
– #518 nationally
– Tornadoes this year, as of May 31: 0

Canva
#19. Haskell County
– Tornadoes since 2000: 27 (2.99 per 100 square miles)
– #498 nationally
– Tornadoes this year, as of May 31: 0

Canva
#18. Panola County
– Tornadoes since 2000: 24 (2.99 per 100 square miles)
– #496 nationally
– Tornadoes this year, as of May 31: 0

Canva
#17. Fort Bend County
– Tornadoes since 2000: 26 (3.02 per 100 square miles)
– #491 nationally
– Tornadoes this year, as of May 31: 1

Canva
#16. Carson County
– Tornadoes since 2000: 28 (3.04 per 100 square miles)
– #483 nationally
– Tornadoes this year, as of May 31: 1

Canva
#15. Donley County
– Tornadoes since 2000: 29 (3.13 per 100 square miles)
– #450 nationally
– Tornadoes this year, as of May 31: 0

Timothy L Barnes // Shutterstock
#14. Franklin County
– Tornadoes since 2000: 9 (3.16 per 100 square miles)
– #434 nationally
– Tornadoes this year, as of May 31: 1

Roberto Galan // Shutterstock
#13. Jasper County
– Tornadoes since 2000: 30 (3.20 per 100 square miles)
– #417 nationally
– Tornadoes this year, as of May 31: 0
Canva
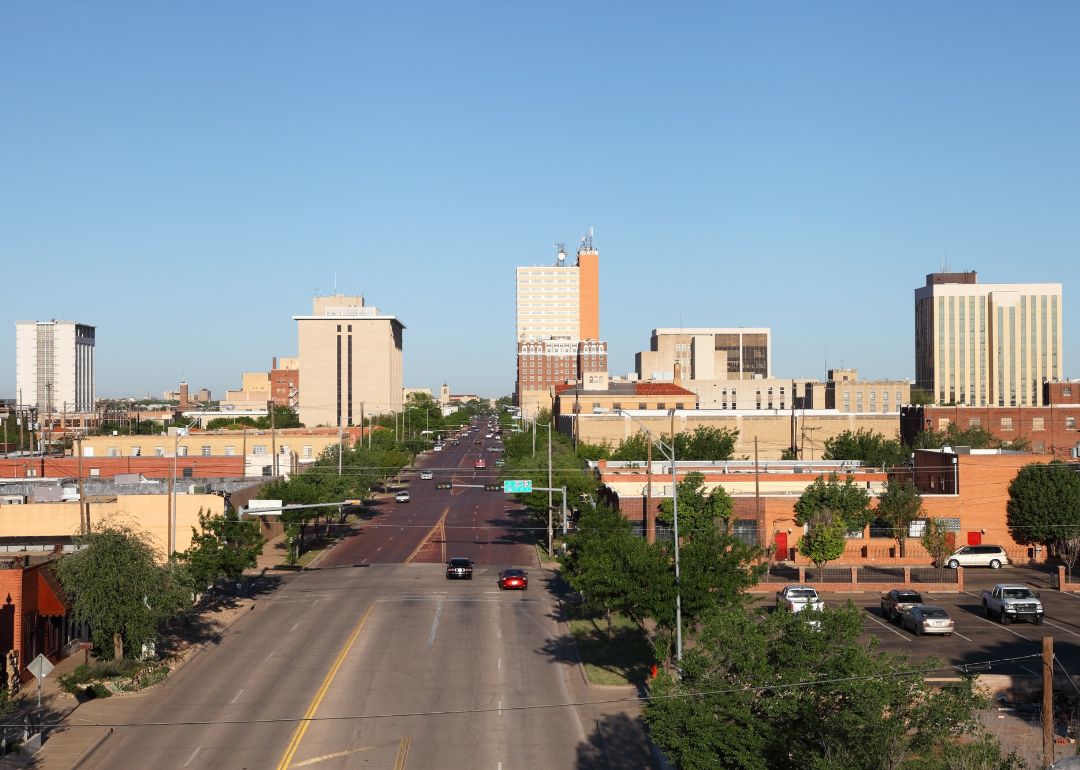
#12. Lubbock County
– Tornadoes since 2000: 29 (3.24 per 100 square miles)
– #402 nationally
– Tornadoes this year, as of May 31: 0

Canva
#11. Gray County
– Tornadoes since 2000: 31 (3.35 per 100 square miles)
– #366 nationally
– Tornadoes this year, as of May 31: 0

Canva
#10. San Patricio County
– Tornadoes since 2000: 24 (3.46 per 100 square miles)
– #338 nationally
– Tornadoes this year, as of May 31: 0

Roberto Galan // Shutterstock
#9. Cass County
– Tornadoes since 2000: 33 (3.52 per 100 square miles)
– #319 nationally
– Tornadoes this year, as of May 31: 2

Canva
#8. Dallas County
– Tornadoes since 2000: 33 (3.79 per 100 square miles)
– #267 nationally
– Tornadoes this year, as of May 31: 2

Canva
#7. Rusk County
– Tornadoes since 2000: 38 (4.11 per 100 square miles)
– #211 nationally
– Tornadoes this year, as of May 31: 0

Canva
#6. Harris County
– Tornadoes since 2000: 72 (4.23 per 100 square miles)
– #195 nationally
– Tornadoes this year, as of May 31: 1

Canva
#5. Harrison County
– Tornadoes since 2000: 41 (4.56 per 100 square miles)
– #149 nationally
– Tornadoes this year, as of May 31: 0

Roberto Galan // Shutterstock
#4. Johnson County
– Tornadoes since 2000: 39 (5.38 per 100 square miles)
– #82 nationally
– Tornadoes this year, as of May 31: 0

Canva
#3. Tarrant County
– Tornadoes since 2000: 48 (5.56 per 100 square miles)
– #76 nationally
– Tornadoes this year, as of May 31: 0
Canva
#2. Rockwall County
– Tornadoes since 2000: 8 (6.30 per 100 square miles)
– #43 nationally
– Tornadoes this year, as of May 31: 0
Canva
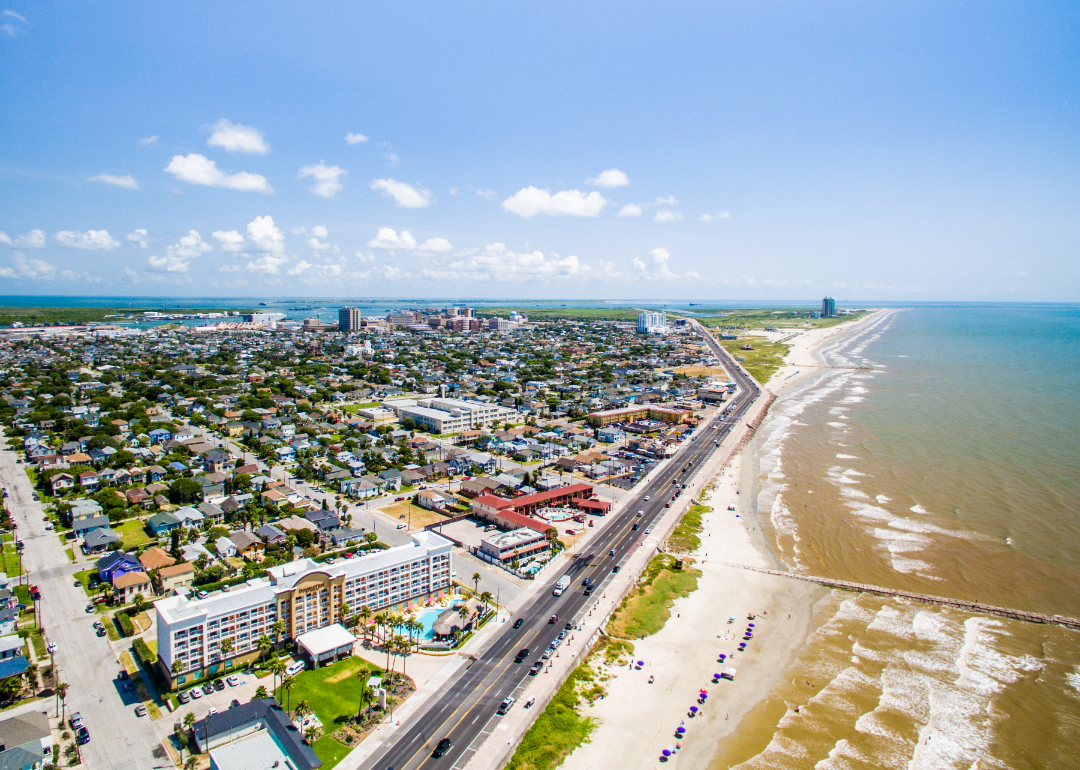
#1. Galveston County
– Tornadoes since 2000: 34 (8.99 per 100 square miles)
– #9 nationally
– Tornadoes this year, as of May 31: 0
